Most model generated projections of climate change for the future decades only consider anthropogenic activities. It is hard to think about the effects of solar activity and volcano effects, because the predictions of both solar activity and volcano effects are difficult. But as we know, the sun is the source of energy for the Earth’s climate system, and observations show it to be a variable star. Therefore, the solar activity is a significant external forcing in the future projections [ Wang et al ., 2012 ; Zhao, 2011 ; Gray et al ., 2010 ]. In recent years, some studies considered the impacts of the 11-year cycle of the sunspot numbers on climate change and incorporated it into the climate models for climate projections [ Meehl et al ., 2013 ; Dikpati et al ., 2010 ; Owens et al ., 2011 ; Lockwood et al ., 2011 ; Bal et al ., 2011 ; Lockwood and Frohlich, 2008 ]. This paper attempts to review the studies of the effects of the 11-year cycle of sunspot numbers on the multi-decadal climate projections.
1. Solar variability of decadal time scale
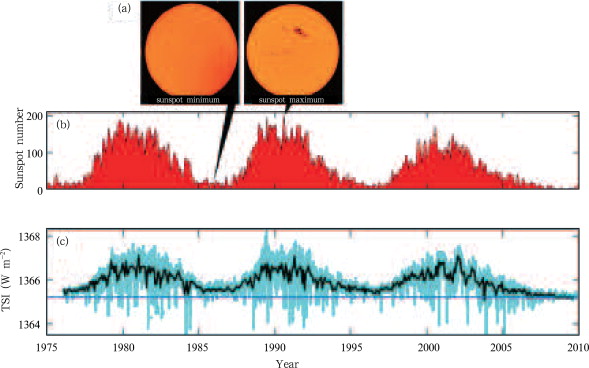
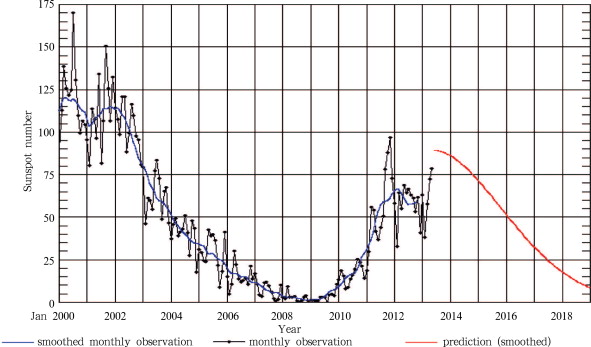
The observed data series of sunspot numbers are very long, and the 11-year cycle is a major characteristic of the solar activity variability and more studies have focused on it [ Wang et al ., 2012 ; Zhao, 2011 ]. Some studies showed that the difference of the total solar irradiance (TSI) between the sunspot maximum (Smax ) and sunspot minimum (Sm in ) is about 1 W m–2 (Fig. 1 ). The TSI during Smax is larger than that during Sm in , especially for the period of no sunspots, such as Maunder Minimum (MM). It should be pointed out for the latest 11-year cycle the just passed Cycle 23 had anomalous low sunspot numbers and Sm in was near zero [ Owens et al. , 2011 ]. Figure 2 gives the sunspot numbers progression provided by the Space Weather Prediction Center/National Oceanic and Atmospheric Administration (SWPC/NOAA) for the observation from January 2000 to May 2013 and prediction from June 2013 to January 2019. It can be noticed in Figure 2 that the sunspot in 2009 was closed to 0. At present time, it is the raising phase of Cycle 24. Cycle 24 will be ended in 2019.
|
|
|
Figure 1. (a) Images of the sun at sunspot minimum (left) and sunspot maximum (right), (b) observed variation of sunspot numbers, and (c) observed variation of total solar irradiance (TSI) (monthly mean data are used, and light blue lines are daily TSI values) [ Gray et al ., 2010 ; Lockwood and Frohlich, 2008 ] |
|
|
|
Figure 2. Sunspot numbers progression by SWPC/NOAA. Blue line is smoothed monthly observation, black line is monthly observation, and red line is prediction (smoothed) (http://www.swpc.noaa.gov/SolarCycle ) |
In recent years, most studies have focused on the climate changes related to the 11-year cycle of sunspots, such as stratosphere, troposphere and surface responses (including ocean and land). The studies used the surface and satellite observation data, as well as the re-analysis data. The statistic methods such as correlation analysis, unitary and multi-regressions analysis have been employed to assess the relationships between the 11-year cycle of sunspots and changes in climate variables. The differences of climate variables during Smax and Smin were also studied [ Gray et al. , 2010 ]. Unfortunately, only a few studies used the Earth system models to assess the relationship [ Bal et al. , 2011 ]. Based on reference [ Gray et al. , 2010 ], Table 1 presents the data sources and calculation methods, as well as the results of some climate variables related to the 11-year solar activity cycle. The rightmost column of Table 1 gives the evidence numbers of references and models.
| Climate variable | Data and method | Result | Evidence number of references (models) |
|---|---|---|---|
| Ozone at stratosphere | Satellite and station data for 1985–2003, multi-regression analysis | On the 11-year time scale, the mean irradiance has varied by ~ 6%, and upper stratosphere ozone genesis increased 2%—4%, over the past two solar cycles (95% confidence) | 5 |
| Temperature and zonal wind speed in the stratosphere | ERA40, multi-regression analysis | Smax minus Smin, a maximum response of ~ 2 K is found in the tropical upper stratosphere, and the zonal wind in the upper subtropical stratosphere enhanced (95%–99% confidence) | 12 |
| QBO | Monthly mean 30 hPa geopotential heights in February at the North Pole for 1942–2010, scatter diagram | QBO-east (–west) phase, geopotential height decreases (increases) with increasing sunspot numbers; in the equatorial lower stratosphere, a longer QBO-west phase during S max than S min | 15 |
| Temperature and wind speed in the troposphere | ERA40 and NCEP/NCAR reanalysis data for 1968–2002, correlation analysis | Atmospheric mean temperature at Hawaii is 0.5–1.0 K warmer during Smax than Smin, mean summer zonally averaged temperature of the Northern Hemisphere upper troposphere with amplitude of 0.2–0.4 K, winds in the mid-latitude jets are weaker and farther poleward during Smax than Smin | 5 |
| Tropical circulation at troposphere | NCEP/NCAR reanalysis data, radiosonde data | Hadley cell shifts poleward, Walker circulation is stronger, Intertropical Convergence Zone (ITCZ) and South Pacific Convergence Zone (SPCZ) move poleward during Smax | 25 |
| Extratropical modes of variability at troposphere | Reanalysis data, correlation analysis, unitary and multi-regression | There are not enough evidences to indicate Arctic Oscillation (AO), North Atlantic Oscillation (NAO), Northern Annular Mode (NAM) and Southern Annular Mode (SAM) response to sunspot 11-year cycle | 13 |
| Clouds and precipitation | Cloud data from International Satellite Cloud Climatology Project (ISCCP) | A strong positive correlation between monthly low cloud amount and galactic cosmic ray, but some controversy | 6 |
| Three Smax years, and precipitation composite | Precipitation over equatorial western Pacific decreased by 1.4–1.6 mm d–1 , and increased by 1.4–1.6 mm d–1 in ITCZ and SPCZ | 9 | |
| SST (sea surface temperature) | Surface marine weather observation (1900–1991), upper ocean bathythermograph temperature profiles (1955–1994) | During Smax, SSTA is –0.2 to –0.6 K over equatorial eastern Pacific; maximum global mean SST changes by (0.08±0.02) K for 11-year cycle, and (0.14±0.02) K for 22-year cycle; the highest correlations were obtained with ocean temperatures lagging solar activity by 1–2 years | 7(1) |
| Land temperature | Observational data | Solar cycle has the relationships with land surface temperatures in some regions | 2 |
Take QBO as an example, the relationships between QBO and the 10.7 cm solar flux for 1942–2010 were analyzed. The correlation coefficient was –0.33 and the difference of the geopotential heights during Smax and Smin was –389 m for the 31-year QBO-east phase. For the 38-year QBO-west phase, the correlation coefficient was 0.49 and the difference was 554 m.
In another example, the correlation coefficients between the 10.7 cm solar flux and July temperature at 30 hPa for the 35 years of 1968–2002 were computed. The maximum correlation is 0.71 at 30°N of subtropical region; the minimum is –0.22 in the tropical region. For the 16 years of east phase, the maximum correlation is 0.92 in the subtropical region of both Hemispheres, and the minimum in other regions was –0.32. The maximum is 0.71 in the small parts of 30°N, and the minimum in other regions was –0.39 for the 19 years of west phase [ Gray et al. , 2010 ].
The mature mechanism for the relationship between the solar irradiance and climate change is that the solar ultraviolet radiation change directly impacts the ozone at the stratosphere, leading to temperature change in the stratosphere. The change in temperature gradient in the stratosphere causes changes in zonal winds, and even the changes of both planetary waves and air flow.
It should be emphasized that on the one hand there are limited observational data, and the relationships between the 11-year sunspot cycle and climate changes need to be supported by evidences from both more observational data and climate model experiments; on the other hand, the mechanisms and feedback processes between solar activity and climate change should be understood more.
3. Interdecadal climate projections with input of the 11-year cycle of sunspots
In recent years, some investigations started to use the TSI change due to the 11-year cycle of sunspots as an input forcing to the climate models in the multidecadal projections. One way is to add the 20th century average TSI corresponding to the maximum and minimum years of the sunspots in the predicted future 11-year cycle of the sunspots. However, this relys on the prediction of the future 11-year cycle of sunspots. It is difficult to make this prediction and thus the prediction involves large uncertainties. Another way is to input the TSI of a special period such as MM into the climate models to make future climate projections. This will provide an impact of the grand solar minimum of the 11-year cycle on the future climate changes [ Gray et al ., 2010 ; Meehl et al ., 2013 ; Dikpati et al ., 2010 ; Lockwood et al ., 2011 ; Bal et al ., 2011 ; Lockwood and Frohlich, 2008 ].
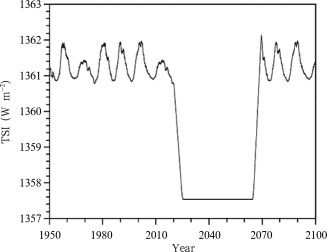
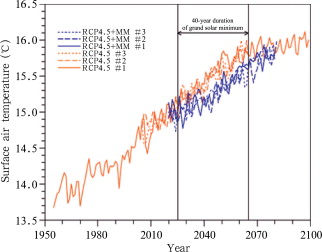
One representative study published in 2013 [ Meehl et al. , 2013 ] was to concentrate on the effect of the grand solar minimum upon the future climate changes by using an Earth system model (CESM1) combined with a full atmosphere model (WACCM). The whole model was called CESM1 (WACCM). The atmospheric component model has 66 vertical levels extending up to a height of approximately 140 km, and a horizontal resolution of 1.9° latitude by 2.5° longitude, and includes ozone chemistry and wavelength dependence of solar absorption. The ocean component is a version of the Parallel Ocean Program (POP) with a nominal latitude-longitude resolution of 1° (down to 0.25° in latitude in the equatorial tropics) and 60 levels in the vertical. A future MM-type grand solar minimum, with TSI reduced by 25% over a 50-year period from 2020 to 2070 (Fig. 3 ), is imposed in a future climate change scenario experiment (RCP4.5). This experiment (called RCP4.5+MM) compares with the experiment RCP4.5 to show the action of the grand solar minimum for the future climate change. Three ensembles for each experiment have been run, respectively. Figure 4 gives the time series of globally averaged surface air temperature for CESM1 (WACCM) standard RCP4.5 simulation and the grand solar minimum experiment RCP4.5+MM. The geographical distributions of surface air temperature for three periods (2026–2035, 2036–2045, and 2046–2065) have been calculated also (Figures are not shown). The results indicated: 1) with the continuing anthropogenic emissions, the future global warming characteristics will be continuing with or without the grand solar minimum. It means that the increase of anthropogenic emissions plays a leading role in global warming; 2) the future global warming for RCP4.5+MM is very likely less than that of the RCP4.5. For example, the global warming of (0.10±0.05)°C per decade for RCP4.5+MM in 2020–2040 is lower than RCP4.5 which is (0.18±0.05)°C per decade; 3) a warming of 0.64°C for RCP4.5+MM in 2026–2035 relative to 1986–2005 has been found, but it becomes 0.80°C for RCP4.5 in the same period. So, the difference between RCP4.5 and RCP4.5+MM is 0.16°C (19%). It is 24% in 2036–2045. But by the end of the grand solar minimum in 2070, the warming nearly catches up to the reference simulation.
|
|
|
Figure 3. Time series of TSI input to CESM1 (WACCM) showing a reduction of 25% during 2025–2065 [ Meehl et al. , 2013 ] |
|
|
|
Figure 4. Time series of globally averaged surface air temperature for CESM1 (WACCM) standard RCP4.5 simulation and the grand solar minimum experiment RCP4.5+MM. The duration of the grand solar minimum shown in Figure 3 is indicated from 2025 to 2065 [ Meehl et al. , 2013 ] |
Therefore, under the increasing anthropogenic emissions in the future, the impact of the grand solar minimum such as MM-type is likely to reduce the global warming by about 20%. It means that a future grand solar minimum could slow down but not stop the global warming. These conclusions should be verified by more projection experiments from many other climate models.
Acknowledgements
This paper was supported by National Natural Science Foundation of China (No. 41175066 and 41305054).
References
- Bal et al., 2011 S. Bal, S. Schimanke, T. Spangehl, et al.; On the robustness of the solar cycle signal in the pacific region; Geophy. Res. Lett., 38 (2011) http://dx.doi.org/10.1029/2011GL047964
- Dikpati et al., 2010 M. Dikpati, P.A. Gilman, R.P. Kane; Length of a minimum as predictor of nest solar cycle’s strength; Geophy. Res. Lett., 37 (2010) http://dx.doi.org/10.1029/2009GL042280
- Gray et al., 2010 L.J. Gray, J. Beer, M. Geller, et al.; Solar influences on climate; Rev. Geophys., 48 (2010) http://dx.doi.org/10.1029/2009RG000282
- Lockwood and Frohlich, 2008 M. Lockwood, C. Frohlich; Recent oppositely directed trends in solar climate forcings and the global mean surface air temperature: II different reconstructions of the total solar irradiance variation and dependence on response time scale; Proc. R. Soc., 464 (2008), pp. 1367–1385
- Lockwood et al., 2011 M. Lockwood, M.J. Owens, L. Barnard, et al.; The persistence of solar activity indicators and the descent of the sun into Maunder Minimum conditions; Geophy. Res. Lett., 38 (2011) http://dx.doi.org/10.1029/2011GL049811
- Meehl et al., 2013 G.A. Meehl, J.M. Arblaster, D.R. Marsh; Could a future “Grand Solar Minimum” like the Maunder Minimum stop global warming?; Geophy. Res. Lett., 40 (2013) http://dx.doi.org/10.1002/grl50361
- Owens et al., 2011 M.J. Owens, M. Lockwood, L. Barnard, et al.; Solar cycle 24: Implications for energetic particles and long-term space climate change; Geophy. Res. Lett., 38 (2011) http://dx.doi.org/10.1029/2011GL049328
- Wang et al., 2012 S.-W. Wang, Y. Luo, Z.-C. Zhao, et al.; Attribution of climate warming to the causes; Advances in Climate Change Research (in Chinese), 8 (4) (2012) 1673-1719.2012.04.000 http://dx.doi.org/10.3969/j.issn. 1673-1719.2012.04.000
- Zhao, 2011 Z.-C. Zhao; Impacts of Natural Factors on the Global Climate Change , 10 ,000 Selected Problems In Science (Erath Science) (in Chinese), Science Press (2011), pp. 854–859
Document information
Published on 15/05/17
Submitted on 15/05/17
Licence: Other
Share this document
Keywords
claim authorship
Are you one of the authors of this document?


