Abstract
Based on the records of social revolts in the Actual Annals of Qing Dynasty (a collection of official records), the revolts frequency (amount of counties where revolts happened every year) in North China Plain during the Qing Dynasty (1644–1911) is reconstructed. By comparing revolts frequency with temperature and precipitation series, the interaction between climate and social responses is analyzed. It can be concluded that revolts broke out more frequently in colder periods and less frequently in warmer periods. There were much more revolts in drought decades than in wet decades, and the three fatal peasant uprisings in the Qing Dynasty were all ignited by severe droughts. The impacts of changes in temperature and precipitation on revolts should be estimated at different time scales. The correspondence emerged at neither decadal nor yearly scale until the turn between 18th and 19th centuries, the critical period when per capita cropland area decreased to a vulnerable level. Food crisis increased the vulnerability of local society, and changes in temperature and precipitation became an important trigger for revolts.
Keywords
Qing Dynasty ; North China Plain ; revolt ; climate change
1. Introduction
As an important field in the current research on the impacts of and adaptation to climate change, reconstructing the relationship of historical social revolts and climate change could contribute to scientific understanding of the past interactive mechanism among natural forcings, ecosystems, and human society [ PAGES, 2009 and Hsiang et al., 2011 ]. Due to the frequent recurrence of social or political upheavals (peasant uprisings, alien invasion, regime change, etc.) in China’s history, related information is plentiful in historical literature, some of which has been extracted and used in historical empirical study of regional scale. The hypothesis that the negative impacts on agricultural production brought by climate change (especially temperature and precipitation) are an important trigger of historical upheavals has been widely recognized and reconstructed [ Fang et al., 2004 ], although there are different viewpoints on the mechanism. In some scenarios, severe cold climate [ Wang et al., 2005 ] or extreme drought/flood [ Li, 1992 ] caused agricultural crisis and peasant uprisings, and in other scenarios, the nomadic tribes’ invasion of farming areas was triggered by the switch of agro-pastoral transitional zones [ Wang, 1996 ].
Quantitative research is a key to understand how past climate change triggered upheavals. Reconstruction of a proxy historical index has been one of the popularly used quantitative research methods in recent years, such as the correlation analysis by Ge and Wang [1995] on frequency of counties which got food and tax relief for meteorological disasters and peasant uprisings during 1796–1850; the comparison, by Zhang et al. [2005] , of reconstructive temperature series in the Northern Hemisphere and China during 850–1911 with frequency, type, geographic distribution of wars and regime change in corresponding period; the discussion, by Ye et al. [2004] , of spatio-temporal correspondence and its phase change between occurrences of revolts and droughts/floods in Shandong province during the late Qing Dynasty, and so on. In these cases, the uncertainty of analysis on mechanism has been effectively reduced by abundant samples and statistical methods, on the basis of which, more accurate assessment of climatic impacts, and better understanding of man-land interactive mechanism could be achieved.
In this paper, based on the historical record in Actual Annals of Qing Dynasty [Le et al., 1985–1987 ], the revolts frequency (amount of counties where revolting events happened every year) in the North China Plain (NCP) during 1644–1911 is reconstructed. With correlation analysis between revolts frequency and temperature and precipitation, relationship of climate and revolts, and its temporal change are evaluated. The mechanism on how climate change affected human society and triggered revolts is preliminarily discussed in the background of man-land relationship in corresponding periods.
2. Study area
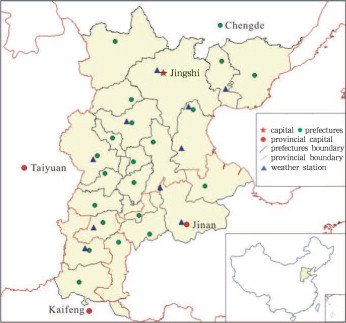
In this paper, the NCP was composed of 22 prefectures (Fu) and 198 counties (Xian), and covered most of Zhili province (south of the Great Wall), northeast Henan, and northwest Shandong in 1820 [ Niu, 1990 ] (Fig. 1 ). In modern times, the NCP encompasses Beijing and Tianjin, most of Hebei, and a portion of Henan and Shandong. Similar natural conditions (topography, climate, vegetation, etc.) contribute to similar socio-economic conditions, while homogeneous topography (plain) benefits the communication among districts in different provinces. Throughout the Qing Dynasty, NCP had always been a political and economic powerhouse as the surrounding districts of the capital.
|
|
|
Figure 1. Administrative division of the NCP in 1820① |
NCP is located in warm temperate zone, and local climate is strongly affected by the East Asian monsoon system. Due to the high variability and uneven distribution of precipitation, severe droughts/floods are a huge threat to agriculture [ Gu, 1991 ].
3. Data and methods
3.1. Reconstruction of revolts frequency
The main source of historical information is the Actual Annals of Qing Dynasty , which is a collection of official records edited on a daily basis. The Actual Annals of Qing Dynasty contains 4,433 volumes, and is the most important original document for studying the Qing Dynasty. Raw records about every revolt, which included location of outbreak, affected region, duration and seriousness, were examined in order to quantify the frequency. Because there was a lack of information on Yihetuan Movement during 1899–1901 in the Actual Annals of Qing Dynasty, records on Yihetuan Movement are obtained from Li [1986] .
Revolts were divided into three kinds by seriousness, which are mass demonstration, banditry incident, and armed uprising. Based on the spatiotemporal information, revolts frequency was quantified with a proxy index of county-time per year, which means one county was affected by a certain number of revolts in one year. In total, 661 county-time revolts occurred during 1644–1911 in NCP, in which 105 were mass demonstrations, 349 banditry incidents, and 207 armed uprisings (Fig. 2 b & 3 c).
|
|
|
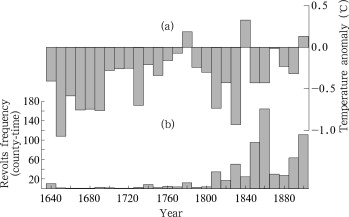
Figure 2. Time series of decadal (a) temperature and (b) revolts frequency in NCP during 1644–1911 |
|
|
|
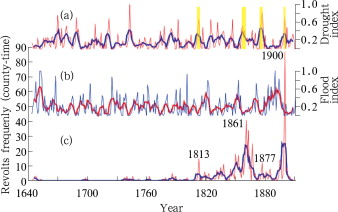
Figure 3. Variations of (a) drought, (b) flood index, and (c) revolts frequency in NCP during 1644–1911 (thick line denotes the 5-year running mean, respectively; the yellow shadows in (a) show extreme droughts; the figures in (c) represent peak years of revolts) |
3.2. Data of historical climate
The change of temperature in the NCP was analysed using data from North China since 1380, which was reconstructed by Wang [1991] . In the series, the average temperature of 1880–1979 was used as a reference, and the resolution of the data was 10 years (Fig. 2 a).
Changes in precipitation were described using the dryness/wetness grades data presented in the Yearly Charts of Dryness/Wetness in China for the Last 500-Year Period [ CMA, 1981 ]. Using the yearly dryness/wetness grades obtained from 10 stations in the NCP (Beijing, Tianjin, Tangshan, Baoding, Cangzhou, Shijiazhuang, Handan, Anyang, Dezhou, Jinan) (Fig. 1 ) during 1644–1911, the yearly drought index (Pd) and flood index (Pf) in NCP were constructed by determining the weighted average according to the method described by Chen [1989] (Pd and Pf ranged from 0 to 1; thus, the intensity of disaster varied from slight to severe) (Fig. 3 a & 3 b).
4. Results and discussion
4.1. Relationship between revolts and temperature
Comparing revolts frequency with temperature (Fig. 2 ), it’s found that the periods of social upheaval usually correspond to the cold periods, although the rule differed in different time scale.
For centurial scale, in the 18th century, which was a relatively warm period in the Little Ice Age (LIA), revolts occurred less frequently than the 19th century, the last cold period of LIA, which was characterized with prevalence of social turbulence. In the coldest century of LIA (the 17th century), NCP suffered from a series of peasant uprisings, alien invasion and regime change before 1644 (the beginning of the Qing Dynasty), but after that, revolts frequency sharply decreased. The results suggested the complexity of the relationship between climate and social response in long time scale.
For decadal scale, during 1640s–1790s, correspondence of the two series is not distinct. From the beginning of the 19th century, although the oscillating increase of revolts frequency, which was generally a result of intensification of social conflicts in NCP, is not reflected in temperature change, almost all the decades when frequency sharply increased (e.g., 1810s, 1830s, 1850s–1860s, 1890s–1900s) corresponded with cold stage. In the former three periods, increase in frequency and decline in temperature occurred simultaneously, while the last one had an about 10-year time lag to cold stage of 1880s–1890s. It can be interpreted that the trend of social conflicts during this period could be affected by decadal temperature change to a certain extent.
According to the experience of agricultural production in China, in the scenario that temperature rises by 1 °C, change of crop maturing level along with the increase of accumulated temperature would bring a potential growth of yield by 10%. Considering less cold damages in a warmer climate, higher growth of yield could be achieved [ Zhang, 1982 ]. In the Qing Dynasty, decadal fluctuations of temperature in the NCP was often more than 1 °C, which would cause a significant variation in food yield.
Besides, in China’s history, extreme natural disasters occurred more frequently in cold periods. According to the historical drought/flood chronology in North China reconstructed by Wang et al. [1993] , in the cold 19th century, there were 30 years with extreme drought (dryness grade = 5) or flood (wetness grade = 1), which were much more than those in the warm 18th century (20), especially the years with extreme drought (18 in the 19th century, 10 in the 18th century). There were 4 extreme droughts, which lasted for more than 2 years in the 19th century (1811–1813, 1857–1860, 1875–1877, and 1899–1900), while only 1 in the 18th century (1720–1722). The fall of temperature and high variability of precipitation resulted in much more frequent poor harvests in the 19th century than in the 18th century, as reflected in harvest type series in North China (Fig. 4 d) [ Zhang, 1996 ].
|
|
|
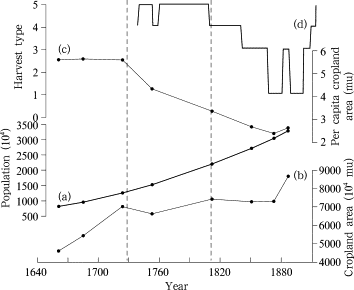
Figure 4. Change of man-land conflict in NCP during 1644–1911, (a) population (calculated with data from [ Cao, 2001 ]), (b) cropland area (based on [ Liang, 2008 ]), (c) per capita cropland area, (d) harvest type (based on [ Zhang, 1996 ])② |
The negative impacts of climate on food production would be undoubtedly an immediate threat to social stability, which was an acceptable explanation to frequent social upheavals in cold periods in China’s history. However, comparing with precipitation, the variation of temperature was usually more moderate, and thus it became a gradual process for negative impacts to accumulate, which would certainly be decelerated by human perception and adaptation, besides. To sum up, impacts of temperature change on human society are more difficult to identify than precipitation, especially in long time scale, the lack of historical climate series with high resolution and related historical document is not conducive to further research in short time scale (year).
4.2. Relationship between revolts and precipitation
With the correlation analysis of the revolts frequency and droughts/floods index series (Fig. 3 ), it is found that there was a significantly positive correlation between droughts and revolts frequency during 1644–1911 (r = 0.22, significant at 99% confidence level), while an insignificantly negative correlation between floods and revolts frequency (r =–0.06). During 1780–1911, the late Qing Dynasty, correlation between droughts and revolts frequency turned even more obvious (r = 0.31, significant at 99% confidence level).
Comparing typical cases of revolts with droughts/floods, it can be found that the three largest peasant uprisings breaking out in the NCP during the Qing Dynasty could all be related to severe droughts (Fig. 3 a yellow shaded), in which, the Tian-Li Religion uprising (1813) and Qiu-Shen congregation uprising (1860–1863) both broke out in the last year of droughts, and the Yihetuan Movement (1899–1900) climaxed in the second year of drought. Besides, during the most severe drought (1875–1877) of the 19th century, revolts frequency, which was mostly banditry incidents, also reached peak in 1877.
Compared with temperature, precipitation had more direct impacts on revolts, which was significant in shorter time scale. In annual scale, revolts frequency was significantly correlated with droughts, and in contrast, the correlation between revolts and floods was weak, which meant droughts posed a more serious threat to social order. It is probably because that the NCP floods are short-term events (1–2 months) and droughts can have an interannual scale. There was a cumulative of process negative impacts caused by climate change before the burst of revolts. For large scale peasant uprisings, the process usually took more time than sporadic mass demonstrations and banditry incidents, which could be proved with the time lag (1–3 years) between the three largest peasant uprisings and corresponding severe droughts.
4.3. Man-land conflict and climate impacts
According to the results of proxy series, the clarity of correspondence between revolts and climate (temperature/precipitation) varied in different periods. Except for centurial scale, the correspondence emerged in neither decadal nor yearly scale until the turn of the 18th and the 19th century. This characteristic should be analysed with the gradual process of man-land conflict in the NCP during the Qing Dynasty.
Based on the variation of per capita cropland area in Zhili province (main part of NCP) and harvest type in North China during 1736–1911 (Fig. 4 ), the evolution of man-land relationship in NCP could be divided into several stages.
By 1644, the population in NCP had largely decreased in the great famine and upheavals in the late Ming Dynasty, which contributed to the alleviation of social conflicts.
Although climatic conditions in the late 17th century were detrimental to agricultural production (low temperature, frequent severe droughts and floods), liberal policy of agriculture (cutting tax, encouraging reclamation) effectively ensured the rapid expansion of cropland from the 1640s to the 1720s. In this period, per capita cropland area had been stable at a high level (about 5.6 mu③ ), which brought a benign man-land relationship and social stability.
After the 1730s, with the stagnation of cropland expansion and continuous increase of population, the cropland area per capita gradually decreased. By the 1780s, it had been less than 4 mu per capita. However, relatively suitable climatic condition (warm and less droughts/floods) contributed to the agricultural prosperity in the 18th century. Per unit area yield in this period was generally acknowledged as at the highest in Qing Dynasty [ Zhao et al., 1995 and Guo, 1995 ], and in most years abundant harvest could be achieved (Fig. 4 d). The estimate of yield per mu by then has not been precisely determined by researchers yet [ Shi and Ma, 2010 ]. Based on the lower limit (93 kg per mu) [ Xue, 2008 ], per capita raw cereal in Zhili province was more than 350 kg per year until the 1780s, while at the higher limit (140 kg per mu) [ Wu , 1997 ], it was about 550 kg per year. After food processing, per capita food (milled cereal) was about 230–370 kg per year④ , which was above the subsistence level (200 kg food per capita per year). Local society still had some resilience to external pressure (e.g., natural disasters).
The turn of the 18th and the 19th century was also the turning point of man-land relationships in the NCP. In several decades, per capita cropland area decreased from about 4 mu to less than 3 mu, and per capita food (milled cereal) fell to a vulnerable level of 186–280 kg per year, which just met the need of bare subsistence based on the higher limit of per unit area yield. Even worse, the years of poor harvest in NCP sharply increased from the 1810s, and finally took an overwhelming majority in the late 19th century. The remarkable decrease of per unit area yield in the 19th century was the results of a series of social and natural factors. Besides social upheaval, poor maintenance of irrigation, ecological damage, cold climate and frequent extreme droughts/floods were also important factors for the decline of agriculture. In the 19th century, with 2.5 mu per capita and 90% per unit area yield of the 18th century, the per capita food was estimated to be about 140–210 kg per year, which was even not enough for the minimum living standard.
Against the background of intense man-land conflict, social upheaval would easily be triggered by external pressure such as climate, which has been demonstrated by the correspondence between revolts and climate change in decadal/yearly scale in the 19th century.
5. Conclusions
In this paper, based on reconstructed proxy historical series, the relationship between revolts frequency and climate change in NCP in the Qing Dynasty is analyzed, and the conclusions are as follows.
(1) Revolts broke out more frequently in the colder 19th century and less frequently in the warmer 18th century. In the 19th century, almost all the decades when frequency sharply increased, e.g. 1810s, 1830s, 1850s–1860s, 1890s–1900s, corresponded with cold stage.
(2) Revolts are more likely triggered by droughts than floods. The drought index was significantly correlated with revolts frequency, and the positive correlation turned even more obvious after 1780. The three largest peasant uprisings in the late Qing Dynasty were all ignited by severe droughts.
(3) The correspondence emerged at neither decadal nor yearly scale until the turn between 18th and 19th centuries, the critical period when per capita cropland area decreased to a vulnerable level. Food crisis increased the vulnerability of local society, and temperature and precipitation change became an important trigger for revolts.
In this paper, it is examined to what extent climate extremes impact regional social evolution with reconstructed proxy historical series. Social factors such as population pressure, social conflicts, policy revision, etc., should be comprehensively considered in the summary of the mechanism how climate impacts the society and how human beings adapt to it.
Acknowledgements
This study was financially supported by a grant from the National Basic Research Program of China (No. 2010CB950103) and grants from the National Science Foundation of China (No. 41071127, No. 40901099).
References
- Cao, 2001 S. Cao; Chinese Population History (Vol. 5: Qing Dynasty) (in Chinese)Fudan University Press (2001), p. 971
- Chen, 1989 Y. Chen; A study of hazard indexes of drought and flood; Journal of Catastrophology (in Chinese), 4 (12) (1989), pp. 10–13
- CMA, 1981 CMA (China Meteorological Administration; Yearly Charts of Dryness/Wetness in China for the Last 500-year Period (in Chinese) ; Sino Maps Press (1981), p. 333
- Fang et al., 2004 X. Fang, Q. Ge, J. Zheng; Progress and prospect of researches on impacts of environmental changes on Chinese civilization; Journal of Palaeogeography (in Chinese), 6 (1) (2004), pp. 85–94
- Ge and Wang, 1995 Q. Ge, W. Wang; Population pressure, climate change and the Taiping rebellion; Geographical Research (in Chinese), 14 (4) (1995), pp. 32–41
- Gu, 1991 T. Gu; Climate in North China Plain (in Chinese)China Meteorological Press (1991), p. 333
- Guo, 1995 S. Guo; Food production in dry farming area in North China in the Qing Dynasty; Researches in Chinese Economic History (in Chinese) (1) (1995), pp. 22–44
- Hsiang et al., 2011 S. Hsiang, K. Meng, M. Cane; Civil conflicts are associated with the global climate; Nature, 476 (2011), pp. 438–441
- Le et al., 1985–1987 D. Le, Z. Ming, X. Wang, et al.; Actual Annals of Qing Dynasty (Vol. 1–60) (in Chinese)Zhonghua Book Company (1985–1987)
- Li, 1986 W. Li; Brief Records on Boxer Movement (in Chinese)Qilu Press (1986), p. 508
- Li, 1992 K. Li; Chinese Climate Change and Its Impacts (in Chinese), Ocean Press (1992), p. 450
- Liang, 2008 F. Liang; Statistics of Population, Land and Tax in Chinese History (in Chinese), Zhonghua Book Company (2008), p. 761
- Niu, 1990 P. Niu; Form of Administrative History in Qing Dynasty (in Chinese), Sino Maps Press (1990), p. 593
- PAGES, 2009 PAGES; Past global changes (PAGES) science plan and implementation strategy (IGBP Report No. 57) (2009) Accessed http://www.pages-igbp.org.
- Shi and Ma, 2010 T. Shi, G. Ma; A survey of research on grain output per mu in the early and mid Qing Dynasty; Historical Research (in Chinese) (2) (2010), pp. 143–155
- Wang, 1996 H. Wang; The relationship between the migrating south of the nomadic nationalities in north China and the climatic changes; Scientia Geographica Sinica (in Chinese), 16 (3) (1996), pp. 274–279
- Wang, 1991 S. Wang; Reconstruction of temperature series of North China from 1380s to 1980s; Science in China Series, 34 (1991), pp. 751–759
- Wang et al., 1993 S. Wang, G. Wang, Z. Zhao, et al.; Variation of droughts/floods in Yangtze and Yellow River Basin during 1380–1989; S. Wang (Ed.), et al. , The Rule of Droughts/Floods Occurrence in Yangtze and Yellow River Basin and Diagnosis of Their Economic Impacts (in Chinese), China Meteorological Press (1993), pp. 41–54
- Wang et al., 2005 Z. Wang, H. Li, X. Kong, et al.; Impacts of climatic warming on agricultural production in Chinese history; Progress in Natural Science (in Chinese), 15 (6) (2005), pp. 706–713
- Wu, 1997 H. Wu; Estimate of per unit area yield in Beijing and Hebei during early Qing Dynasty; Beijing Social Science (in Chinese) (4) (1997), pp. 32–39
- Xue, 2008 G. Xue; Study on livelihood of people in Zhili based on the population, land and grain in Qing Dynasty: Example for central region of Zhili; Agricultural History of China (in Chinese) (1) (2008), pp. 60–68
- Ye et al., 2004 Y. Ye, Y. Ye, X. Fang, Q. Ge, et al.; Response and adaptation to climate change indicated by the relationship between revolt and drought-flood in Shandong province during middle and late Qing Dynasty; Scientia Geographica Sinica (in Chinese), 24 (6) (2004), pp. 680–686
- Zhang et al., 2005 D. Zhang, C. Jim, C. Lin, et al.; Climate change, social unrest and dynastic transition in ancient China; Chinese Science Bulletin, 50 (2) (2005), pp. 137–144
- Zhang, 1982 J. Zhang; Possible impacts of climatic variation on agriculture in China; Geographical Research (in Chinese), 1 (2) (1982), pp. 8–15
- Zhang, 1996 P. Zhang; Historical Climate Change in China (in Chinese) ; Shandong Science & Technology Press (1996), p. 533
- Zhao et al., 1995 G. Zhao, Y. Liu, H. Wu, et al.; Study on Food Yield Per Mu in the Qing Dynasty (in Chinese)China Agriculture Press (1995), p. 153
Notes
. Data of digital map are from Yugong site, http://yugong.fudan.edu.cn/Ichg/Chgis-index.asp
. Harvest type is based on fuzzy clustering analysis of frequency of yearly agricultural harvest. It is divided into 5 types. For example, the harvest type in 1770 was 5 (or 1) means years of bumper crop (or crop failure) took an overwhelming majority in the 5 years of 1768–1772, 4 (or 2) means a simple majority, and 3 means equality
③. 1 mu ≈ 0.067 hm2
④. Processing rate of raw cereal was 1/3 [ Shi and Ma, 2010 ]
Document information
Published on 15/05/17
Submitted on 15/05/17
Licence: Other
Share this document
Keywords
claim authorship
Are you one of the authors of this document?


