Abstract
An objective identification technique is used to detect regional extreme low temperature events (RELTE) in China during 1960–2009. Their spatial-temporal characteristics are analyzed. The results indicate that the lowest temperatures of RELTE, together with the frequency distribution of the geometric latitude center, exhibit a double-peak feature. The RELTE frequently happen near the geometric area of 30°N and 42°N before the mid-1980s, but shifted afterwards to 30°N. During 1960–2009, the frequency, intensity, and the maximum impacted area of RELTE show overall decreasing trends. Due to the contribution of RELTE, with long duration and large spatial range, which account for 10% of the total RELTE, there is a significant turning point in the late 1980s. A change to a much more steady state after the late 1990s is identified. In addition, the integrated indices of RELTE are classified and analyzed.
Keywords
regional extreme low temperature events ; spatial-temporal features ; turning point ; frequency distribution
1. Introduction
Regional extreme low temperature events (RELTE) have common features of wide spatial range, long duration, high intensity, and huge damage potential [ Ding et al., 2008 ]. Recently, many researches are being carried out on detecting and analyzing the RELTE in China. Zhang and Qian [2011] reported a new identification technique for RELTE and built up a database, and preliminarily analyzed the spatial-temporal feature of low temperature events. Using the spatial point process theory, Yang et al. [2010a] analyzed the spatial group characteristics of extreme low temperature events. Based on the method of objective weather chart analysis, Ren et al. [ Ren et al ., 2001 ; Ren et al ., 2012 ] created a new objective identification technique for persistent regional extreme events, which can effectively identify the properties of their spatial range and duration. Gong et al. [2012] improved the method into a technique called objective identification technique for RELTE (OITRELTE) and built up the corresponding RELTE database. Likewise, Peng and Bueh [2011] classified the regional low temperature events and worked out the mechanism from two aspects (case analysis and classification diagnosis). Meanwhile, other research is also carried out on the cases of regional low temperature events. For instance, Zhou et al. [2009] investigated the characteristics and the corresponding climate background of persistent low temperature and icy weather over southern China in January 2008. Shulski et al. [2009] investigated the spatial-temporal feature of the regional low temperature event that happened in Alaska in winter 2007 and lasted for 37 days. The analysis was carried out with the consideration of atmospheric circulation and sea surface temperature anomalies. However, other countries are still using the traditional temperature anormaly to identify RELTE. Few objective identification techniques have been reported.
It is noteworthy that in the context of global warming, the temperatures in Asia and most regions of China are increasing [ Tang et al ., 2009 ; Zhao et al ., 2005 . The number of low temperature days in most parts of northern China is decreasing [ Zhai et al., 1999 ]. In recent years, RELTE occurred frequently in the Northern Hemisphere with properties of wide range and long duration. Since 2005, RELTE occurred frequently in China, for instance, the low temperature and icy weather in South China during the 2007/2008 winter, the regional low temperature events in the northeast during the summer of 2009, and the nationwide low temperature events during the 2010/2011 winter. However, the number of cold days and cold nights in China is decreasing in recent years [ Zhai and Pan, 2003 ; Qian and Lin, 2004 ]. So under the background of global warming, research on the causes of frequent RELTE is needed. The causes might be partly human factors or natural factors. It is necessary to identify the potential relationship between the spatial features of RELTE and regional climate warming in China at different time scales. However, the latest research on RELTE is mainly focusing on detecting and analyzing single cases. Little attention is paid to the types, properties, and spatial-temporal features of the regional extreme events [ Yang et al ., 2010b ; Wan et al ., 2010 ; Feng et al ., 2006 ; Zhang et al ., 2009 ].
Based on the detecting results of RELTE in 1960–2009 using the OITRELTE, this paper analyzes the spatial distribution and decadal features of frequencies and cumulative intensity of RELTE. The possible relationship between the spatial features and multiple time-scale variations in China’s RELTE are also discussed.
2. Data
The daily minimum temperature of 731 stations is provided by the National Meteorological Information Center of China Meteorological Administration. The time series are available from November 1960 to March 2011. Due to the considerable influence of missing data on the detection results, data of 35 stations is excluded. Data of 696 stations in China are finally used for the analysis.
3. Methodology and techniques
3.1. OITRELTE
The key components of OITRELTE are as follows: 1) determining the threshold of the extreme low temperature; 2) identifying the spatial belts of daily extreme low temperature; 3) estimating the continuous process of spatial change; 4) defining the index system.
In this study, the 5th percentile of the daily minimum temperature from November to March of 1971–2000 is selected to determine the low temperature thresholds [ Bonsal et al. , 2001 ]. The weather chart analysis method is improved to identify the spatial domain of the daily extreme low temperature belts and the overlap of possible events and low temperature belts. Integrating the information of the possible events and low temperature belts of each day, the persistent extreme low temperature events are identified (Fig. 1 ).
|
|
|
Figure 1. Information combination of temporary possible events and low temperature belts (circle denotes temporary possible events, which mean RELTE continuing; diamond denotes low temperature belts, which mean stations in a near region reaching the threshold but do not belong to any temporary possible event; shadow denotes overlapped region between temporary possible events and low temperature belts) |
RELTE has both spatial and temporal features. In this paper, two grades of indices are applied — the first-grade process index and the second-grade daily index. The second-grade daily index mainly describes the daily evolution of RELTE, including daily extreme value (Qd ), which means the lowest temperature of the RELTE; daily accumulated intensity (Ld ), which means the accumulated effect of RELTE; daily impacted area (Ad ), which means daily affected area of the RELTE; the daily integrated index (Zd ), which denotes the integrated effect for the other three indices. Besides, we also define the geometric center of the daily impacted area, in order to estimate the probable spatial location of the RELTE. The calculation equations for these indices is as following:
|
|
( 1) |
|
|
( 2) |
|
|
( 3) |
|
|
( 4) |
where j is the number of stations whose daily low temperature reaches the threshold, T0j is the threshold of each station, and m is the daily number of stations with regional extreme events. Before calculating the daily impacted area using Eq. (3) , stations should be gridded to a resolution of 0.5°×0.5°. Here, aj is the area of each grid field, mp is the number of grid fields in the range of the daily maximum impacted area. In Eq. (4) , e1 ,e2 ,e3 are the weighted coefficients.
The first-grade process indices are for the whole RELTE process, including the process extreme value (Q ), the accumulated process intensity (L ), the accumulated process impacted area (A ), the maximum process impacted area (Amax ), the duration (N ), the integrated index (Z ), and the geometric center of the maximum process impacted area:
|
|
( 5) |
|
|
( 6) |
|
|
( 7) |
|
|
( 8) |
|
|
( 9) |
where d is a day of the event, and N is the event’s duration. In Eq. (9) , e1 ,e2 ,e3 ,e4 are the weighted coefficients. For the calculation of the integrated index, the daily indices are firstly standardized, then weighted and summed up.
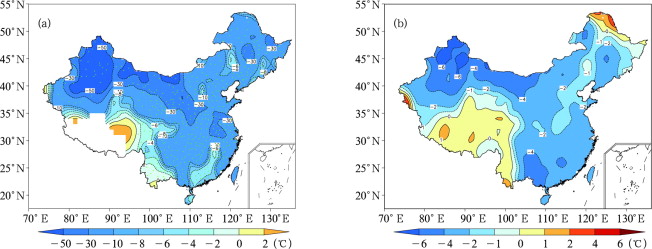
Figure 2 a shows the detected RELTE which began on December 30, 2010, ended on February 2, 2011. The event lasted 35 days. The maximum impacted area covered 7.2528×10⁶ km2 with an extreme low temperature of −49.6°C. As shown in Figure 2 b, it is obvious that the temperature anomalies are consistent with the spatial distribution of the detected RELTE. Thus, the regional distribution of this event is consistent with the actual situation, which further supports that OITRELTE can effectively identify RELTE.
|
|
|
Figure 2. (a) RELTE and (b) temperature anomalies from 30 December 2010 to 2 February 2011 (blue points denote stations of RELTE, and the shadings denote the accumulative difference between the observation and the thresholds) |
3.2. Contribution of different thresholds
In order to further analyze the impact factors on linear trends and on phase transitions in the indices of RELTE, each index is divided into 10 classes of 10% intervals, (0–10%], …, (90%–100%]. Afterwards, we calculate the trend of each index at each percentage interval to estimate the contribution of different thresholds. The calculation can be described as: 1) calculating the linear trend of each index before ranking, which is marked as λ; 2) calculating the linear trend of each index at different intervals after ranking, which are recorded as λ1 , λ2 , λ3 , …, λ10 ; 3) calculating the contribution of each interval, for instance, the contribution of Q in the range of 0–10% can be described as × 100%.
3.3. Integrated index classification
Considering that the persistent regional extreme events might influence the society and economy on three levels (national level, regional level, and provincial level), the integrated index is classified into three grades:
|
|
( 10) |
In Eq. (10) , the most probable value Zp is calculated as the most common index for RELTE. σp is the most probable error of the integrated index, the calculation method is similar to the average value of the standard deviation. ± 0.3σp of the most probable value is set as the threshold for the level classification.
4. Characteristics of winter RELTE during 1960–2009
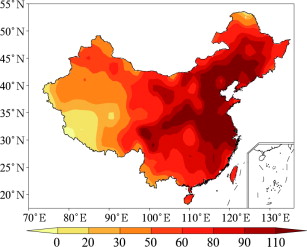
During the period of 1960–2009, 996 RELTE are detected using OITRELTE, and the indices are also calculated. Generally, the duration, accumulated process intensity, maximum process impacted area, and accumulated process impacted area in the 1960s and 1970s are stronger than those after the 1980s, especially for the high frequency of events with long duration and large spatial range. Since the beginning of the 21st century, the frequency and strength of the winter RELTE are becoming higher and stronger. Regions with high frequency of RELTE are mainly located in the east part of China, the eastern Tibetan Plateau, and northern Southwest China (Fig. 3 ). China is influenced by cold wave mainly from three directions (northwest, middle, and east) in winter, which are overlapped in the regions of northern China, between the Yellow River and the Yangtze River, and north part of South China. Thus, RELTE happen frequently in the belt from Northeast China to the north part of South China. In addition, a cold vortex is easily formed in the eastern Tibetan Plateau and northern Southwest China in winter, which leads to RELTE with properties of relatively small impacted area and short duration.
|
|
|
Figure 3. Frequency distribution of RELTE |
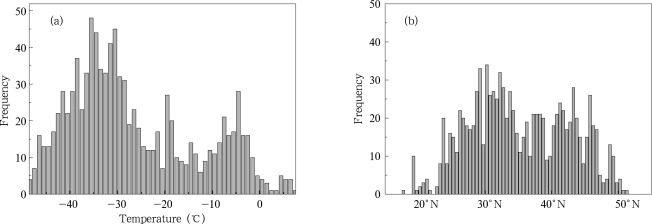
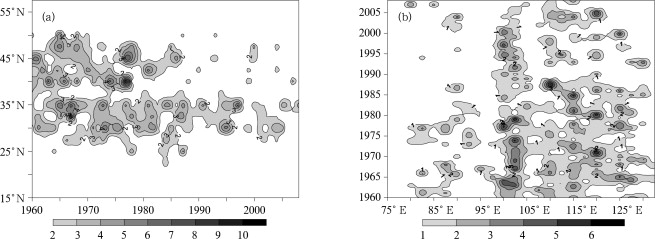
As shown in Figure 4 , since 1960 the frequency distribution of extreme low temperature and latitudes of the geometric center for all RELTE exhibited a double peak feature, which is consistent with China’s characteristics of large latitude span and topographical differences. It also indicates that RELTE happens in two intensive latitude zones, which exist near the latitudes of 30°N and 42°N (Fig. 4 b). The profiles of time-latitude and time-longitude cross sections of the geometrical centers of RELTE in 1960–2009 are shown in Figure 5 . Before the mid-1980s, most of the events happened near 30°N and 42°N. Later, the events mainly happened near 30°N. For the longitude, most of the events happened near 100°E and 120°E before the mid-1980s, and later moved to 100°E.
|
|
|
Figure 4. (a) Frequency distribution of the extreme low temperature, and (b) latitudinal distribution of the geometrical centers of RELTE during 1960–2009 |
|
|
|
Figure 5. (a) Time-latitude and (b) time-longitude cross sections of the geometrical centers of RELTE during 1960–2009 |
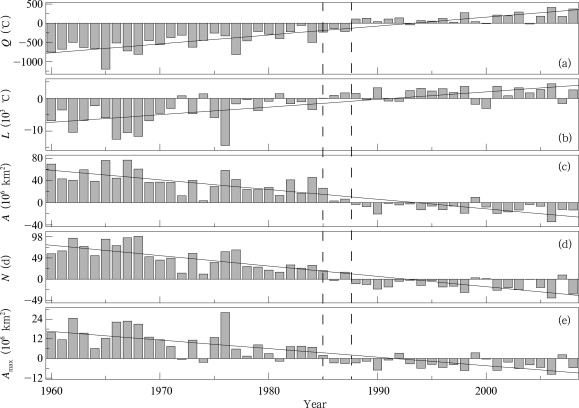
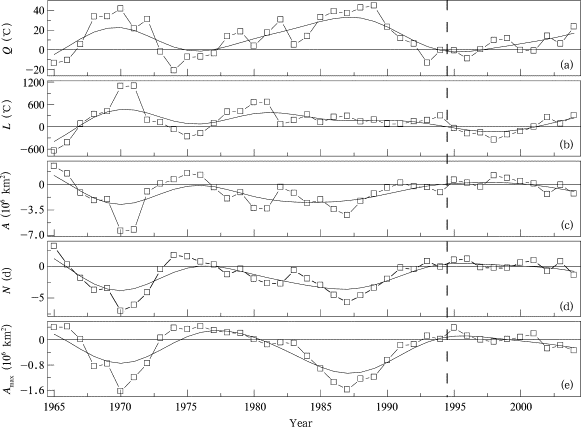
As shown in Figure 6 , annual variation in each index of RELTE during 1960–2009 had two major characteristics: 1) Linear trends in process extreme intensity and accumulated process intensity are both positive, which suggests that the extreme low temperatures are increasing. The trends in the maximum process impacted area, accumulated process impacted area, and duration are all negative, which indicates that RELTE are becoming weak during 1960–2009 under the situation of global warming. 2) The trends in the indices have significant turning points in 1985–1988. Before 1985, the anomalies of process extreme intensity and accumulated process intensity are mainly negative, but those of the maximum process impacted area, accumulated process impacted area, and duration are mainly positive. After 1988, all of them show opposite signs. In order to further study the fluctuation in various indicators at decadal-scale, the window length is set to 10 years. Trends in the various indices are calculated within the window length in order to characterize the variation in a 10-year period. The 10-year running trends for different RELTE indices are shown in Figure 7 . As it can be seen, the fluctuations in linear trends are significant before the 1990s, but afterwards become gradually stable, especially after 1995.
|
|
|
Figure 6. Yearly variations in main indices of RELTE for 1960–2009 (a) Q , (b) L , (c) A , (d) N , and (e) Amax |
|
|
|
Figure 7. Yearly variation of the 10-year moving linear fitting coefficient of different RELTE indices during 1960–2009, (a) Q , (b) L , (c) A , (d) N , (e) Amax (the moving step is 1-year, and the abscissa is the center year of each moving window) |
In addition, the contribution of different percentile intervals to the original linear trend is calculated according to the method described in section 3.2 (Table 1 ). The relative contribution of (0–10%] for the accumulated process intensity, and of (90%–100%] for the accumulated process impacted area, and maximum process impacted area are all more than 60%. These results suggest that the high percentile events mainly contribute to the trend and phase transition of RELTE.
| Percentile | Q | L | A | N | Amax |
|---|---|---|---|---|---|
| (0–10] | 22 | 88 | 0 | 15 | 1 |
| (10–20] | 24 | 7 | 1 | 15 | 2 |
| (20–30] | 13 | 2 | 0 | 15 | 2 |
| (30–40] | 14 | 1 | 1 | 15 | 3 |
| (40–50] | 9 | 1 | 0 | 15 | 3 |
| (50–60] | 13 | 0 | 2 | 22 | 2 |
| (60–70] | 6 | 1 | 1 | 7 | 7 |
| (70–80] | 4 | 0 | 3 | 18 | 8 |
| (80–90] | 0 | 0 | 6 | 28 | 7 |
| (90–100] | 0 | 0 | 86 | 6 | 66 |
5. Comprehensive variations in RELTE
Extreme intensity, duration, and impacted spatial extent have different effects. These indices can describe some aspects of RELTE, but they cannot explain the events completely. Gong et al. [2012] integrated a variety of indicators into an integrated index, which is used to express the comprehensive characteristics of RELTE. This method mainly analyzes the correlation coefficients between the indices and economic losses, and affected people by frost disaster. The relative percentage is used as the weight coefficient of various indices.
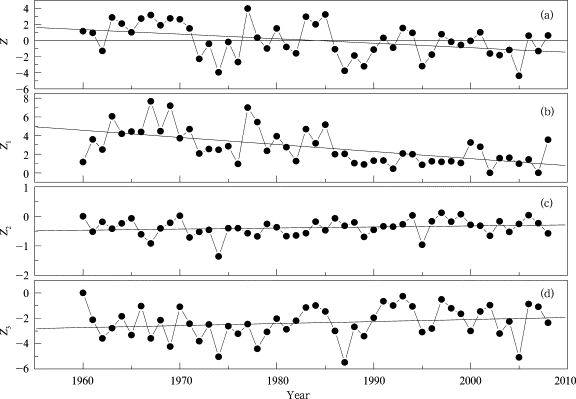
Applying the integrated index classification method introduced in section 3.3 , the ratios of the three grades are 27%, 43%, and 30%, respectively. It is consistent with the shape of the Gauss distribution for an integrated index. As shown in Table 2 and Figure 8 a, the integrated indices have three features: 1) They show a decreasing trend, which means that the frequency of RELTE is decreasing. After 2000, the integrated indices are low. 2) There is a significant phase transition around 1988, which is consistent with the transition of various single indices. 3) It shows a notable characteristic of inter-decadal fluctuation. As shown in Figure 8 b, the first grade RELTE are decreasing after 1988; further indices are overall small with little fluctuation after 2000. Z1 and Z have similar properties, but are different from Z2 and Z3 (Fig. 8 b&8c). Therefore, the first grade TELTE contribute to the annual change of the integrated index significantly.
| Grade | Definition | Range of Z | Ratio | Average Z | Average Q (°C) | Average L (°C) | Average A (106 km2 ) | Average N (d) | Average Amax (106 km2 ) |
|---|---|---|---|---|---|---|---|---|---|
| 1 | [Zp + 0.3σ p ,+∞) | [0.09, ∞) | 27% | 0.50 | −39.50 | −798.9 | 5.6481 | 6.2 | 1.5825 |
| 2 | (Zp −0.3σp , Zp + 0.3σp ) | (−0.19, 0.09) | 43% | −0.04 | −30.54 | −31.9 | 0.3554 | 1.4 | 0.2792 |
| 3 | (-∞, Zp −0.3σp ] | (∞, −0.19] | 30% | −0.39 | −9.45 | −17.6 | 0.2728 | 1.2 | 0.2292 |
|
|
|
Figure 8. Yearly variation of the integrated index during 1960–2009, (a) the integrated index Z , (b), (c), and (d) denotes the 1st, 2nd, and 3rd grade integrated index (Z1 — Z3 ), respectively, the solid line is the linear trend |
6. Conclusions and discussion
In this study, OITRELTE is applied to detect RELTE in the period of 1960–2009. The comprehensive characteristics of the spatial distribution and temporal pattern of RELTE are analyzed. The conclusions can be summarized as follows:
(1) The lowest temperatures of RELTE together with the frequency of the geometric latitude center exhibit a double-peak feature. The RELTE happened frequently near the geometric area of 30°N and 42°N before the mid-1980s, but afterwards the RELTE mainly shifted to 30°N.
(2) During 1960–2009, the frequency, intensity, and the maximum impacted area of RELTE show overall decreasing trends. Due to the contribution of RELTE with long duration and large spatial range, which account for 10% of the total RELTE, there is a significant turning point in the late 1980s. The reason for this abrupt change might be that the minimum and maximum temperatures both increase obviously in winter after 1985 [ Zhou et al., 2000 ]. Besides, there is also a steady state in the indices of RELTE since the late 1990s, which suggests that the frequency of RELTE became stable. The reason for this change might be that the warming rate is decreasing due to the interaction of global warming and natural variability [ Qian et al., 2010 ; He et al., 2006 ; Wang et al., 2009 ].
(3) The integrated indices show notable characteristics of inter-decadal fluctuation, which shows a decreasing trend in the frequency of RELTE. The first grade events significantly contribute to the annual change of the integrated index of RELTE.
Acknowledgements
This research is supported by the Special Scientific Research Projects for Public Interest (No. GYHY201006021 and GYHY201106016), and the National Natural Science Foundation of China (No. 41205040 and 40930952).
References
- Bonsal et al., 2001 B.R. Bonsal, X.-B. Zhang, L.A. Vincent; Characteristics of daily and extreme temperature over Canada; J. Climate, 5 (14) (2001), pp. 1959–1976
- Ding et al., 2008 Y.-H. Ding, Z.-Y. Wang, Y.-F. Song, et al.; Causes of the unprecedented freezing disaster in January 2008 and its possible association with the global warming; Acta Meteorologica Sinica (in Chinese), 66 (5) (2008), pp. 808–825
- Feng et al., 2006 G.-L. Feng, W.-J,. Dong, Z.-Q. Gong, et al.; Nonlinear Spatiotemporal Distribution Theories and Methods for Observational Data (in Chinese), China Meteorological Press (2006), p. 227
- Gong et al., 2012 Z.-Q. Gong, F.-M. Ren, G.-L. Feng, et al.; Research on the identification of regional low temperature extreme events and its spatial/temporal change characteristics; Journal of Applied Meterological Science (in Chinese), 23 (2) (2012), pp. 195–204
- He et al., 2006 W.-P. He, G.-L. Feng, W.-J. Dong, et al.; On the predictability of the Lorenz system; Acta Physica Sinica (in Chinese), 55 (2) (2006), pp. 969–977
- Peng and Bueh, 2011 J.-B. Peng, C. Bueh; The definition and classification of extensive and persistent extreme cold events in China; Atmospheric and Oceanic Science Letters, 4 (5) (2011), pp. 281–286
- Qian and Lin, 2004 W.-H. Qian, X. Lin; Regional trends in recent temperature indices in China; Climate Research, 27 (2004), pp. 119–134
- Qian et al., 2010 Z.-H. Qian, Z.-Q. Gong, G.-L. Feng; Distribution of most probable temperature of daily average temperature records in China and the slowing down of warming trend; Acta Physica Sinica (in Chinese), 59 (10) (2010), pp. 7490–7499
- Ren et al., 2001 F.-M. Ren, B. Gleason, D. Easterling; A numerical technique for partitioning cyclone tropical precipitation; Journal of Tropical Meteorology (in Chinese), 17 (3) (2001), pp. 308–313
- Ren et al., 2012 F.-M. Ren, D.-L. Cui, Z.-Q. Gong, et al.; An objective identification technique for regional extreme events; J. Climate, 25 (2012), pp. 7015–7027
- Shulski et al., 2009 M. Shulski, J. Walsh, E. Stevens, et al.; Diagnosis extended cold-season temperature anomalies in Alaska; Mon. Wea. Rev., 453 (2009) http://dx.doi.org/10.1175/2009MWR3039.1
- Tang et al., 2009 G.-L. Tang, Y.-H. Ding, S.-W. Wang, et al.; Comparative analysis of the time series of surface air temperature over China for the last 100 years; Advances in Climate Change Research (in Chinese), 5 (2) (2009), pp. 71–78
- Wan et al., 2010 S.-Q. Wan, C.-H. Gu, J.-P. Kang, et al.; Monthly extreme high-temperature response to atmospheric oscillation in China; Acta Physica Sinica (in Chinese), 59 (1) (2010), pp. 676–682
- Wang et al., 2009 X.-J. Wang, Z.-Q. Gong, L. Zhou, et al.; Analysis of the stability of temperature networks part I: The influence of extreme events; Acta Physica Sinica (in Chinese), 58 (9) (2009), pp. 6651–6658
- Yang et al., 2010a P. Yang, G.-L. Feng, W.-D. Liu, et al.; Cluster extreme events based on point process theory; Journal of Applied Meterological Science (in Chinese), 21 (3) (2010), pp. 352–359
- Yang et al., 2010b P. Yang, W.-D. Liu, Q.-G. Wang, et al.; The climatic change trend and seasonal characteristics of daily temperature extremes in China for the latest 40 years; Journal of Applied Meterological Science (in Chinese), 21 (1) (2010), pp. 29–36
- Zhai and Pan, 2003 P.-M. Zhai, X.-H. Pan; Trends in temperature extremes during 1951–1999 in China; Geophys. Res. Lett., 30 (2003) http://dx.doi.org/10.1029/2003GL018004
- Zhai et al., 1999 P.-M. Zhai, A.-J. Sun, F.-M. Ren, et al.; Changes of climate extremes in China; Climatic Change, 42 (1999), pp. 203–218
- Zhang et al., 2009 D.-Q. Zhang, J. Yang, Q.-G. Wang, et al.; Analysis of climate record breaking temperature events in China during the past 50 years; Acta Physica Sinica (in Chinese), 58 (6) (2009), pp. 4354–4361
- Zhang and Qian, 2011 Z.-J. Zhang, W.-H. Qian; Databases on regional extreme low temperature events in China; Advances in Atmospheric Science, 28 (2) (2011), pp. 338–351
- Zhao et al., 2005 Z.-C. Zhao, S.-W. Wang, Y. Xu, et al.; Attribution of the 20th century climate warming in China; Climatic and Environmental Research (in Chinese), 10 (4) (2005), pp. 809–817
- Zhou et al., 2009 W. Zhou, J.C.L. Chan, W. Chen, et al.; Synoptic-scale controls of persistent low temperature and icy weather over southern China in January 2008; Mon. Wea. Rev., 137 (2009) http://dx.doi.org/10.1175/2009MWR2952.1
- Zhou and Wang, 2000 Z.-J. Zhou, Y. Wang; Studies on winter temperature variation in China in 1951–1997; Journal of Nanjing Institute of Meteorology (in Chinese), 23 (1) (2000), pp. 106–112
Document information
Published on 15/05/17
Submitted on 15/05/17
Licence: Other
Share this document
Keywords
claim authorship
Are you one of the authors of this document?

