Abstract
A socio-economic data set on Chinas historical flood losses for the period 1984–2012 was compiled to analyze the exposed population, economy, and crop area as well as the vulnerabilities of the population and economy to floods. The results revealed that the exposed population was approximately 126 persons km−2 per year when taking China as a whole; in terms of the economy, potential losses due to floods were estimated to be approximately 1.49 million CN¥ km−2 and the crop area exposed to floods covered 153 million hm2 per year. Chinas total exposure to floods significantly increased over the analysis period. The areas that showed the higher exposure were mainly located along the east coast. The populations vulnerability to floods showed a significantly increasing trend, however, the economic vulnerability showed a decreasing trend. The populations and economies that were most vulnerable to floods were in Hunan, Anhui, Chongqing, Jiangxi, and Hubei provinces. The municipalities of Shanghai, Beijing, and Tianjin showed the lowest vulnerabilities to floods.
Keywords
Exposure ; Vulnerability ; Flood disaster ; Spatio-temporal changes ; China
1. Introduction
China has suffered heavily from flood disasters that covered a large territory and caused tremendous economic losses. Approximately 10% of Chinas land area and 70% of the gross output value of both industry and agriculture are threatened by floods (Lu and Cheng, 2010 ). During the 1950s, on average, the farmland area that was annually affected by floods was 10.07 million hm2 and the area stricken by disaster covered 6.52 million hm2 . By the 1990s, the annual farmland area affected by floods had expanded to 15.81 million hm2 and the disaster-stricken areas covered 9.01 million hm2 (Chen et al., 2011 ). Since the turn of the 21st century, the annual affected area of farmland has significantly decreased to approximately 10.73 million hm2 (Zhang et al., 2011 ). Due to effective flood disaster prevention programs, the number of casualties has also significantly decreased from an average annual toll of approximately 5200 deaths during the period 1960–2000 to approximately 2000 during the first 10 years of the 21st century. However, due to rapid population growth and socio-economic development, the flood exposure of economic resources, basic infrastructure, and material wealth has increased. Higher exposure to floods implies that higher economic losses are very likely. According to the statistics on flood disasters in China, the annual direct economic loss to floods amounted to 89.6 billion CN¥ during the period 1984–1999; the annual losses increased to 105 billion CN¥ during the period 2000–2012 (CMA, 2013 ).
A changing climate leads to changes in the frequency, intensity, spatial extent and duration of extreme weather and climatic events. Many extreme natural events such as intensive rains, heat waves, and droughts have increased in frequency or magnitude due to global warming (Zheng et al., 2012 ). Projected precipitation extremes in China show an increase for the period 2011–2050 (Cao et al., 2013 ). Managing the negative impacts of extreme climatic events becomes increasingly important to disaster prevention, mitigation, and risk management. The Special Report on Managing the Risks of Extreme Events and Disasters to Advance Climate Change Adaptation (SREX) released by the Intergovernmental Panel on Climate Change (IPCC) notes that the impacts of extreme events and their potential for disasters depend not only on the climate extremes themselves but also on the extent of the exposure and vulnerability of both human and natural systems. Increasing exposure of people and economic assets has been the major cause of long-term increases in economic losses from climate-related disasters. If the exposure to extremes is the same, the severity and impacts of climate extremes depend strongly on vulnerability (IPCC SREX, 2012 ; IPCC, 2014 ).
Exposure and vulnerability are dynamic; they vary across temporal and spatial scales and depend on economic, social, geographic, demographic, cultural, institutional, governance, and environmental factors (Zheng et al., 2012 ; IPCC SREX, 2012 ; IPCC, 2014 ). Factors that influence exposure and vulnerability to climate extremes include settlement patterns, urbanization, and changes in socio-economic conditions. Currently, it is difficult to obtain data on economic losses; therefore, the social economic index is generally used to assess vulnerability to disaster (Ge and Yue, 2013 ). Original statistics of historical losses and vulnerability curves set up by loss scenarios are rarely used (Shi et al., 2009 ; Gu et al., 2012 ; Dong et al., 2012 ). Very few studies touch on the temporal and spatial variations of flood exposure and vulnerability (Balica et al., 2012 ; Huang et al., 2013 ).
Herein, long-term series of historical flood disasters in China are collated for the period of 1984–2012. Together with the social and economic data of historical disasters, the temporal and spatial changes of flood exposure and vulnerability are quantified and assessed using statistical methods. This study aims to recommend adaptations to climate change and to improve disaster risk management.
2. Data and methods
2.1. Data
Data on the administrative area, population, gross domestic product (GDP), and crop planting area (no data for 1984) from 31 provinces and metropolises in mainland China were obtained from the statistical yearbooks of China for the period 1984–2012. Historical flood disaster data, including the direct economic losses and the affected population at the provincial level, for the period 1984–2012 were extracted and verified from the meteorological disaster databases at National Climate Center of China Meteorological Administration. All those data were calibrated to precise loss figures through comparisons with different data sources such as reports from the Ministry of Civil Affairs in China (CMA, 2013 ) and NatCat, which is a private international-level disaster database maintained by the Munich Reinsurance Company, Germany.
Daily precipitation data of 575 national meteorological observatory stations from China Meteorological Administration for the period 1960–2012 were used to estimate the potential flood hazards.
2.2. Hazard index
Using the Wakeby (Park et al., 2001 ) distribution function to calculate the annual maximum daily precipitation (1960–2012) from 575 meteorological stations over China, we obtained data that show a 1-in-100-year annual maximum daily precipitation (AMDP) as a flood indicator (Fig. 1 ). Learning from the spatial pattern that shows the 1-in-100-year AMDP, we found that the area with the highest danger of floods comprised the eastern coastal provinces and municipalities, Sichuan and Chongqing, and the provinces along the middle reaches of the Yangtze River.
|
|
|
Fig. 1. Spatial variation of hazard index of floods in China. |
2.3. Exposure and vulnerability indices
Disaster exposure refers to the presence of people, livelihoods, environmental services and resources, infrastructure, and economic, social, and cultural assets in places that could be negatively affected. These factors comprise the largest dimension of disaster consequences (Zheng et al., 2012 ; IPCC SREX, 2012 ). Given that all of the 31 provinces/municipalities in Chinas mainland were affected by floods (Li et al., 2004 ), in this study, population density, GDP per square kilometer, and crop planting area of each province/municipality represent exposed population, exposed economy, and exposed crops, respectively.
Vulnerability refers to the propensity or predisposition to be adversely affected (Zheng et al., 2012 ; IPCC SREX, 2012 ). Herein, population vulnerability is defined as the ratio of affected population to total population of a province/municipality and economic vulnerability is defined as the ratio of direct economic losses to GDP of a province/municipality.
2.4. Analysis method
The linear regression method is the trend test applied herein. It is used to estimate the magnitude of the changes of the variables in a linear trend. The Inverse Distance Weighted interpolation method (ArcGIS software) is used to plot the spatial distribution maps. This interpolator assumes that each input point has a local influence that diminishes with distance; thus, the points closer to the processing cell have greater weights than those farther away.
3. The characteristics of flood exposure
3.1. Population exposed to floods
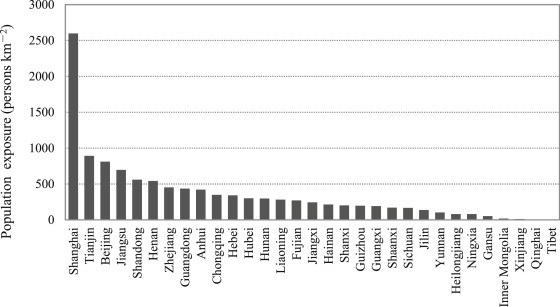
In China, the average population exposed to floods was approximately 126 persons km−2 in 1984–2012 (Fig. 2 ). In general, population exposed to floods decreases from the eastern coastal provinces to the central and western provinces. The average population exposed to floods in Shanghai, Tianjin, Beijing, Jiangsu, Shandong, and Henan is approximately 500 persons km−2 . Shanghai municipality has the greatest exposed population with 2556 persons km−2 . However, the average exposed population in Tibet, Qinghai, and Xinjiang is below 10 persons km−2 . The population exposed to floods shows a significantly increasing trend in all provinces, except Chongqing where no trend could be detected. Among all the provinces and municipalities, Shanghai showed the strongest increase with an annual rate of 61 persons km−2 per year. Beijing, Tianjin, Guangdong, Jiangsu, and Zhejiang showed increases with the annual rate of 20, 13, 11, 6, and 5 persons km−2 per year, respectively (Table 1 ). For China as a whole, the population exposed to floods had significantly increased at an annual rate of 1 person km−2 per year over the period 1984–2012; the exposed population has been constantly grew from 114 persons km−2 during 1984–1992 to 128 persons km−2 during 1993–2002 and to 136 persons km−2 during 2003–2012.
|
|
|
Fig. 2. Average exposed population to floods in China (1984–2012 mean). |
| Region | Population exposure (persons km−2 per year) | Economic exposure (103 CN¥ km−2 per year) | Crop exposure (103 hm2 per year) | Population vulnerability (‰ per year) | Economic vulnerability (‰ per year) |
|---|---|---|---|---|---|
| Anhui | 2.5∗ | 335.8∗ | 41.9∗ | 0.01 | −1.31 |
| Beijing | 20.2∗ | 3220.7∗ | −14.7∗ | 0.00 | 0.04 |
| Fujian | 3.0∗ | 465.2∗ | −14.9∗ | 0.02 | −0.91 |
| Gansu | 0.5∗ | 35.0∗ | 15.9∗ | 0.02∗ | 0.14 |
| Guangdong | 10.8∗ | 987.5∗ | −57.6∗ | 0.01 | −0.22 |
| Guangxi | 1.5∗ | 153.8∗ | 57.3∗ | 0.06∗ | −0.10 |
| Guizhou | 1.5∗ | 100.8∗ | 70.2∗ | 0.05∗ | −0.18 |
| Hainan | 3.2∗ | 222.9∗ | −0.3 | 0.05∗ | 0.44 |
| Hebei | 3.1∗ | 417.8∗ | 1.0 | 0.01 | −0.23 |
| Henan | 3.7∗ | 529.2∗ | 113.9∗ | 0.03∗ | −0.26 |
| Heilongjiang | 0.4∗ | 88.2∗ | 156.3∗ | 0.01 | −0.60 |
| Hubei | 1.4∗ | 322.1∗ | 15.5∗ | 0.06∗ | −0.85 |
| Hunan | 1.5∗ | 283.6∗ | 18.6∗ | 0.04 | −1.27 |
| Jilin | 1.0∗ | 175.5∗ | 54.0∗ | −0.01 | −1.03 |
| Jiangsu | 6.2∗ | 1526.1∗ | −37.4∗ | 0.02 | −0.38 |
| Jiangxi | 2.2∗ | 213.2∗ | −12.3∗ | 0.06∗ | −0.26 |
| Liaoning | 1.7∗ | 471.0∗ | 15.2∗ | 0.01 | −0.43 |
| Inner Mongolia | 0.2∗ | 36.2∗ | 106.2∗ | 0.00 | −0.63 |
| Ningxia | 1.7∗ | 119.0∗ | 17.2∗ | 0.01 | 0.08 |
| Qinghai | 0.1∗ | 7.0∗ | −0.4 | 0.01∗ | 0.08 |
| Shandong | 4.3∗ | 962.9∗ | −4.4 | 0.03∗ | −0.07 |
| Shanxi | 2.1∗ | 223.5∗ | −11.5∗ | 0.01 | −0.14 |
| Shaanxi | 1.4∗ | 183.8∗ | −31.3∗ | 0.04∗ | 0.12 |
| Shanghai | 61.0∗ | 10,391.8∗ | −12.3∗ | 0.00 | 0.00 |
| Sichuan | 0.4∗ | 134.7∗ | −144.6∗ | 0.06∗ | 0.07 |
| Tianjin | 13.2∗ | 3070.2∗ | −5.4∗ | 0.00 | −0.01 |
| Tibet | 0.3∗ | 1.7∗ | 1.3∗ | 0.02 | 0.06 |
| Xinjiang | 0.2∗ | 13.1∗ | 76.8∗ | 0.02∗ | −0.11 |
| Yunnan | 1.2∗ | 72.4∗ | 101.4∗ | 0.04∗ | 0.10 |
| Zhejiang | 5.3∗ | 1048.0∗ | −89.6∗ | 0.00 | −0.50∗ |
| Chongqing | −0.1 | 362.9∗ | −20.0∗ | 0.09∗ | −0.02 |
| China | 1.2∗ | 173.4∗ | 620.6∗ | 0.03∗ | −0.36∗ |
Note: * denotes the trend beyond 95% confidence level.
3.2. Economy exposed to floods
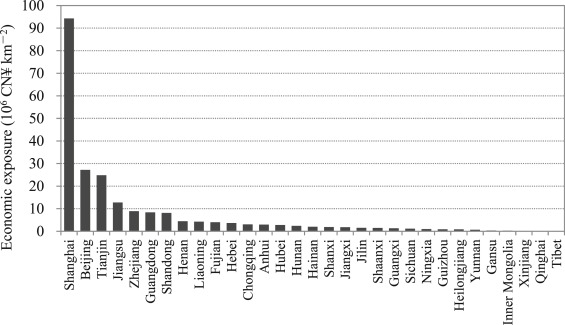
In China, the average annual value of economic assets exposed to floods was 1.49 million CN¥ km−2 during the period 1984–2012 (Fig. 3 ). In general, the average annual value of economic assets exposed to floods decreased from the east coast to the central and western hinterlands. The average economic assets exposed to floods in Beijing, Tianjin, and Jiangsu is over 10 million CN¥ km−2 . It even reaches 94.3 million CN¥ km−2 in Shanghai, while those in Xinjiang, Qinghai, and Tibet are lowest with under 0.12 million CN¥ km−2 . The average annual value of economic assets exposed to floods showed significant increases in all provinces (Table 1 ). The average annual value of economic assets exposed to floods in Shanghai grew the fastest, i.e., by 10.39 million CN¥ km−2 per year, and followed by Beijing, Tianjin, Jiangsu, and Zhejiang with an annual growth rate of over 1 million CN¥ km−2 per year (Table 1 ). The nationwide economic assets exposed to floods increased at an annual rate of 0.17 million CN¥ km−2 per year over the period 1984–2012. The exposed economic assets dramatically grew from 0.15 million CN¥ km−2 during the period 1984–1992, to 0.81 million CN¥ km−2 during the period 1984–1992, to 3.36 million CN¥ km−2 during the period 2003–2012.
|
|
|
Fig. 3. Average annual economic exposure to floods in China (1984–2012 mean). |
3.3. Crop area exposed to floods
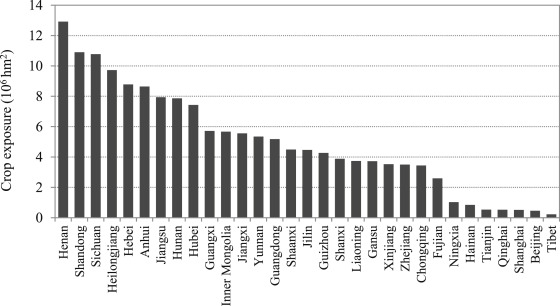
The average crop area exposed to floods in China was 153 million hm2 during the period 1985–2012 (Fig. 4 ). Overall, the crop area exposed to floods decreased from the eastern and central provinces to the western provinces. The three provinces with the largest crop areas exposed to floods were Henan, Shandong, and Sichuan provinces, with 12.92, 10.90, and 10.77 million hm2 , respectively. Tibet showed the lowest exposure, with only 0.23 million hm2 of exposed crop area. For China as a whole, a significant upward trend of crop area exposed to floods was detected, with an annual increase rate of 0.62 million hm2 per year over the period 1985–2012 (Table 1 ). The exposed crop area increased from 146 million hm2 during 1985–1992 to 153 million hm2 during 1993–2002 and 157 million hm2 during 2003–2012. For 15 out of the 31 provinces, the crop area exposed to floods showed an obvious increase, and for 11 provinces, there was a significant downward trend. With an annual growth rate of 0.16 million hm2 per year, the crop area exposed to floods increased fastest in Heilongjiang province, whereas that in Sichuan province decreased at the rate of 0.14 million hm2 per year.
|
|
|
Fig. 4. Annual crop area exposure to floods in China (1985–2012 mean). |
4. The characteristics of flood vulnerability
4.1. Assessment of populations vulnerability to floods
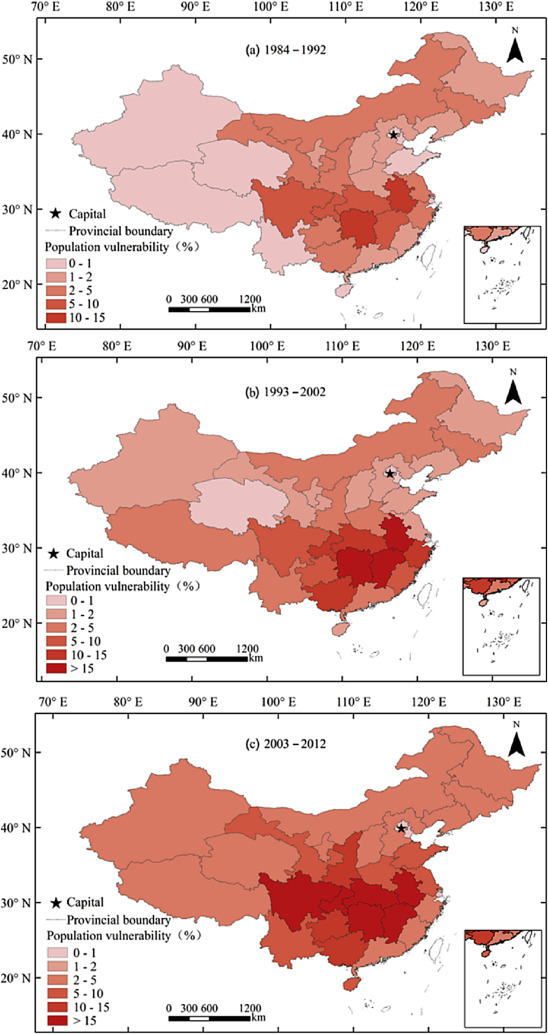
The population affected by floods in China grew from 36.2 million to 121.4 million over the period 1984–2012. Thus, a significantly increasing trend is evident. The greatest annual population vulnerable to floods was found in Hunan province, with an average of 12.9 million over the aforementioned time period; with a flood-affected population of 10.5 million and 8.9 million, Sichuan and Anhui provinces ranked second and third, respectively. For Shanghai, the average flood-affected population was only 570. For China as a whole, the population vulnerable to floods gradually increased at an annual rate of 0.03‰ per year over the period 1984–2012 (Table 1 ). The spatial distribution of the vulnerable population shows that the population vulnerability in Hunan, Hubei, Jiangxi, and Anhui provinces has been the highest with the greatest extent during 2003–2012 (Fig. 5 ).
|
|
|
Fig. 5. Spatial variation of the population vulnerability to floods in China during the periods 1984–1992, 1993–2002 and 2003–2012. |
4.2. Assessment of economic vulnerability to floods
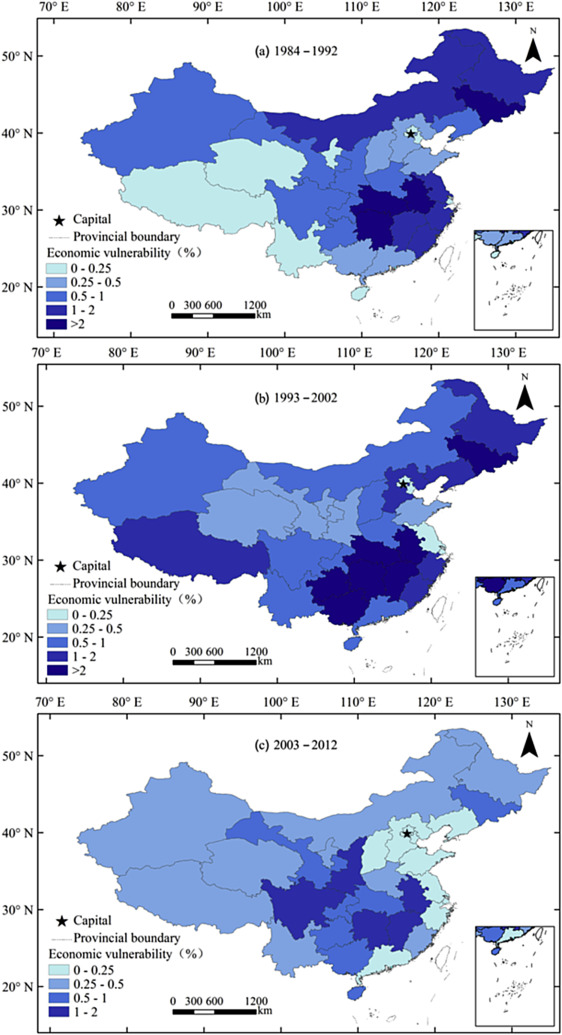
Direct economic losses caused by floods grew from 17.1 billion CN¥ to 171.2 billion over the period 1984–2012. The mean economic losses was 75.7 billion CN¥ per year. The spatial distribution of direct economic losses in China shows that direct economic losses caused by floods gradually decreased from Sichuan, Hunan, and Hubei provinces to their surrounding provinces. The maximum direct economic losses occurred in Hunan province, where an average loss of 9.9 billion CN¥ per year was reported. With direct annual economic losses of 6.3 and 5.5 billion CN¥, Sichuan and Hubei provinces ranked second and third, respectively. For Shanghai, the annual direct economic losses amounted to less than 100 million CN¥. The economic vulnerability to floods gradually decreased from Hunan, Jiangxi, and Anhui provinces to their neighboring provinces (Fig. 6 ). The lowest economic vulnerability was found in the municipalities such as Beijing, Shanghai, and Tianjin. The areas with vulnerable economies rapidly increased until the end of the 1980s and slightly decreased in recent years. Over the period 1984–2012, Chinas economic vulnerability showed a decreasing trend of 0.36‰ per year.
|
|
|
Fig. 6. Spatial variation of the economic vulnerability to floods in China during the periods 1984–1992, 1993–2002 and 2003–2012. |
5. Discussion and concluding remarks
In this study, a data set including Chinas historical flood losses and socio-economy was compiled for the period 1984–2012. On the basis of this data, the exposed population, economy, and crop area were statistically analyzed. The results showed that the average annual population, economy, and crop area exposed to floods, during the period, were 126 person km−2 , 1.49 million CN¥ km−2 , and 153 million hm2 , respectively. These three categories showed significantly increasing trends over the period of analysis. In general, Chinas flood exposure significantly increased over the past 30 years. If disaster elements such as climate hazards remain unchanged, the risk of flood will definitely increase with increasing exposure. Exposure to floods in coastal provinces and municipalities was higher than in the inland regions. Shandong, Henan, and Jiangsu provinces showed the highest levels of flood exposure. The exposed populations and economies in Shanghai, Beijing, and Tianjin ranked the highest and have been increasing over the past 30 years. However, the crop areas exposed to floods in these municipalities are small. The provinces in western China, such as Tibet, Qinghai, and Xinjiang, showed the lowest levels of flood exposure.
Although the coastal provinces had the highest flood exposure, their vulnerability was less than those in Hunan, Anhui, Chongqing, Jiangxi, and Hubei provinces along the middle reaches of the Yangtze River, where both the populations and the economic vulnerability was extremely high. Although both the population and the economy in Shanghai, Beijing, and Tianjin showed the highest exposures to floods, a small value in exposure was observed for these municipalities for both the flood-affected population and direct economic losses where, in fact, the lowest level of flood vulnerability was detected. The reason for this is that socio-economic factors play a paradoxical role in vulnerability assessment. The concentration of wealth and population will aggravate losses caused by disasters; however, wealth accumulation will increase investment in disaster prevention infrastructures, improve social disaster reduction, and, accordingly, strengthen a societys ability to fight disasters. The population density and the GDP per square kilometer show a negative relationship with flood vulnerability (Shi et al., 2009 ; Gu et al., 2012 ). The higher the values of population density and GDP per square kilometer, the lower the values of flood vulnerability. Considering the social dimension amplifies the effects of floods, much attention should be paid to socio-economic factors in flood disaster prevention. This study has been proved this. In general, a significantly increasing trend is observed in the populations vulnerability to floods. The areas that show the strongest growth in population variability mainly include the southwestern provinces, such as Chongqing, Sichuan, Guizhou, Yunnan, Guangxi, and the central provinces, such as Hubei and Jiangxi. The populations vulnerability is lower in the eastern coastal provinces. With the rapid growth of Chinas economy, the growth rate of GDP has been much higher than the speed at which economic losses caused by flood disasters has increased. Therefore, a significantly decreasing trend is evident for Chinas economic vulnerability as it relates to flood disasters.
Disaster risk is a function between weather/climatic events, exposure, and vulnerability (IPCC SREX, 2012 ; IPCC, 2014 ). Weather/climatic events are sources of disaster risks. Understanding the multifaceted natures of both exposure and vulnerability is a prerequisite for determining how weather/climatic events contribute to the occurrences of disasters. Trends in both exposure and vulnerability are major drivers of shifts in disaster risk (Zheng et al., 2012 ). Heavy precipitation is the main contributing factor to floods. The characteristics of changing disaster exposure and vulnerability from 1984 to 2012 over China reveal that the areas highly vulnerable to floods were also hit hardest by floods (Fig. 1 ). Since 1984, flood exposure has significantly increased in China. However, a significantly increasing trend is found only in the populations vulnerability to floods, whereas the economic vulnerability has decreased. Overall, the disaster risk of flood-vulnerable regions continues to increase. Therefore, when it comes to the designation and implementation of strategies and policies for climate change adaptation and disaster risk management, more attention must be paid to reduce both flood vulnerability and exposure as well as improve resilience toward the adverse effects of floods, to promote the sustainable development of both the society and the economy.
Acknowledgements
This study was supported by the National Basic Research Program of China (No. 2012CB955903 ).
References
- Balica et al., 2012 S.F. Balica, N.G. Wright, F. Meulen; A flood vulnerability index for coastal cities and its use in assessing climate change impacts; Nat. Hazards, 64 (2012), pp. 73–105
- Cao et al., 2013 L.-G. Cao, J. Zhong, B.-D. Su, et al.; Probability distribution and projected trends of daily precipitation in China; Adv. Clim. Change Res., 4 (3) (2013), pp. 153–159
- Chen et al., 2011 Y. Chen, Y.-X. Yin, X.-W. Chen; Change of flood disasters in China since the 1880s and some possible causes; J. Nat. Resour., 26 (12) (2011), pp. 2110–2120 (in Chinese)
- CMA, 2013 CMA (China Meteorological Administration); Statistical Yearbooks of Metrological Disasters in China; China Meterological Press, Beijing (2013) (in Chinese)
- Dong et al., 2012 S.-N. Dong, L.-P. Jiang, J.-Q. Zhang, et al.; Research on flood vulnerability curves of rural dwellings based on “3S” Technology; J. Catastrophology, 27 (2) (2012), pp. 34–38 (in Chinese)
- Ge and Yue, 2013 P. Ge, X.-P. Yue; A study of the variation in time and area of the vulnerability of floods bearing bodies: a case study of Nanjing; J. Catastrophology, 28 (1) (2013), pp. 107–111 (in Chinese)
- Gu et al., 2012 L.-W. Gu, C. Wang, W.-T. Li, et al.; Vulnerability characteristics of flood disaster and their impact factors in the Huaihe River Basin of Anhui province; Bull. Soil Water Conservation, 32 (5) (2012), pp. 71–74 (in Chinese)
- Huang et al., 2013 H.-Z. Huang, Y.-J. Cui, Y. Ye, et al.; Expoure of GDP and population under the scenarios of historical extreme flood years in Jiangsu-Zhejiang-Shanghai area; Resour. Environ. Yangtze Basin, 22 (6) (2013), pp. 801–807 (in Chinese)
- IPCC, 2014 IPCC; Climate Change 2014: Impacts, Adaptation and Vulnerability; Cambridge University Press, Cambridge (2014)
- IPCC SREX, 2012 IPCC SREX; Managing the Risks of Extreme Events and Disasters to Advance Climate Change Adaptation: A Special Report of Working Groups I and II of the Intergovernmental Panel on Climate Change; Cambridge University Press, Cambridge (2012)
- Li et al., 2004 M.-S. Li, S. Li, Y.-H. Li; Analysis of flood disaster in the past 50 year in China; Chin. J. Agrometeorology, 25 (1) (2004), pp. 38–41 (in Chinese)
- Lu and Cheng, 2010 M.-H. Lu, X.-F. Cheng; A review on assessment of flood disaster; Sichuan Environ., 29 (6) (2010), pp. 127–132 (in Chinese)
- Park et al., 2001 J.S. Park, H.S. Jung, R.S. Kim, et al.; Modelling summer extreme rainfall over the Korean Peninsula using Wakeby distribution; Int. J. Climatol., 21 (2001), pp. 1371–1384
- Shi et al., 2009 Y. Shi, S.-Y. Xu, C. Shi, et al.; Flood vulnerability and risk in coastal regions of China; Sci. Geogr. Sin., 29 (6) (2009), pp. 853–857 (in Chinese)
- Zhang et al., 2011 H. Zhang, X.-Y. Xu, L. Zhang, et al.; Comprehensive assessment of loss of flood and waterlogging disasters from 2000 to 2010 and analysis of their causes; J. Econ. Water Resour., 29 (5) (2011), pp. 5–9 (in Chinese)
- Zheng et al., 2012 F. Zheng, C. Sun, J.-P. Li; Climate change: new dimensions in disaster risk, exposure, vulnerability, and resilience; Progress. Inquisitiones Mutat. Clim., 8 (2) (2012), pp. 79–83 (in Chinese)
Document information
Published on 15/05/17
Submitted on 15/05/17
Licence: Other
Share this document
Keywords
claim authorship
Are you one of the authors of this document?

