Abstract
This article shows experimentally the thermal performance of two test cells with different coverage systems, Light Green Roof (LGR) and ceramic roof by analyzing internal surface temperatures (IST) in the ceiling and dry bulb temperatures (DBT). The objective was to evaluate the spatial distribution of temperatures in buildings according to spatial and temporal Dynamic Climatology approaches. An experimental, typical day for heat conditions was determined. The data of the main climatic variables provided by an automatic weather station and temperatures inside the test cells were collected using thermocouples installed such that the entire space is included. The results led to the conclusion that the LGR has a balanced IST and DBT spatial distribution compared with ceramic roofs. Nevertheless, the analysis of the thermal performance is only one of the variables that must be considered when developing a construction proposal that is adapted to the context. The manner in which the thermocouples were placed inside the test cells also showed the importance of specifying the location of the sensors in experimental studies on the behavior and thermal performance of buildings.
Keywords
Light Green Roof (LGR) ; Thermal performance ; Dynamic Climatology ; Internal temperatures ; Spatial distribution ; Experimental typical day
1. Introduction
Architecture has a fundamental role in creating internal and external spaces. It follows housing standards determined by individual needs, particularly with respect to human comfort based on the principles of natural thermal conditioning.
The environment consists of many elements that relate to each other and directly affect the human body, which tries to adapt without great loss of energy. The conditions in which man can achieve a comfortable level of perception are part of the “comfort zone.” The comfort zone is determined by the needs of man in maintaining hygrothermal balance; in the case of buildings that depend on human physical conditions, the time of occupation, length of stay, and activities, among other factors determine the comfort zone (Freitas, 2005 ; Freitas, 2005 ; Budyco, 1974 ).
Human thermal comfort depends on, among other things, four climate variables: solar radiation (the genesis factor of climate), air temperature, humidity, and ventilation. Body metabolic heat dissipation basically occurs in three ways: radiation (45%), convection (30%), and evapotranspiration (25%). Dissipation possibly occurs through conduction if the body is in contact with cold surfaces. The mechanism of heat convection is a function of air velocity because body radiation depends on the surrounding temperature. Evapotranspiration partially depends on the pressure of water vapor. Insufficient or excessive heat dissipation in the environment can cause discomfort. Therefore, natural thermal conditioning depends mainly on solar radiation and outside air temperature (Docherty and Szokolay, 1999 ). Comfort can be evaluated by the skin, since its surface temperature is around 33–34 °C. Thus, if the surrounding temperature is higher or lower than the specified range, thermal discomfort will likely result.
Buildings protect individuals from the weather. When buildings do not follow comfort principles, individuals are exposed to the emergence of physical or mental disorders. The inside of buildings presents particular environmental conditions that differ from the external environment and, theoretically, are more suitable for human occupation (Silva and Vecchia, 2003 ).
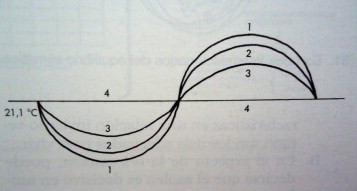
According to Olgyay (1998 ), the process for creating suitable spaces for human life can be divided into four steps: (1) analysis of local climatic conditions; (2) evaluation of the influence of climate based on human sensory perception; (3) search for appropriate technological solutions for construction that are consistent with local climate; and (4) architectural application from the previous three phases (Fig. 1 ).
|
|
|
Fig. 1. Sequence for interrelation of variables (Olgyay, 1998 ). |
The temperature variations, solar radiation, air speed, and air humidity are conditioned by the dominant air mass that acts at the project site in the mesoclimatic scale. However, other conditions must be taken into account, such as factors that modify initial climate conditions, such as topography, relief, altitude, latitude, longitude, continentality, and vegetation as well as the scale of time approach (years, months, and days) and space (macroclimate, mesoclimatic, and microclimate) (Egan, 1975 ). Therefore, the application of dynamic climatology is more appropriate because it recognizes zonal and regional climates. These are then correlated to general atmosphere circulation, based on meteorological data taken at the surface and obtained automatically in real time, enabling the validation of energy efficiency simulation software.
In this work, the study of the spatial distribution of temperatures in two test cells was based on the concept of the experimental typical day, which represents a specific climate condition according to the Dynamic Climate approach. The possibility of adopting this approach in a short time contributes to the understanding of climate conditions and its possible effects on the built environment, with respect to energy conservation as well as the behavior and thermal performance of buildings (Cardoso et al ., 2012 ; Cardoso and Vecchia, 2013 ).
2. Methodology
This paper is investigative in character. It analyzes the vertical variation of internal air temperature or dry bulb (DBT) as well as the spatial distribution of the inner surface temperature in the ceiling using two test cells with different coverage systems. Then, their thermal performances are compared in a heat situation. No standard establishes how internal temperatures data should be collected in a building. This work seeks to standardize methodological procedures for gathering such data in built environment. This research was based on Dynamic Climatology, which prescribes the experimental typical summer day for obtaining analysis results.
In this work, temperature data were collected using thermocouples installed at predetermined locations in two test cells, on a LGR and on a ceramic roof with a wooden structure and concrete slab. These locations were constructed in conventional manner. The data regarding the main climatic variables for the experimental typical day were collected by an automatic weather station at the Science Center of Engineering Applied to Environment (CCEAMA), University of Sao Paulo (USP).
2.1. Location and characterization of the test cells and automatic station
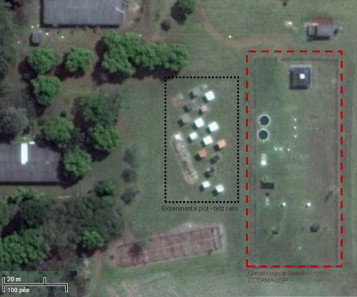
The study was conducted at the experimental plot of the Climatological Station at the CCEAMA (Fig. 2 ), located at Lobo׳s dam margin in Itirapina, Sao Paulo State, Brazil, between the geographical coordinates 22°01׳22׳׳ / 22°10׳13׳׳ South and 43°57׳38"/ 47°53׳57׳׳ West, at an altitude of 733 m above sea level.
|
|
|
Fig. 2. Climatological Station and Experimental plot with test cells – CCEAMA – USP. (In: Google Maps – accessed on December 03rd, 2013) |
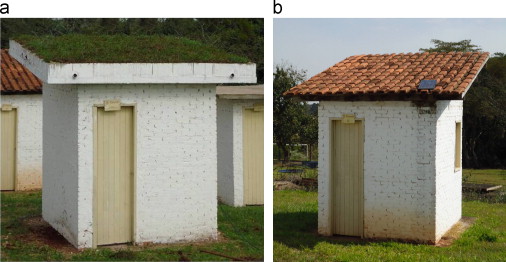
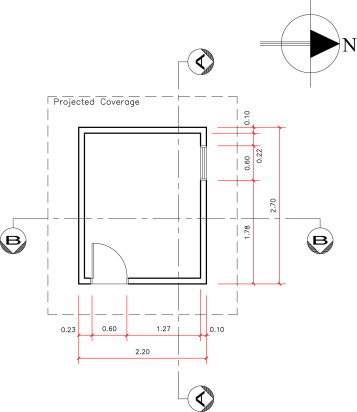
The test cells have a concrete floor (raft flooring 0.15 m thick), walls composed of massive ceramic bricks (0.20 m×0.10 m×0.05 m) painted white, a wooden door to the south and a window to the north. The only variations involve the different types of roof systems. The roofs had internal dimensions of 2.0 m×2.50 m with a default door of 2.10 m×0.60 m and a window of 1.0 m×0.70 m (Fig. 3 ).
|
|
|
Fig. 3. (a) Light Green Roof test cell and (b) ceramic rood test cell. |
They were designed to ensure equivalence to a real situation in data acquisition and are located on the experimental plot so that they have the same incidence of solar radiation without casting shadows on each other.
In this study, two test cells were selected at an experimental plot: a test cell with an LGR with a 3.26×3.76 m (12.25 m2 area) preformed slab, 23% slope, and 0.40 m ledge for green roof support. The second cell has ceramic roof with a wooden structure and a concrete slab. It had a 26% slope and a ceiling height of 2.40 m.
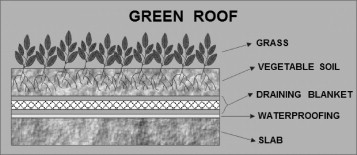
LGR is made up of grass, vegetable soil substrate, a draining blanket, and a waterproofing layer. This set was placed on a slab (Fig. 4 ).
|
|
|
Fig. 4. Schematic drawing of a Green Roof Light. |
Although the construction of this type of coverage is simple, the drainage and sealing systems must be chosen and executed with rigorous quality. The LGR is designed to have a proper weight equivalent to the weight of a conventional roof system with a wooden frame and ceramic tiles (Cardoso and Vecchia, 2013 ). The waterproofing was composed of polyurethane resin derived from castor oil (Ricinus communis ), developed by the Group of Analytical Chemistry and Technology of Polymers, Chemistry Institute of São Carlos-USP, and marketed by Cequil-Central Ind. Des. Polímeros Ltda. Company located in Araraquara, São Paulo, Brazil. The use of this resin as a waterproofing layer has great relevance because it is biodegradable and nontoxic: it is harmful to the environment or human health, composed of a renewable source, and contributes sustainable construction ( Cardoso et al., 2012 ). The MacDrain 2L geocomposite used to drain the substrate (in partnership with Maccaferri do Brasil Ltda.) is lightweight and flexible: the core is formed by a three-dimensional blanket composed of polypropylene filaments with a thickness of 10–18 mm, geotextile filters on both sides, and a non-woven polyester base. For the LGR drainage, two 3" PVC tubes were placed on the lower ledge near the ends. Vegetable components were used on the Batatais grass (Paspalum notatum ), also known as common and pasture grass. Thus, it is resistant to sunlight and trampling.
2.2. Description of thermocouples and automatic weather station
The internal surface temperature (IST) and DBT values from the test cells were collected using type T copper-constantan (alloy of copper and nickel) thermocouples, 2×24 AWG. The measurements were taken at intervals of 30 min and were recorded and stored using a CR10X datalogger. The thermocouples are very accurate. Temperature can be measured with an error of ±0.1–0.2 °C because the thermocouples are in perfect condition (Kinzie, 1973 ). Doors and windows were kept closed during the experiment to obtain more precise temperature values without the influence of natural airflow on the collected records (Cardoso, 2011 ).
All equipments and sensors in the automatic weather station, including the 12 V rechargeable battery, solar panel, and CR10X datalogger, are from Campbell Scientific Inc., which is responsible for the collection and storage of external climate data.
2.3. Installation of temperature sensors inside test cells
Fig. 5 refers to the schematic floor plan of the test cells. The schematic (AA) shows the locations of the dry bulb temperature sensors.
|
|
|
Fig. 5. Schematic floor plan for test cells. |
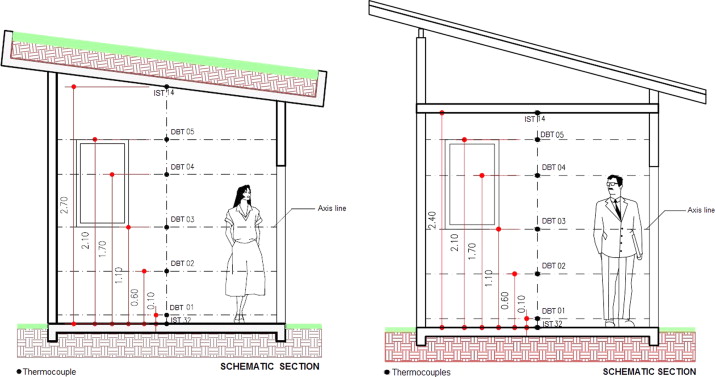
To assess the DBT, thermocouples were installed at the center of the cells. The heights of the thermocouples were 0.10 m, 0.60 m, 1.10 m, 1.70 m, and 2.10 m from the floor. These heights were defined exclusively for this research. All sensors were well distributed.
An additional two sensors were included in this evaluation: a surface temperature sensor on the floor (IST 32) and one on the ceiling (IST 14), as shown in Fig. 6 .
|
|
|
Fig. 6. Schematic sections for test cells – dry bulb temperature sensors and internal surface temperature sensors for floor and roof. |
Data were collected at different heights in the central axis of tests cells to visualize the vertical gradient of internal air temperature without the direct influence of a specific wall.
Understanding and analyzing the difference between internal air temperature values is fundamentally important in studies about stress heat in buildings, according to the publication INNOVA (Bruel and Kjaer, 1996 ).
In total, five sensors are used to acquire DBT information in shelters made of white PVC tubes (0.30 m in length and 4 in. in diameter). A plastic blanket with a metallized surface (foil) is used to better isolate thermocouples.
Although all shelters have cooler forced ventilation, they were kept off because the measurements were made indoors. Without the direct incidence of solar radiation, the use of these devices would not affect measurements of dry bulb temperature.
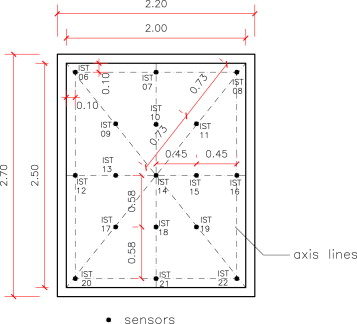
Some thermocouples for the internal surface temperatures in the ceiling were installed, as shown in Fig. 7 . The spatial distribution of the thermocouples on this surface was from the central point, represented by the IST 14 sensor. Four main lines were drawn: two perpendicular (transverse and longitudinal) and two diagonals (see axis lines on Fig. 7 ).
|
|
|
Fig. 7. Scheme of internal plant coverage – internal surface temperature sensors. |
Four other secondary axes lines were located at 0.10 m from the walls to collect data closer to those surfaces without influencing the measurements. Some thermocouples were installed at the intersections of the primary and secondary axis lines, and the others were positioned equidistant between these sensors and the central sensor.
The researcher established the location of each sensor such that the sensors were not overloaded, which is expected with large amounts of data. In total, 17 sensors were installed in each test cell to collect data from the internal surface temperature of coverage systems.
With this distribution of sensors on the ceiling, we intend a spatialization of measurements and to verify that a significant difference of temperatures is present between the points.
2.4. Climate analysis for Brazil׳s Southeast region
According to Monteiro (1973 ), the climate of the central region in Sao Paulo is controlled by equatorial and tropical air masses, which constitute two different periods: a dry season with warm and dry winter between April and September, and a rainy season with warm and humid summer from October to March.
During the dry season, a Tropical Atlantic air mass and Polar Atlantic air mass prevails over the region. Low rainfall, low clouds, low humidity, and lower average compared with temperatures during the rainy season characterize this period. The rainy season has high temperatures on average with abundant precipitation and high relative humidity as Equatorial Continental air mass prevails.
In this work, the climatic regime from Itirapina-SP was analyzed as representative episodes, according to the adaptation by Vecchia (1997 ) from the definition of Monteiro (1969 ) of weather types. This analysis has two basic steps: the pre-frontal as the beginning of the process, expressed by the foreshadowing and advancement of an air mass (polar atlantic cyclone), and the post-frontal, represented by cold air mass domains and transition conditions for a tropical air mass.
According to the recorded climatic events, by analyzing meteorological variables and confirming satellite images, we extracted the experimental typical summer day, which showed maximum solar radiation, higher outside air temperature, and clear skies. Such are the basic conditions for evaluating the behavior and thermal performance of buildings for a heat situation.
The data collected refers to the period between January-April 2013. The climatic events recorded during this period determined the experimental typical day according to heat conditions, i.e., maximum solar radiation and high outside air temperature, according to the values for these variables on the Climatological Normals 1960–1991 (1992) (Ministry of Agriculture and Agrarian Reform, 1992 ).
3. Results
On March 4th, 2013 (63rd Julian day) was taken as the reference day for the study of behavior and thermal performance for LGR and ceramic roof due to its remarkable heat characteristic that surpasses the value of 27 °C, which is the average maximum of climatological normals obtained in São Carlos from 1961 to 1990.
The temperature range recorded on this day was 13.93 °C, with a minimum temperature of 17.94 °C and a maximum of 31.87 °C. The day was cloudless, with values of global solar radiation that reached 779 W/m2 .
4. Comparison of test cells thermal performance
4.1. Dry bulb temperatures (DBT)
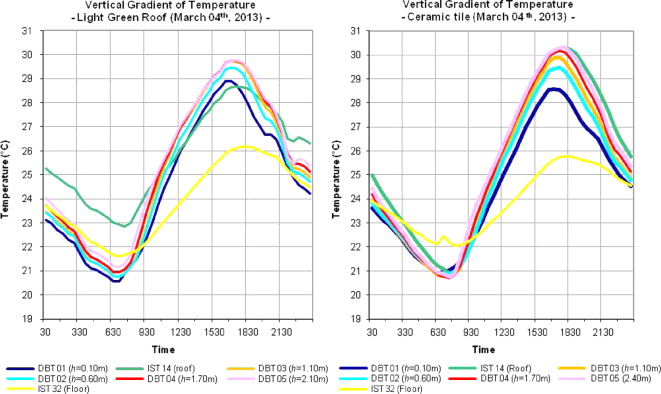
Fig. 8 and Table 1 ; Table 2 show the daily variation for DBT and IST temperatures from the floor to the ceiling on the central axis of each test cell for March 4, 2013.
|
|
|
Fig. 8. Vertical gradient of temperature charts – Light Green Roof and Ceramic Roof – March 04th, 2013. |
| Indicators | Outside air | IST 32 (floor) | DBT 01 (0.10 m) | DBT 02 (0.60 m) | DBT 03 (1.10 m) | DBT 04 (1.70 m) | DBT 05 (2.10 m) | IST 14 (2.70 m) | |
|---|---|---|---|---|---|---|---|---|---|
| Temperature | Maximum ( °C) | 31.87 (4:00 p.m.) | 26.18 (6:30 p.m.) | 28.91 (4:30 p.m.) | 29.47 (5:00 p.m.) | 29.73 (5:00 p.m.) | 29.76 (5:30 p.m.) | 29.77 (5:30 p.m.) | 28.67 (5:30 p.m.) |
| Minimum ( °C) | 17.94 (6:30 a.m.) | 21.61 (7:00 a.m.) | 20.57 (7:00 a.m.) | 20.77 (7:00 a.m.) | 20.76 (7:00 a.m.) | 20.94 (7:00 a.m.) | 21.18 (7:00 a.m.) | 22.86 (7:30 a.m.) | |
| Temperature range ( °C) | 13.93 | 4.57 | 8.34 | 8.7 | 8.97 | 8.82 | 8.59 | 5.81 | |
Light Green Roof – March 04th, 2013.
| Indicators | Outside air | IST 32 (Floor) | DBT 01 (0.10 m) | DBT 02 (0.60 m) | DBT 03 (1.10 m) | DBT 04 (1.70 m) | DBT 05 (2.10 m) | IST 14 (2.40 m) | |
|---|---|---|---|---|---|---|---|---|---|
| Temperature | Maximum ( °C) | 31.87 (4:00 p.m.) | 25.78 (6:00 p.m.) | 28.58 (5:00 p.m.) | 29.49 (5:30 p.m.) | 29.91 (5:30 p.m.) | 30.17 (5:30 p.m.) | 30.31 (5:30 p.m.) | 30.3 (5:30 p.m.) |
| Minimum ( °C) | 17.94 (6.30 a.m.) | 22.06 (8:00 a.m.) | 20.87 (6:30 a.m.) | 20.87 (7:30 a.m.) | 20.75 (7:30 a.m.) | 20.72 (7:30 a.m.) | 20.77 (7:30 a.m.) | 20.89 (7:30 a.m.) | |
| Temperature range ( °C) | 13.93 | 3.72 | 7.71 | 8.62 | 9.16 | 9.45 | 9.54 | 9.41 | |
Ceramic roof – March 04th, 2013.
Regarding LGR data, the sensors 1.10 m and 1.70 m from the floor had a higher temperature range at 8.9 °C. However, the sensor closest to the floor at 0.10 m (DBT 01) and nearest the ceiling at 2.10 m (DBT 05) had a lower temperature range at approximately 8.5 °C.
Maximum and minimum temperatures were compared. The differences were greater among the sensors on the floor and located at 0.10 m (maximum of 2.7 °C and minimum of 1 °C), between the sensors on the floor and ceiling (maximum of 2.5 °C and minimum of 1.2 °C), and between the sensors on the ceiling and located 2.10 m from floor (maximum of 1.1 °C and minimum of 1.7 °C).
The maximum temperatures of the sensors at 1.10 m, 1.70 m, and 2.10 m showed no difference. Moreover, the differences in the minimum temperatures between the sensors was approximately 0.2 °C, which is within the natural error measure.
Therefore, the higher thermal lag of approximately two hours was among the maximum temperatures from the sensors on the floor (26.18 °C to 6:30 p.m.) and sensors 0.10 m from the floor (28.91 °C to 4:30 p.m.). The second largest thermal lag of approximately one hour was among the sensors on the floor (26.18 °C to 6:30 p.m.) and ceiling (28.67 °C to 5:30 p.m.).
The difference between the outside air temperature and ceiling sensor (IST 14) was greater than 3 °C. The difference between the outside air temperature and the sensors in the “inhabited area” (DBTs 03 and 04) was approximately 2 °C.
The comparisons between the dry bulb temperature sensors revealed that the vertical temperature gradient is practically homogeneous.
Regarding the conventional cell, the floor sensor (IST 32) had the lowest temperature range (3.72 °C). The sensors located at 0.10 m (DBT 01) and 0.60 m (DBT 02) had larger temperature ranges than the floor sensor but lower temperatures than other sensors (7.5–8.5 °C).
Sensors at 1.10 m (DBT 03), 1.70 m (DBT 04), 2.10 m (DBT 05) and on the ceiling (IST 14) had similar temperature ranges and had higher temperature ranges among all sensors at approximately 9.5 °C. Thus, the vertical temperature gradient in this test cell is inhomogeneous because the maximum temperature values increased as proximity to the roofing system increased.
Maximum temperature between the sensors on the floor and ceiling differed most (4.5 °C). The second major difference was between the sensors on the floor and 0.10 m high (2.8 °C). Other comparisons had differences less than 0.9 °C.
For minimum temperatures, the greatest differences were between the sensors on the floor and sensors at 0.10 m as well as between the sensors on the floor and sensors in the ceiling at approximately 1.2 °C. Other comparisons of minimum temperatures were lower than 0.2 °C.
The differences of maximum temperatures between outside air temperature and sensors at 1.10 m (DBT 03), 1.70 m (DBT 04), and the ceiling (IST14) were less than 2 °C. The largest thermal lag of an hour and a half was recorded for minimum temperatures between sensors on the floor and sensors at 0.10 m.
At two test cells the floor׳s sensors (IST 32) had lower maximum temperatures compared to all other sensors.
The conventional test cell showed us a heterogeneous vertical temperature gradient because the maximum temperature values increased as the height of the sensors increased, i.e., the closer the sensors to the roof, the greater the value recorded. Thus, the sensor 2.10 m from the floor and the sensor 0.30 m from roof (DBT 05) recorded maximum temperatures similar to the ceiling sensor (IST14).
For test cell with LGR, the vertical temperature gradient was homogeneous with the test cell on the ceramic roof.
Regarding the higher difference between maximum temperatures, sensors on the floor and the ceiling for LGR had values twice as low (2.5 °C) in the same comparison with conventional test cells (4.5 °C). Even the maximum temperature difference between sensors on the floor and sensors at 0.10 m (IST 32 and DBT 01) had equal values for both test cells (2.8 °C).
The values obtained for LGR were lower than the test cell with a ceramic roof except between the sensors on the ceiling and sensors at 2.10 m, which showed a difference of 1.1 °C for LGR and no difference for conventional test cells.
4.2. Internal surface temperatures (IST) – coverage systems
The most complex analysis of internal surface temperature (IST) involves the roofing system and understanding the spatial distribution on the ceiling surface under the influence of solar radiation. The coverage system is the constructive element that receives higher incidences of radiation.
As explained in the methodology, 17 thermocouples were installed on the internal surface of slabs at each test cell. A total of 34 sensors were installed.
To facilitate the interpretation and analysis of data collected by these sensors, two graphs and their respectively tables were drawn for each cell, one for the closest sensors to the walls: those located at 0.10 m from each wall, and one for the more internal sensors located at equidistant points between the sensors closer to the walls and the middle sensor on imaginary lines (transverse, longitudinal, and two diagonals). Middle point data were included in both charts.
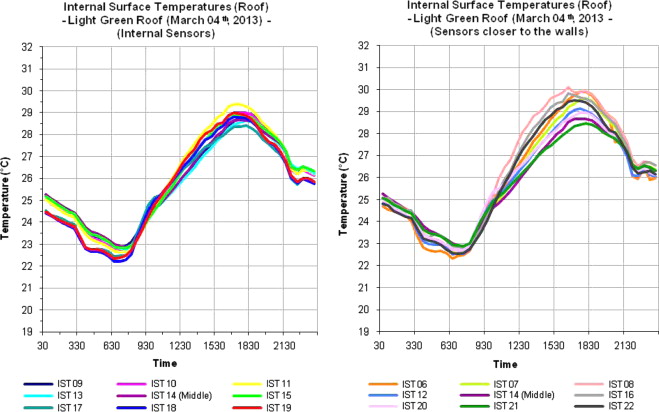
For LGR, the chart in Fig. 9 and Table 3 ; Table 4 show the IST analysis.
|
|
|
Fig. 9. Internal surface temperatures charts – Light Green Roof – March 04th, 2013. |
| Indicators | Outside air | IST 09 | IST 10 | IST 11 | IST 13 | IST 14 | IST 15 | IST 17 | IST 18 | IST 19 | |
|---|---|---|---|---|---|---|---|---|---|---|---|
| Temperature | Max. ( °C) | 31.87 (4:00 p.m.) | 28.91 (6:00 p.m.) | 29.0 (5:30 p.m.) | 29.38 (5:00 p.m.) | 28.64 (6:00 p.m.) | 28.67 (5:30 p.m.) | 28.91 (5:00 p.m.) | 28.41 (6:00 p.m.) | 28.79 (5:00 p.m.) | 29 (5:00 p.m.) |
| Min. ( °C) | 17.94 (6.30 a.m.) | 22.9 (7:00 a.m.) | 22.7 (7:00 a.m.) | 22.64 (7:00 a.m.) | 22.77 (7:30 a.m.) | 22.86 (7:30 a.m.) | 22.81 (7:30 a.m.) | 22.44 (6:30 a.m.) | 22.22 (6:30 a.m.) | 22.35 (6:30 a.m.) | |
| Temperature range ( °C) | 13.93 | 6.01 | 6.3 | 6.74 | 5.87 | 5.81 | 6.1 | 5.97 | 6.57 | 6.65 | |
Light Green Roof – Internal sensors – March 04th, 2013.
| Indicators | Outside air | IST 06 | IST 07 | IST 08 | IST 12 | IST 14 | IST 16 | IST 20 | IST 21 | IST 22 | |
|---|---|---|---|---|---|---|---|---|---|---|---|
| Temp. | Max. ( °C) | 31.87 (4:00 p.m.) | 29.89 (5:30 p.m.) | 29.6 (5:30 p.m.) | 29.87 (5 p.m.) | 29.12 (5:30 p.m.) | 28.67 (5:30 p.m.) | 29.73 (5:00 p.m.) | 28.93 (5:30 p.m.) | 28.46 (5:30 p.m.) | 29.51 (5:00 p.m.) |
| Min. ( °C) | 17.94 (6.3 a.m.) | 22.31 (6:30 a.m.) | 22.67 (7:30 a.m.) | 22.7 (7:00 a.m.) | 22.57 (7:00 a.m.) | 22.86 (7:30 a.m.) | 22.8 (7:30 a.m.) | 22.72 (7:00 a.m.) | 22.9 (7:30 a.m.) | 22.54 (7:00 a.m.) | |
| Temperature range ( °C) | 13.93 | 7.58 | 6.93 | 7.17 | 6.55 | 5.81 | 6.93 | 6.21 | 5.56 | 6.97 | |
Light Green Roof – Sensors closer to the walls – March 04th, 2013.
Maximum values between outside air temperatures and sensors located internally on the LGR׳s roof were compared. The differences were 3.46–2.49 °C (IST 17 and IST 11). The largest thermal lag between outside air temperature and the sensors was approximately one and a half hours.
The maximum temperatures of the internal sensors were compared. The largest difference was between IST 11 and IST 17 sensors at approximately 0.6 °C.
Nevertheless, the average temperature range among sensors was 6.2 °C. Thus, the spatial distribution of maximum internal surface temperature may be considered homogeneous, even though conditions such as substrate saturation and its drainage capacity have not been controlled and may have influenced the recorded temperatures.
The sensors closer to the walls were compared. The IST 14 sensor (middle) recorded the second lowest maximum temperature compared with other sensors. The lowest temperature was IST 21 sensor.
This sensor (IST 21) is located in the middle of the lower ledge end of the inclined LGR roof. Therefore, the draining next to this sensor is not identical to the others sensors (the water may be suspended).
However, even though drainage was not controlled, all sensors detected that the spatial distribution of the internal surface temperature is almost homogeneous because the arithmetic mean of the temperature range for sensors was 6.6 °C.
According to the comparison between the maximum recorded by the sensors and the outside air temperature, the difference was 3.4 °C for the lowest temperature obtained (IST 21) and 1.98 °C for the maximum value obtained (IST 06). The thermal lag between the maximum values for outside air temperature and the sensors was approximately one and a half hours.
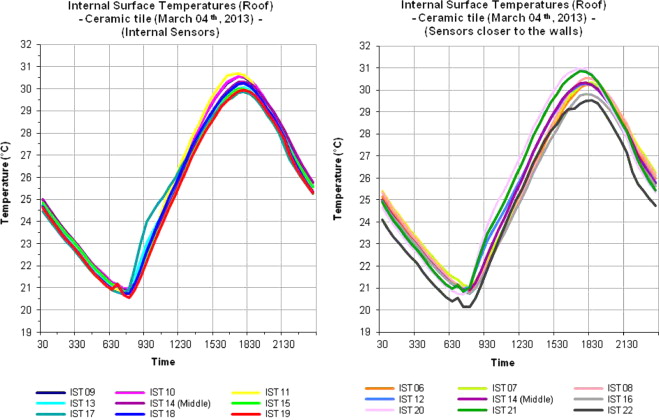
Charts in Fig. 10 and Table 5 ; Table 6 were prepared using IST analysis from the test cell with a ceramic roof.
|
|
|
Fig. 10. Internal surface temperatures charts – ceramic roof – March 04th, 2013. |
| Indicators | Outside air | IST 09 | IST 10 | IST 11 | IST 13 | IST 14 | IST 15 | IST 17 | IST 18 | IST 19 | |
|---|---|---|---|---|---|---|---|---|---|---|---|
| Temp. | Max. ( °C) | 31.87 (4:00 p.m.) | 30.54 (5:30 p.m.) | 30.55 (5:30 p.m.) | 30.69 (5:30 p.m.) | 30.02 (5:30 p.m.) | 30.3 (6:00 p.m.) | 30 (5:30 p.m.) | 29.87 (6:00 p.m.) | 30.23 (6:00 p.m.) | 29.95 (6:00 p.m.) |
| Min. ( °C) | 17.94 (6.30 a.m.) | 20.87 (7:30 a.m.) | 20.97 (7:30 a.m.) | 20.79 (7:30 a.m.) | 20.89 (7:30 a.m.) | 20.89 (7:30 a.m.) | 20.83 (7:30 a.m.) | 20.72 (7:30 a.m.) | 20.74 (8:00 a.m.) | 20.56 (8:00 a.m.) | |
| Temperature range ( °C) | 13.93 | 9.67 | 9.58 | 9.9 | 9.13 | 9.41 | 9.17 | 9.15 | 9.49 | 9.39 | |
Ceramic roof – Internal sensors – March 04th, 2013.
| Indicators | Outside air | IST 06 | IST 07 | IST 08 | IST 12 | IST 14 | IST 16 | IST 20 | IST 21 | IST 22 | |
|---|---|---|---|---|---|---|---|---|---|---|---|
| Temp. | Max. ( °C) | 31.87 (4:00 p.m.) | 30.23 (6:00 p.m.) | 30.34 (6:00 p.m) | 30.54 (6:00 p.m.) | 30.3 (6:00 p.m.) | 30.3 (6:00 p.m.) | 29.83 (6:00 p.m.) | 31 (5:30 p.m.) | 30.86 (5:30 p.m.) | 29.54 (6:30 p.m.) |
| Min. ( °C) | 17.94 (6.30 a.m.) | 20.86 (8:00 a.m.) | 21.08 (8:00 a.m) | 20.93 (8:00 a.m.) | 20.94 (7:30 a.m.) | 20.89 (7:30 a.m.) | 20.76 (8:00 a.m.) | 20.71 (7:30 a.m.) | 20.85 (7:30 a.m.) | 20.14 (8:00 a.m.) | |
| Temperature range ( °C) | 13.93 | 9.37 | 9.26 | 9.61 | 9.36 | 9.41 | 9.07 | 10.29 | 10.01 | 9.4 | |
Ceramic Roof – Sensors closer to the walls – March 04th, 2013.
The differences between outside air maximum temperatures and the sensors located deeper in the roof were 2 °C for the lowest temperature obtained (IST 17) and 1.18 °C for the highest value obtained (IST 11).
The thermal lag between the maximum values of outside air temperature and sensors was approximately one and a half hours. The greatest maximum temperature difference was between the IST 11 and iST 16 sensors at approximately 0.8 °C.
However, the range of the average temperature range these sensors was 9.4 °C. The spatial distribution of the internal surface temperature can also be considered homogeneous due to the attic between the slab and ceramic roof, although this mean amplitude was larger than the LGR cell.
For the sensors closer to the walls, the greatest difference of the maximum temperatures was between the IST 20 and IST 22 sensors at approximately 1.46 °C.
Maximum values for outside air temperature and sensors located closer to the walls and the middle sensor (IST 14) were compared. The difference was 2.33 °C for the lowest temperature recorded (IST 22) and 0.87 °C for the highest maximum collected (IST 20). The maximum thermal lag recorded between outside air temperature and sensors was about two hours.
However, the temperature range average among sensors closer to the walls and middle sensor was 9.5 °C. Thus, the spatial distribution of the internal surface temperature can be considered homogeneous, even with the existence of an attic between the slab and the ceramic roof.
The attic enabled energy to be exchanged through air convection and conduction between the tiles and slab surface and may have influenced temperatures readings.
5. Conclusion
The internal surface temperature of roofs was analyzed. The temperature ranges for sensors at the conventional test cell were higher than sensors on the LGR test cell.
Test cell with ceramic roof the temperature curves for all sensors followed a uniform drawing, unlike curves presented by the LGR cell, the designs of which were not very similar. This fact is probably due to the saturation state and drainage time of the soil in the green roof. The slab is sloped. Thus, each sensor receives a slightly different influence from each part of the roof.
This hypothesis cannot be confirmed in this study because these variables were not considered or controlled. Moreover, no problems with the sensors for collecting these data were identified. Therefore, the behavior of curves on the charts may be explained by the irrigation and drainage of the green roof.
The internal air temperature inside the two test cells showed that the LGR had better thermal performance. The vertical temperature gradient was more homogeneous because the maximum temperatures were lower, the minimum temperatures were higher, and the temperature ranges were lower compared to conventional test cells.
Acknowledgment
The authors wish to thank CNPq for their financial support and the staff of the Climatological Station CCEAMA-USP , for their collaboration on technical issues and on research execution.
References
- Bruel and Kjaer, 1996 Bruel and Kjaer, 1996. INNOVA AirTech Instrument: The Booklet of the Introduction to Thermal Comfort, 32 pp. 〈http://www.innova.dk〉 (08.18.11.).
- Budyco, 1974 M.I. Budyco; Climate and life; International Geophysics Series 18, Library of Congress, USA (1974)
- Cardoso, 2011 G. Cardoso; Characterization of Rigid Polyurethane Foam (PU) Extracted from: Castor Oil (Ricinus communis ) for Building Insulation ; VDM Verlag Dr Müller, Saarbrücken, Germany (2011)
- Cardoso and Vecchia, 2013 G.T. Cardoso, F. Vecchia; Thermal behavior of green roofs applied to tropical climate; J. Constr. Eng., 1 (1) (2013), pp. 1–7 (ISSN 2314-5986)
- Cardoso et al., 2012 G.T. Cardoso, S. Claro Neto, F. Vecchia; Rigid foam polyurethane (PU) derived from castor oil (Ricinus communis ) for thermal insulation in roof systems ; Front. Archit. Res., 1 (4) (2012), pp. 348–356 (ISSN 2095-2635)
- Docherty and Szokolay, 1999 M. Docherty, S.V. Szokolay; Climate Analysis; PLEA: Passive and Low Energy Architecture International, University of Queensland Printery, Brisbane (1999), p. 57
- Egan, 1975 M.D. Egan; Concepts in Thermal Comfort; Prentice-Hall Inc., New Jersey (1975)
- Freitas, 2005 Freitas, R., 2005. What׳s comfort. In: Proceedings of the National Meeting About Comfort on Built Environment, 8; Latin American Meeting About Comfort on Built Environment, 4, Maceió: COTEDI, p. 726–735 (in Portuguese).
- Kinzie, 1973 P.A. Kinzie; Thermocouple Temperature Measurement; John Wiley & Sons, Inc., New York (1973), p. 288
- Ministry of Agriculture and Agrarian Reform, 1992 Ministry of Agriculture and Agrarian Reform, 1992. Climatological Normals (1961–1990) (in Portuguese).
- Monteiro, 1969 C.A.F. Monteiro; The Atlantic Polar Front and Winter Rainfall in Brazil׳s South-Eastern Facade: Methodological Contribution to Rhythmic Analysis of the Types of Weather in Brazil; Geography Institute – USP, Sao Paulo (1969), p. 68 (in Portuguese)
- Monteiro, 1973 C.A.F. Monteiro; Climate Dynamics and Rainfall at Sao Paulo State: Geographical Study as an Atlas; Geography Institute – USP, Sao Paulo (1973) (in Portuguese)
- Olgyay, 1998 V. Olgyay; Architecture and climate: bioclimatic design manual for architects and planners; Gustavo Gili S.A., Barcelona (1998), p. 203 (in Spanish)
- Silva and Vecchia, Silva, A.C., Vecchia, F.A.S., 2003. Climate and thermal performance of dwellings in San Antonio de Los Baños, Cuba. In: Proceedings of the National Meeting About Comfort on Built Environment, 7; Proceedings of the Latin American Conference on Comfort and Energy Performance of Buildings, 2, Curitiba: COTEDI, vol. 1, p. 401–408 (in Portuguese).
- Vecchia, 1997 F.A.S. Vecchia; Climate and the built environment: a dynamic approach applied to human comfort. 329f. (Ph.D. thesis); Faculty of Philosophy, Languages and Literature, and Human Sciences, University of Sao Paulo, Sao Paulo (1997)
Document information
Published on 12/05/17
Submitted on 12/05/17
Licence: Other
Share this document
Keywords
claim authorship
Are you one of the authors of this document?
