Abstract
This paper uses Lorenz curve and Gini index with adjustment to per capita historical cumulative emission to construct carbon Gini index to measure inequality in climate change area. The analysis shows that 70% of carbon space in the atmosphere has been used for unequal distribution, which is almost the same as that of incomes in a country with the biggest gap between the rich and the poor in the world. The carbon equity should be an urgency and priority in the climate agenda. Carbon Gini index established in this paper can be used to measure inequality in the distribution of carbon space and provide a quantified indicator for measurement of carbon equity among different proposals.
Keywords
climate change ; carbon equity ; long-term mitigation goal ; cumulative emission per capita ; carbon Gini index
1. Introduction
One of the key issues of addressing climate change is to enact a reasonable global long term emission reduction target and implement the equal allocation of CO2 emission space. The quantitative global long term target will certainly limit the global CO2 emission space. The unequal allocation of the limited CO2 emission space would largely restrict the future emission space of developing counties. The earth’s atmosphere is human’s public natural resource, and reasonable emission space is indispensable for human development. Therefore, we should allocate and use the emission space under the principle of global carbon equality. This is the cornerstone of global cooperation in addressing climate change.
Chinese scholars [ Chen et al., 2005 ; Ding et al., 2009 ; He et al., 2007 ; 2009 ] developed the cumulative CO2 emission per capita index and revealed the different historical responsibilities for developed and developing countries. Moreover, they proposed the guideline based on the principle of cumulative emission per capita convergence. Under this principle, Chinese scholars proposed the carbon budget and carbon emission account methods [ Pan, 2008 ; PTDRCSCC, 2009 ] as the emission space allocation system design. Although cumulative emission per capita reveals the different historical responsibilities for different countries, it cannot provide a comprehensive index which covers every country’s cumulative emission per capita, nor can it provide a general measurement of emission space allocation equality. Therefore, many studies used income equality measurement method, and measured emission equality with different income equality index. Hedenus and Azar [2005] measured emission inequality across countries by the well-known Atkinson index. Duro and Padilla [2006] applied the decomposable Theil index of inequality to emissions and showed convincingly that global inequality in per capita emissions was largely due to inequalities in per capita income across countries. Heil and Wodon [1997 ; 2000 ] used the Gini index to measure the inequality of emission across countries. Groot [2010] established the carbon Lorenz curves and carbon Gini coefficient based on the annual per capita emission. The aforementioned literatures measured the emission space equality with income equality measurement indices, but they were all based on the annual per capita emission. The contribution of this paper is to reestablish the carbon Lorenz curves and Gini indices based on the historical cumulative emission per capita which has essential difference with the annual per capita emission measurement. First, the life time of greenhouse gas (GHG) in the atmosphere is more than a century; the cumulative emission can show a country’s climate change historical responsibility more clearly than annual emission. Consequently the historical cumulative emission per capita can represent the carbon equality better. Second, emissions of GHG within a certain period of time determine the temperature rise. The equality is to be a measurement of the overall emission allocation in the certain period, rather than that of annual emission allocation.
2. Carbon equality and measurement
The essence of carbon equality is to measure the allocation difference of emission space. Although allocation difference is a new topic in climate change studies, it has been thoroughly investigated in the income allocation equality researches [ Wan, 2009 and Xu, 2008 ]. The commonly used resident income allocation difference indices are variation coefficient, Gini coefficient, Generalized Entropy index, and Atkinson index. The Gini coefficient is the most widely used index. Such indices are usually used to statically mapping the wealth allocation and social stability of a certain country or district.
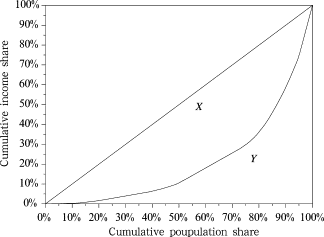
The Lorenz curve was initially proposed by Lorenz in 1907. It indicates the relations between population shares and income shares. Cumulative income shares are on the vertical axis, and cumulative population shares are on the horizontal axis. The curve reflects the relations between income shares and population shares. If the population shares are not equal to the income shares, inequality exists. If the allocation is perfectly equal, then Lorenz curve is the straight line with the slope of 45°. That is the “perfect equal allocation curve” (Fig. 1 ). Based on the Lorenz curve, Gini proposed the equality level measurement index which is called Gini index. Define the area between the actual allocation curve and perfect equal allocation curve as X , the area below the actual allocation curve asY . Then the Gini index equals to X /(X + Y ). The economical meaning of Gini index is that the inequality level of the income allocation equals to the income used for unequal allocation among total residential income. Gini index is a real number between 0 and 1. The Gini index for a perfect equal allocation is 0, while the Gini index for a totally unequal allocation is 1. Gini index is a general index, which reveals a general level of the allocation equality. According to the United Nation’s definition, Gini index < 0.2 represents perfect income equality, 0.2–0.3 relative equality, 0.3–0.4 adequate equality, 0.4–0.5 big income gap, and above 0.5 represents severe income gap. Therefore, the warning level of Gini index is 0.4. This paper uses the above division of Gini index to investigate the carbon inequality issue. How to use Gini index to provide a more meaningful division is still an issue for further research, since this involves the welfare meanings of the carbon space allocation.
|
|
|
Figure 1. Lorenz curve and Gini index |
Lorenz curve and Gini index reflect the relations between income shares and population shares. Whenever the income shares and population shares are not equal to each other, inequality exists. The convergence of cumulative per capita proposed by Chinese scholars reflects this principle for equality. This idea applied with the Lorenz curve and Gini index means that once everyone has the same cumulative emission space there will be no carbon inequality.
Developed countries had emitted large amount of GHG in their industrialization process. The GHG cumulated in the atmosphere, not only enhanced the greenhouse effect, but also led to global warming and many other climate changes. Moreover, GHG emitted by developed countries occupied the emission space and made developing countries face a more restricted emission limit. Therefore, Gini index can also measure equality situation of different emission allocation plans. In this application of the Lorenz curve and Gini index, horizontal axis is changed from households to population, while vertical axis is changed from income to emissions. This paper calculates the carbon equality with historical cumulative emission statistics. Based on such statistics we will establish the “carbon Lorenz curve” to reflect different countries’ unequal emission allocation levels. According to “carbon Lorenz curve”, we can calculate the “carbon Gini index” to quantitatively measure the emission inequality of different countries.
3. Carbon Lorenz curve and carbon Gini index calculation
When investigating different countries’ historical cumulative emission situation, this paper focuses on the CO2 emission from energy activities. Baumert et al. [2005] suggested that CO2 is the main GHG, CO2 emission from energy activities contribute more than 2/3 of the world GHG total. This paper calculates the historical cumulative emissions by simply adding the emissions, which is a widely used method.
In order to understand how the historical cumulative emission per capita Lorenz curve is established, first we define the following variables for country n : Gin is the CO2 emission in i th year of country n , Pin is the population of country n in the i th year, is the population share of country n in the i th year.
Considering the period between i th year and j th year, is the historical cumulative CO2 emission from i th year to j th year for country n , is its share of historical cumulative CO2 emission from i th year to j th year, and is its historical cumulative CO2 emission per capita from i th year to j th year.
is the most important emission equality measurement index proposed by the authors of this paper. It will also be the basis to sort the data in establishing the Lorenz curve. There are two ways to calculate . One is to add up the annual emission per capita. Another is to calculate cumulative CO2 emission Cn , and then divide Cijn by Pjn . Although two methods yield different values, the results are essentially the same. Moreover, this paper will use population share. It is not suitable to calculate cumulative populations. Accordingly, we adopt the latter method.
|
|
( 1) |
Table 1 provides historical cumulative CO2 emission, population, and the historical cumulative emission per capita for major countries between 1850 and 2006. All the data were from Climate Analysis Indicators Tool (CAIT), Version 7.0 (http://cait.wri.org ). From Table 1 we can see that the USA is the world’s largest CO2 emission country since the industry revolution, its historical cumulative emission is 30% of the world total. The historical cumulative emission per capita for developed countries such as the USA and UK was more than tens of times of those for developing counties such as China and India. The historical cumulative emission per capita can reflect the inequality of carbon space allocation. Comparing with developed countries, developing countries’ industrialization came late and is on a lower level. Developing countries are allocated with less resource in the constrained carbon space, but they have larger populations in general. As a result, residents in developing countries cannot enjoy equal rights in GHG emission.
| Country | Historical cumulative CO2 emission (Mt) | Historical cumulative CO2 share (%) | Population in 2006 (103 ) | Population share (%) | Historical cumulative CO2 emission per capita (t per capita) | Annex I (Y/N) |
|---|---|---|---|---|---|---|
| UK | 68,235.8 | 5.96 | 60,226 | 0.94 | 1,133.0 | Y |
| USA | 333,747.8 | 29.14 | 296,507 | 4.60 | 1,125.6 | Y |
| Germany | 80,377.0 | 7.02 | 82,469 | 1.28 | 974.6 | Y |
| Russian Fed | 93,081.6 | 8.13 | 143,150 | 2.22 | 650.2 | Y |
| Australia | 12,715.8 | 1.11 | 20,400 | 0.32 | 623.3 | Y |
| France | 32,278.6 | 2.82 | 60,873 | 0.95 | 530.3 | Y |
| Japan | 44,535.2 | 3.89 | 127,773 | 1.98 | 348.5 | Y |
| South Africa | 12,793.0 | 1.12 | 46,892 | 0.73 | 272.8 | N |
| Mexico | 11,768.0 | 1.03 | 103,089 | 1.60 | 114.2 | N |
| China | 99,204.2 | 8.66 | 1,304,500 | 20.25 | 76.0 | N |
| Brazil | 9,457.5 | 0.83 | 186,831 | 2.90 | 50.6 | N |
| India | 27,433.6 | 2.40 | 1,094,583 | 16.99 | 25.1 | N |
(data source: CAIT V7.0)
When we focus on the CO2 emission from i th year to j th year for each country, in order to construct the Lorenz curve, we need to sort the countries in ascending order by their historical cumulative emissions per capita and assign a sequence number s . After sorting the countries in ascending order, set cumulative population of j th year on the horizontal axis, and set cumulative historical cumulative emission per capita from i th year to j th year on the vertical axis. It should be noted that “cumulative” in this context is referring to summing up of emissions by those countries whose sequence number is less than s. Therefore, the coordinates (ps , cs ) refer to .
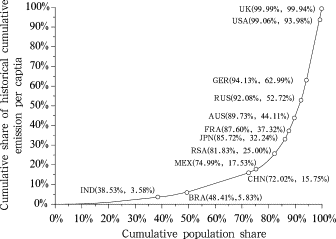
Connecting the different countries’ points in the coordinate system with a smooth curve, we established the Lorenz curve based on the historical cumulative emission per capita from i th year to j th year. Figure 2 shows the carbon Lorenz curve started from 1850 and lists the positions of different countries. As the carbon Lorenz curve is sorted by the historical cumulative emission per capita, the country’s position is closer to the upright, the higher its historical cumulative emission per capita is, the bigger historical responsibility that country should take in climate change issue. Moreover, from Figure 2 we can learn that developing countries have 82% population of the world, but they contributed merely 25% cumulative emission of world’s total. On the other hand, developed countries have 18% population of the world, but their cumulative emissions account for 75% of the world’s total.
|
|
|
Figure 2. Carbon Lorenz curve using 1850 as starting year |
Based on the carbon Lorenz curve, we can calculate the carbon Gini index. Similar to the income Gini index calculation, we use two methods. One is the area method; the other is mean variance method.
The area method is derived straightly from the definition of Gini index. As mentioned before, since (X + Y)=0.5, we have
|
|
( 2) |
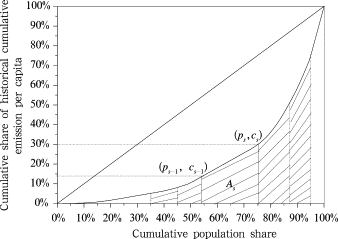
The main difference between various area calculation methods is in the calculation of area Y. One way is to select a suitable fitting Lorenz curve, and then use integration to calculate the area. Another way is to divide Y into several trapezoids. The sum of the trapezoidal area is a close approximation to the area Y (Fig. 3 ).
|
|
|
Figure 3. Carbon Gini index calculation using trapezoid method |
We assumed that there are S countries and we can divide the total area into S trapezoids.
|
|
( 3) |
Apparently, when S is big enough, the result above is almost the same as real value.
Another commonly used method is mean difference method. We define the absolute mean variance as , relative mean variance as , where a and b is the sequence number of two different countries, and is the historical cumulative world emission per capita. Gini index is the half of the relative mean variance. Therefore,
|
|
( 4) |
The covariance Eq. (5) in the following can be derived from Eq. (4) .
|
|
( 5) |
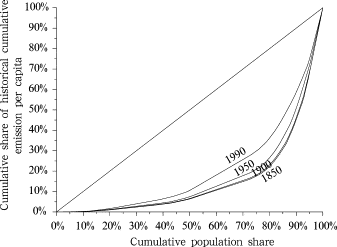
One of the most important things in carbon equality and carbon budget is to set the starting year. Many researches confirmed that the earlier the starting year was, the more historical responsibility is reflected. But they did not provide a quantitative analysis of the various starting years’ impacts on the historical responsibility. In this paper we try to use the carbon Lorenz and carbon Gini index to quantitatively analyze the impact of the starting year on historical responsibility. Figure 4 shows the carbon Lorenz curves with different starting years. Table 2 shows carbon Gini index results with different starting years in various calculation methods. We can see that different calculation methods do not affect the carbon Gini index value much, but the different starting years have big influence on the carbon Gini index value. The latter the starting year, the lower the carbon Gini index is. That means as the starting years become bigger, the carbon space allocation inequality would be concealed. On the global level, carbon Gini index does not change much when comparing the 1850 starting year calculation with the 1900 starting year calculation. But the 1950 starting year calculation and 1990 starting year calculation largely underestimate the carbon inequality. The 1950 calculation results in a 4% underestimation of the carbon space allocation inequality, while the 1990 calculation accounts for a 14% underestimation of the carbon space allocation inequality. From 1850 to 2006, 70% of the cumulative emission space has been allocated unequally, but when starting from 1990 this figure decreases to 60%. No matter what the starting year is, the inequality of carbon space allocation needs to be concerned. According to the World Bank statistics, three countries’ income Gini indices are above 0.6 in the 182 countries in the world. The biggest income gap is in Namibia which has the income Gini index of 0.74. The Gini index of carbon space allocation is 0.70 if the starting year is 1850. Even if 1990 is used as the starting year, the carbon Gini index can still reach 0.60 which is on the same level as countries with the largest income gaps.
|
|
|
Figure 4. Carbon Lorenz curve by using different starting years |
| Calculation method | 1850–2006 | 1900–2006 | 1950–2006 | 1990–2006 |
|---|---|---|---|---|
| Fitting method | 0.70 | 0.70 | 0.67 | 0.60 |
| Trapezoid area method | 0.70 | 0.69 | 0.66 | 0.59 |
| Gini mean difference method | 0.70 | 0.69 | 0.66 | 0.59 |
| Covariance method | 0.70 | 0.69 | 0.66 | 0.59 |
4. Conclusions
Economics and sociology are focused more on the inequality in terms of economical parameters, especially the income inequality, since income is a key factor which determines the welfare. In the field of climate change, the unequal allocation of carbon emission space is an issue of great importance, but the study of the measure of this inequality is rather limited in both theory and application. The quantification of the carbon allocation inequality has great significance. Through the quantification, we can investigate an inequality issue in climate change from a different angle or underlying layer. For example, measuring the inequality level and trends will be beneficial to look for the root cause of the inequality. The income allocation related literatures have provided many meaningful indices and tools for inequality research. With some adjustment, such indices and tools can be applied to the emission space allocation related carbon inequality issue. In this paper, based on the historical cumulative emission per capita, the authors established the carbon Lorenz curve and carbon Gini index to quantitatively analyze the emission space allocation inequality issue.
Several implications of the historical cumulative emission per capita based on carbon Gini index proposed by the authors in this paper are the following: 1) historical cumulative emission per capita based carbon Gini index reflects the severe inequality of current emission allocation in a more general way, it helps policy makers and the public to know the emission allocation inequality level; 2) carbon Gini index can not only be used to analyze the current situation of the emission space allocation inequality, but also can be employed to compare the emission space allocation inequality of different future allocation plans, thus it can reveal the equality ramification of different future emission allocation plans and provide guidelines in establishing future allocation plans; and 3) by using the carbon Gini index and carbon Lorenz curve, we can further understand the deep-seated factors in carbon inequality by factor decomposition.
The result of the carbon Gini index based on the historical cumulative emission per capita shows that current emission space allocation is severely unequal. The inequality situation is on the same level as a country with the biggest income gap. In the 1850–2006 calculation period, carbon Gini index reaches 0.70 which is far beyond the warning level in the case of income inequality. This result indicates that 70% of the world total emission space is allocated unequally and such space has been excessively occupied by developed countries. The carbon Gini index has confirmed that developed countries had excessively occupied the emission space. According to the principle of UNFCCC, developed countries should take the lead to reduce their emissions to redress the unequal situation.
The selection of starting year has great influence on the carbon Gini index. The inequality of carbon space allocation has been concealed as the starting year becomes more recent. However, even year 1990 is used as the starting year, the carbon Gini index can still reach 0.60 which is far beyond the warning line. Carbon Gini index can be used as a static index to measure the inequality of emission allocation. It also provides a quantitative index for international carbon equality discussion. At present, many institutes and scholars have proposed various plans to allocate future CO2 emission space. It is difficult to compare different plans. The carbon Gini index presented in this paper can reveal the equality implication of different allocation plans, and compare and contrast different plans in the light of the equality measurement.
Acknowledgements
The authors would like to thank National Basic Research Programme (No. 2010CB955303) for financial support of this research.
Received: 26 December 2010
References
- Baumert et al., 2005 K.A. Baumert, T. Herzog, J. Pershing; Navigating the numbers: Greenhouse gas data and international climate policy; World Resources Institute (2005), pp. 20–22
- Chen et al., 2005 W. Chen, Z. Wu, J. He; Two-convergence approach for future global carbon permit allocation; Journal of Tsinghua University (Science and Technology) (in Chinese), 45 (6) (2005), pp. 848–853
- Ding et al., 2009 Z. Ding, X. Duan, Q. Ge, et al.; Control of atmospheric CO2 concentration by 2050: An allocation on the emission rights of different countries ; Science in China Series D: Earch Scineces, 39 (8) (2009), pp. 1009–1027
- Duro and Padilla, 2006 J.A. Duro, E. Padilla; International inequalities in per capita CO2 emissions: A decomposition methodology by Kaya factors ; Energy Economics, 28 (2006), pp. 170–187
- Groot, 2010 L. Groot; Carbon Lorenz curve; Resource and Energy Economics, 32 (2010), pp. 45–64
- He et al., 2009 J. He, W. Chen, F. Teng, et al.; Long-term climate change mitigation target and carbon permit allocation; Adv. Clim. Change Res, 5 (2009), pp. S78–S85
- He et al., 2007 J. He, B. Liu, Y. Chen, et al.; Socio-economic assessment of climate change mitigation; China’s National Assessment Report on Climate Change (in Chinese), Editorial Committee of China’s National Assessment Report on Climate Change, Science Press (2007), pp. 313–415
- Hedenus and Azar, 2005 F. Hedenus, C. Azar; Estimates of trends in global income and resource inequalities; Ecological Economics (55) (2005), pp. 351–364
- Heil and Wodon, 1997 M.T. Heil, Q.T. Wodon; Inequality in CO2 emissions between poor and rich countries ; Journal of Environment and Development, 6 (1997), pp. 426–452
- Heil and Wodon, 2000 M.T. Heil, Q.T. Wodon; Future inequality in CO2 emissions and the impact of abatement proposals ; Environmental and Resource Economics, 17 (2000), pp. 163–181
- Pan, 2008 J. Pan; Carbon budget for basic needs satisfaction: Implications for international equity and sustainability; World Economics and Politics (in Chinese), 1 (2008), pp. 35–42
- PTDRCSCC (Project Team of Development Research Center of the State Council of China, 2009 PTDRCSCC (Project Team of Development Research Center of the State Council of China; Greenhouse gas emissions reduction: A theoretical framework and global solution; Economic Research Journal (in Chinese), 3 (3) (2009), pp. 1–13
- Wan, 2009 G. Wan; Inequality measurement and decomposition: A survey; China Economic Quarterly (in Chinese), 8 (1) (2009), pp. 347–367
- Xu, 2008 K. Xu; How has the literature on Gini’s index evolved in the past 80 years; China Economic Quaterly (in Chinese), 2 (4) (2008), pp. 757–777
Document information
Published on 15/05/17
Submitted on 15/05/17
Licence: Other
Share this document
Keywords
claim authorship
Are you one of the authors of this document?


