Abstract
Various techniques for creating a comfortable thermal environment and saving energy have been proposed and employed in residential buildings in many countries, including Japan. For these techniques to be introduced, existing houses should be renovated. Among the techniques available, installation of additional inner windows is effective in creating a comfortable and energy-efficient living environment. In the present research, the effect of additional inner windows on the thermal environment and energy saving was investigated by measuring indoor climates. Windows were renovated in two rooms on the fourth floor of a four-story reinforced concrete building. Air temperatures, the humidity, the global solar radiation on horizontal and vertical surfaces, radiant temperatures, and the electricity consumption of air-conditioners were measured. A comparison of these values before and after the installation of inner-windows showed that the thermal environment and energy saving had improved. Results obtained from a thermal model agreed well with measured results by changing the value of solar transmittance and heat transmission coefficient of the glazing following renovation. Furthermore, in a questionnaire survey conducted in summer, more than half of the occupants answered “comfortable” to a question on the overall thermal comfort.
Keywords
Double-skin windows ; Retrofitting windows ; Thermal environment ; Energy saving
1. Introduction
Various techniques for creating a comfortable living environment and saving energy have been proposed and employed in residential buildings. Among the available techniques, the installation of additional inner windows appears promising for creating a comfortable and energy-efficient living environment in existing houses. Since the outdoor temperature and solar radiation significantly influence the indoor thermal environment through openings, window renovation will improve the indoor climate and reduce the cooling and heating loads. As related research, Ismail and Henriquez (2005) investigated double-glazed windows with a ventilation system. Garvin and Wilson (1998) studied the influence of double-glazed windows on the indoor environment. Arici and Karabay (2010) attempted to determine the optimum thickness of double-glazed windows. Double-glazed windows were also investigated by Aydin (2006) , Gordont (1987) , and Carlos et al. (2011) . Hayatsu et al. (2009) and Sakamoto et al. (2009) reported the effectiveness of inner windows on the basis of measurements and a simulation. However, it is important to evaluate the effectiveness of the inner windows in various situations since their effectiveness depends on the airtightness, the lifestyle of the inhabitants, and many other factors.
In the present research, the effect of additional inner windows on the thermal environment and energy saving in both summer and winter was investigated by measuring differences in the indoor climates, electricity consumption, and the thermal sensation of the occupants before and after the installation of the inner windows.
2. Outline of measurements
2.1. Measured building
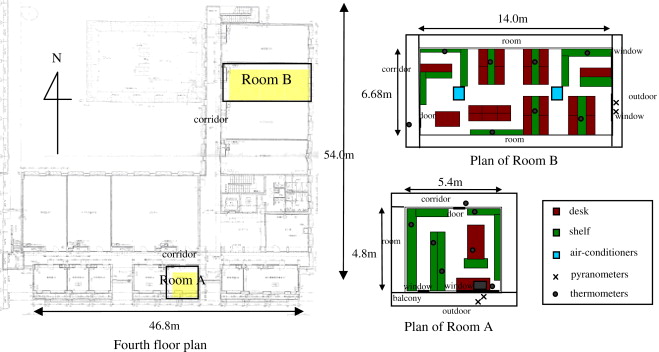
The windows were renovated in two rooms on the fourth floor of a four-story reinforced concrete building used for research and educational purposes. The windows in Room A (one user, EHP air-conditioner) face south, while those in Room B (15 users, 2 GHP air-conditioners) face east. The floor plans are shown in Fig. 1 , and the details of the windows are listed in Table 1 . The inner windows were installed on August 11, 2010, and removed on February 1, 2011. They were installed again on February 16, 2011. The effectiveness of the inner windows was examined in both summer and winter.
|
|
|
Fig. 1. Floor plans and location of measuring apparatus. |
| Room A | Steel sash and double-glazed windows (outer)+resinous sash and single glass (inner) |
| Room B | Steel sash and single glass (outer)+resinous sash and double-glazed windows (inner) |
2.2. Measured parameters and time period
The air temperature, humidity, solar radiation, radiation temperature, and energy consumption of air-conditioners were measured. The measuring points are shown in Fig. 1 . The thermometers were positioned on bookshelves at three different heights from the floor (10, 100, and 230 cm). The horizontal and vertical global solar radiations were measured outside the windows. The radiation temperature was measured several times during the measuring period. The measurements started one month before the installation of the inner windows.
3. Results for summer
3.1. Measured results
The measured results obtained before the installation of the inner windows (8/5/2010–8/11/2010) were compared with those obtained after the installation (8/12/2010–8/18/2010). The measurement periods were decided such that the climatic conditions before and after installation were similar. It can be said that the selected periods were appropriate for comparison because the climatic conditions were almost symmetric with respect to the installation day as a result, and the thermal inertial of the object rooms are about three days.
3.1.1. Air temperature
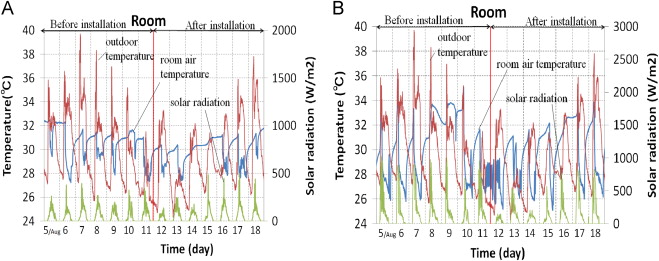
The air temperatures in Room A and Room B are shown in Fig. 2 , respectively; the outdoor temperature is also shown. The maximum, minimum, and average temperatures are listed in Table 2 . The maximum and average temperatures decreased by 0.3–1.3 °C, partly because of the inner windows and partly because of the decrease in the outdoor temperature by 0.2–1.9 °C.
|
|
|
Fig. 2. Air temperatures in Rooms A and B (8/5–8/18). |
| Maximum (°C) | Minimum (°C) | Average (°C) | ||
|---|---|---|---|---|
| Room A (outdoor) | Before installation | 32.3 (39.7) | 27.2 (24.7) | 30.54 (29.7) |
| After installation | 31.8 (37.8) | 27.4 (24.3) | 29.95 (29.5) | |
| Room B | Before installation | 35.1 | 25.3 | 30.1 |
| After installation | 33.8 | 25.2 | 29.8 | |
3.1.2. Thermograph of the windows
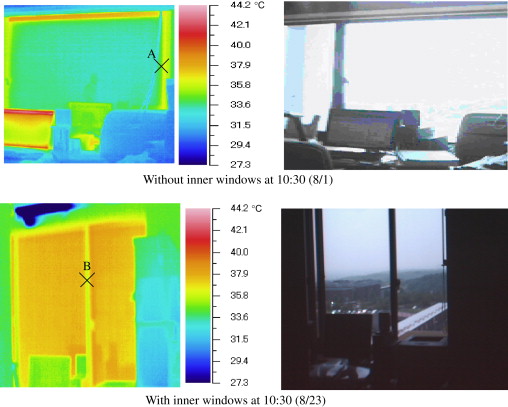
The thermograph measured around the windows in Room A is shown in Fig. 3 . The conditions before the renovation (8/1, 10:30) were as follows: air-conditioned from 9:00 (set point temperature of 18 °C), one person inhabiting the room, an outdoor temperature of 31.6 °C, room air temperature of 30.0 °C, and solar radiation of 182 [W/m2 ]. The radiant temperature of the sash (point A) was 38.0 °C.
|
|
|
Fig. 3. Measured thermograph around windows in Room A. |
The conditions after the renovation (8/23, 10:30) were as follows: air conditioned from 10:30 (set point temperature of 24 °C), no occupant in the room, outdoor temperature of 32.2 °C, room air temperature was not measured, and solar radiation of 495 [W/m2 ]. The radiant temperature of the inner sash (point B) was 36.1 °C.
It is difficult to compare the results before and after installation of the inner windows, but the radiant temperature of the inner sash was obviously lower than that of the steel sash. The radiant temperature of the glass is not evaluated because the reliability of the measurement seems not high.
3.1.3. Energy consumption of air-conditioners
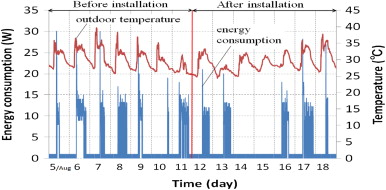
The energy consumption of the air-conditioner in Room A is shown in Fig. 4 . The maximum, average during operating time, and total energy consumptions are listed in Table 3 . The measurements were carried out every minute. The maximum energy consumption was approximately the same before and after installation. The average energy consumption slightly decreased after installation. This is partly attributed to the difference between outdoor temperatures before and after renovation. The total energy consumption was largely decreased after installation because of the occupation period was shorter.
|
|
|
Fig. 4. Energy consumption of air-conditioner in Room A. |
| Before installation | After installation | |
|---|---|---|
| Maximum | 30 W | 28 W |
| Average | 8.9 W | 7.8 W |
| Total | 24.5 kWh | 16.5 kWh |
3.2. Simulation of room air temperature
It is difficult to draw definitive conclusions from simple comparisons of room temperature, radiation temperature, etc., before and after the installation of the inner windows because the outdoor temperature and the operating period of the air-conditioners were different. In order to take the changes in external climate and air-conditioner use into consideration, a thermal model was developed to simulate the temperatures.
3.2.1. Simulation model
The room air temperatures were calculated, by taking into consideration the heat fluxes associated with solar radiation through the walls and windows, the internal heat, and the heat flow resulting from ventilation. The heat flow through the walls was regarded as one dimensional.
3.2.2. Calculation conditions
The measured values were used for the outdoor and corridor temperatures, while the air temperatures of the neighboring rooms were assumed to be the same as the calculated room air temperatures. The measured vertical solar radiation was used as the radiation to the windows, while the horizontal solar radiation was used as the radiation to the roof. The solar transmittance of the windows was calculated based on the formula proposed by Karlsson and Roos (2000) , and the heat transmission coefficient of the windows was calculated following ISO 9050 (2003) . The heat removed by the air-conditioners was calculated as the electricity consumption multiplied by the COP of the air-conditioners in Room A, while the heat removed from Room B, was estimated such that a good agreement with the measured results could be obtained, taking the operating period of the air-conditioners into consideration. The internal heat and physical properties used in the simulation are listed in Table 4 , Table 5 ; Table 6 .
| Personal computer | Measured |
|---|---|
| Lighting | 40 [W] (rated value) |
| Refrigerator | 100 [W] (rated value) |
| Human | 100 [W/person] |
| Specific heat [J/kg K] | Density [kg/m3 ] | Thermal conductivity [W/m K] | |
|---|---|---|---|
| Air | 1000.0 | 1.18 | – |
| Concrete | 1200.0 | 2300.0 | 1.51 |
| Gypsum board | 1130.0 | 780.0 | 0.154 |
| Rock wool | 840.0 | 200.0 | 0.038 |
| Steel | 462.0 | 7870.0 | 76.0 |
| Glass | – | – | 0.65 |
| Solar absorptance of concrete | 0.60 |
| Thermal resistivity of dead-air space | 0.18 [m2 K/W] |
| Thermal conductivity of glass | 0.65[W/m K] |
| Internal heat-transfer coefficient | 9.3 [W/m2 K] |
| Outside heat-transfer coefficient | 23.3 [W/m2 K] |
| Solar transmittance of blind | 0.70 |
3.2.3. Calculated results
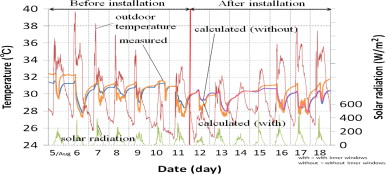
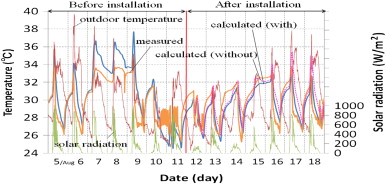
The calculated room air temperatures in Rooms A and B before and after the installation of the inner windows are shown in Fig. 5 ; Fig. 6 , along with the measured results.
|
|
|
Fig. 5. Measured and calculated temperatures of Room A. |
|
|
|
Fig. 6. Measured and calculated temperatures of Room B. |
The calculated room air temperatures agree well with the values measured before installation. However, the results after installation obtained by using the model agree with the measured results only after the value of the heat transmission coefficient of the glazing is decreased from 2.87 to 2.06 W/m2 K in Room A and from 4.62 to 2.96 W/m2 K in Room B. This means that the energy consumption and room temperatures were reduced by the installation of the inner windows.
The effect of the inner windows in Room A was smaller than that in Room B. This is because the windows in Room A were oriented to the south, and thus the angle of the solar incidence to the windows was high, which made the amount of the solar radiation less. Moreover, the double glazed windows were originally installed as the outer windows in Room A.
3.3. Questionnaire survey
A questionnaire survey on the indoor thermal environment was carried out with occupants (14 people). Questions on the following items were asked: thermal sensations corresponding to air temperature, humidity, air velocity, radiant temperature, solar radiation, clothing, use of additional equipments and overall thermal comfort.
With respect to the overall thermal comfort, 9 respondents answered “comfortable,” while 5 answered “no difference.” This result indicates the effectiveness of renovating windows. In particular, one respondent whose seat was located on the path of air flowing from the air-conditioner answered “very comfortable” because the intensity of the airflow decreased significantly after the installation of the inner windows. The air volume decrease caused by a reduction in the cooling load also shows the effectiveness of renovating windows.
4. Results for winter
4.1. Measured results
The measurements made before removing the inner windows (1/25/2011–1/31/2011) were compared with those made after removal (2/1/2011–2/7/2011). The measurement periods were decided so that the climatic conditions were similar both before and after the removal.
4.1.1. Air temperature
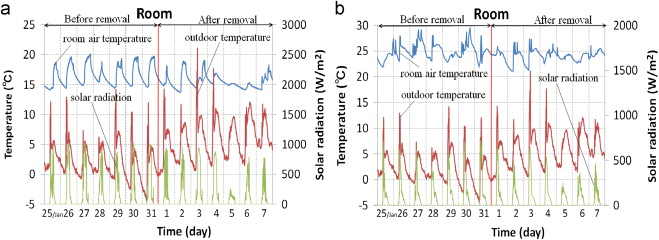
The room air temperatures in Rooms A and B, as well as the outdoor temperature, are shown in Fig. 7 . The maximum, minimum, and average temperatures are listed in Table 7 . The room air temperatures decreased after removal of the inner windows, because this caused a reduction in the thermal resistance.
|
|
|
Fig. 7. Air temperatures in Rooms A and B (1/25–2/7). |
| Maximum (°C) | Minimum (°C) | Average (°C) | ||
|---|---|---|---|---|
| Room A (outdoor) | Before removal | 20.1 (14.2) | 14.1 (−4.4) | 16.5 (2.2) |
| After removal | 19.0 (21.1) | 13.7 (−0.3) | 15.5 (5.9) | |
| Room B | Before removal | 29.5 | 21.9 | 24.9 |
| After removal | 27.4 | 21.0 | 24.0 | |
4.1.2. Thermograph of windows
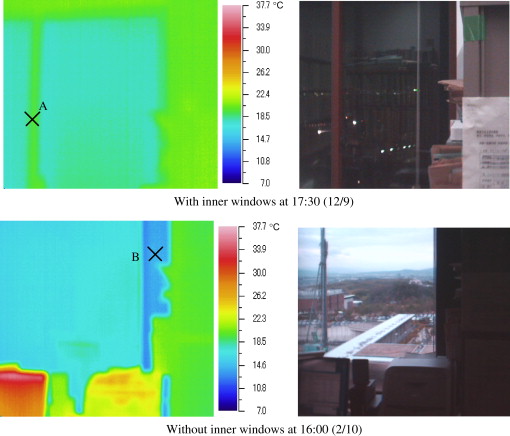
The thermograph measured around the windows in Room A is shown in Fig. 8 . The conditions before the removal of the windows (12/9, 17:30) were as follows: air-conditioning off, no occupant in the room, outdoor temperature of 5.8 °C, room air temperature of 19.1 °C, and solar radiation of 0 [W/m2 ]. The radiant temperature of the inner sash (point A) was 19.5 °C.
|
|
|
Fig. 8. Measured thermograph around windows in Room A. |
The conditions after the removal of the windows (2/10 16:00) were as follows: air-conditioning on (set point temperature of 30.0 °C), 1 person in the room, outdoor temperature of 4.0 °C, room air temperature of 18.2 °C, and solar radiation of 31 [W/m2 ]. The radiant temperature of the inner sash (point B) was 14.1 °C.
Although the outdoor temperature decreased by 1.8 °C after the removal of the inner windows, the radiant temperature of the sash decreased by 5.4 °C. Therefore the effect of the inner windows is apparent.
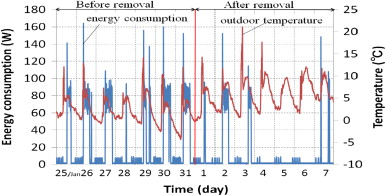
4.1.3. Energy consumption of air-conditioners
The energy consumption of the air-conditioner in Room A is shown in Fig. 9 . The maximum, average during operating time, and total energy consumptions are listed in Table 8 , measured at time intervals of ten minutes. The maximum and average energy consumptions changed slightly. However, this is partly attributed to the difference in outdoor temperatures between before and after renovation. It also can be said that the decrease in the room air temperature is partly caused by the decrease in the energy consumption. Therefore, the reason for decrease in the room air temperature is not so clear. The total energy consumption decreased mainly because of the shorter occupation after renovation.
|
|
|
Fig. 9. Energy consumption of air-conditioner in Room A. |
| Before removal | After removal | |
|---|---|---|
| Maximum | 162 W | 149 W |
| Average | 84.0 W | 80.8 W |
| Total | 24.0 kWh | 8.5 kWh |
4.2. Simulation of room air temperature
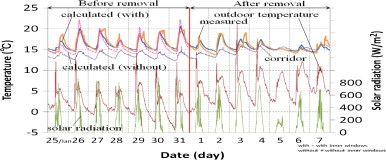
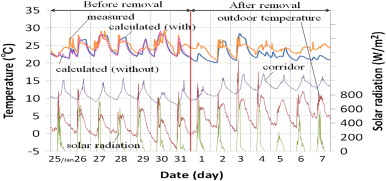
The room air temperatures were calculated using the same model as that used in summer. The air temperatures of the neighboring rooms were assumed to remain constant at 15 °C. The calculated room air temperatures in Rooms A and B before and after the removal of the inner windows are shown in Fig. 10 ; Fig. 11 ; the measured results are also presented.
|
|
|
Fig. 10. Measured and calculated temperatures in Room A. |
|
|
|
Fig. 11. Measured and calculated temperatures in Room B. |
The calculated room air temperatures agree well with measured results. However, in the cases before removal, results obtained from this model agree with the measured results only when the value of the heat transmission coefficient of the glazing is decreased from 2.87 to 2.06 W/m2 K for Room A and from 4.62 to 2.06 W/m2 K for Room B, which are the same changes as in summer. This means that the inner windows increased the overall thermal resistance of each window.
Contrary to the summer, the effect of the inner windows in Room A was larger than that in Room B because the angle of solar incidence to the windows was low.
4.3. Questionnaire survey
A questionnaire survey was carried out with the 15 occupants regarding the indoor thermal environment. The questions were almost the same as those asked for summer.
With respect to the overall thermal comfort, 5 respondents answered “comfortable,” 8 answered “no difference,” and 2 respondents answered “uncomfortable” after removing the inner windows. All the 5 respondents answering “comfortable” were occupants of Room B.
Some people answered “comfortable”, but two respondents whose seats were located near the windows answered “uncomfortable.” Therefore, it can be said that thermal insulation of the inner windows improved the thermal environment.
5. Discussion
5.1. Improvement of simulation
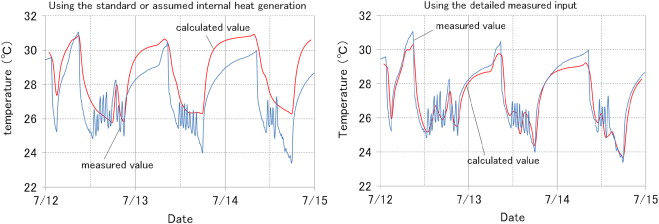
The proposed model gives satisfactory results on the whole, but not negligible difference with the measured values can be seen. In order to clarify the reason for this difference, the room air temperature in Room B was calculated for different time period, along with the simultaneous detailed measurement of the internal heat generation. The energy consumption by the air-conditioners and other internal heat sources were measured at 30 min intervals.
The calculated result using the standard or assumed internal heat generation is compared with calculated result using the measured heat generation in Fig. 12 . By taking into consideration the detailed measured input, a better agreement could be obtained between the measured and calculated room air temperatures. In particular, this clarified that the increase in the room air temperature at night when using the rated or assumed inputs was caused by the assumed too large internal heat.
|
|
|
Fig. 12. Measured and calculated room air temperature using measured (right) and standard or assumed (left) heat generation. |
Details of the measurements are given in the Appendix A1 .
5.2. Questionnaire survey in winter
In the questionnaire survey in winter, two respondents answered “uncomfortable” for a question on the comfort level after the removal of the inner windows. They were seated near the windows (see Fig. 13 ), and this low comfort level is considered to be caused by a cold draft falling down the windows.
|
|
|
Fig. 13. Respondents' positions. |
To the contrary, five respondents answered “comfortable,” which was an unexpected result. The set point temperature of the air-conditioners in Room B was the same as those before the removal, the resulting room air temperature was 29.5 °C before removal, and 27.4 °C after removal. Since the maximum room air temperature was changed towards comfortable zone.
6. Conclusion
In order to investigate the effectiveness of inner windows in reducing energy consumption and improving the thermal environment, windows were renovated in rooms on the fourth floor of a four-story reinforced concrete building.
The room air temperatures were slightly decreased upon installing inner windows in summer, but it was difficult to evaluate their effectiveness, since the outdoor temperature and the operating period of the air-conditioners were different before and after installation. In order to clarify the effectiveness of the inner windows, a thermal model was developed to calculate the room air temperature and energy use. The results obtained from this model agreed fairy well with the measured results by decreasing the value of heat transmission coefficient of the glazing. This indicates that the energy consumption and the room air temperatures decreased because the inner windows prevented solar radiation and heat flow from the outside. Furthermore, a questionnaire survey was carried out in order to examine the subjective evaluation of occupants. Judging from their response, the thermal environment was improved after the installation of the inner windows, with over half of the respondents answering “comfortable” to a question on the overall thermal comfort.
In winter, the room air temperatures decreased upon removing the inner windows. The results obtained by using the same model agreed well with the measured results. The questionnaire survey also showed the improvement of the thermal environment by the installation of the inner windows.
Overall, the installation of the inner windows improved the thermal environment, both in summer and winter.
Appendix A1. Objective
In calculations carried out for 2010, the number of occupants in the room and the heat input by the air-conditioners (the main sources of the internal heat) were partly estimated by using standard or rated values. Thus, Room B users were asked to record their actions and the times of switching on/off the air-conditioners were predetermined this time, although the surveyed period was short. By this measurement, more detailed data were collected and used for validating the proposed thermal model.
The electric current of the distribution board for the air-conditioners was measured because the energy consumption of the air-conditioners in Room B could not be measured directly. By making use of the relationship between the operation mode of the air-conditioners and the electric current of the distribution board (see Section A3 ), the supplied heat can be determined from the electric current of the distribution board.
A2. Outline of measurements
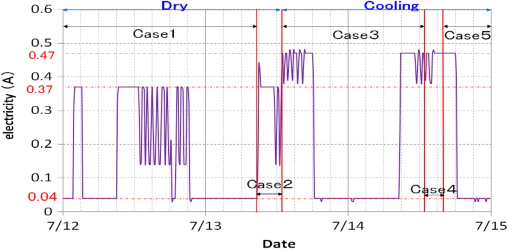
The measurement was carried out from 7/12/2011 (0:00) to 7/14/2011 (23:50). The occupants of the room recorded the information on their presence in the room and the use of the personal computers. The operation mode of the air-conditioners is listed in Table A1 . The air-flow direction was fixed to be horizontal.
| Case | Date | Starting time | Mode | Set point (°C) | Air velocity |
|---|---|---|---|---|---|
| Case 1 | 7/12 | 0:00 | Dry | 29 | Low |
| Case 2 | 7/13 | 8:50 | Dry | 29 | High |
| Case 3 | 7/13 | 13:00 | Cooling | 29 | High |
| Case 4 | 7/14 | 13:00 | Cooling | 28 | High |
| Case 5 | 7/14 | 16:00 | Cooling | 29 | Low |
A3. The relationship between electric current of distribution board and operation mode of air-conditioners
The measured electric current of the distribution board is shown in Fig. A1 . The electric current was 0.04 A when the air-conditioners were turned off, increasing very rapidly when the air-conditioners were switched on. The value changed very frequently when the air-conditioners being switched on/off. The peak value of the electric current changed with the operation mode. Comparison of Case 1 with Case 2, and Case 4 with Case 5 indicates that the air velocity had little influence on the electric current. Additional comparisons between Case 3 and Case 4, and Case 4 and Case 5 showed that a change in the set point by 1 °C had only a slight effect on the current. Furthermore, when Case 2 is compared to Case 3, it is evident that the electric current in the case of a cooling operation is higher than that for a drying operation.
|
|
|
Fig. A1. Electric current of the distribution board. |
Based on this result, Table A2 shows an estimated relationship between the operation mode of the air-conditioners and electric current of the distribution board. The amount of heat removed was estimated so that agreement with the measured results could be obtained.
| 2010 simulation | Present analysis | |
|---|---|---|
| Heat removed by air-conditioners | 0 W (Electric current<0.04 A) | 0 W (Electric current<0.04 A) |
| 8000 W (Electric current>0.04 A) | 3000 W (0.04<Electric current<0.37 A) | |
| 7000 W (Electric current=0.37 A) | ||
| 7100 W (0.37<Electric current<0.47 A) | ||
| 7500 W (Electric current≥0.47 A) |
A4. Heat generation by PCs and human body
Table A3 shows the internal heat generation by a personal computer and a human body, used for the year of 2010 and the present calculation. When some users were in the room, PCs were on. When there was no one in the room, PCs were off. However in the 2010 simulation, it was assumed that 8 PCs were on, even when no one was in the room, taking into consideration the PCs used for calculation(a) .
| 2010 simulation | Present analysis (W) | |
|---|---|---|
| PC (on) | 190 W | 120 |
| PC (off) | (a) | 15 |
| Human | 100 W | 100 |
A5. Calculation for room air temperature
The schedule of the internal heat generation was decided on the basis of the questionnaire survey, and the operation mode of the air-conditioners was determined based on the measured electricity current. The average of the measured energy consumptions of PCs was used.
References
- Aydin, 2006 Orhan Aydin; Conjugate heat transfer analysis of double pane windows; Building and Environment, 41 (2006), pp. 109–116
- Arici and Karabay, 2010 Muslum Arici, Hansan Karabay; Determination of optimum thickness of double-glazed windows for the climatic regions of Turkey; Energy and Buildings, 42 (2010), pp. 1773–1778
- Carlos et al., 2011 Jorge S. Carlos, Helena Corvacho, Pedro D. Sliva, J.P. Castro-Gomes; Modelling and simulation of a ventilated double window; Applied Thermal Engineering, 31 (2011), pp. 93–102
- Garvin and Wilson, 1998 Stephen L. Garvin, John Wilson; Environmental conditions in window frames with double-glazing units; Constructions and Building Materials, 12 (1998), pp. 289–302
- Gordont, 1987 J.M. Gordont; Low heat loss double-glazed windows; Energy, 12 (12) (1987), pp. 1333–1336
- Hayatsu et al., 2009 Hayatsu, O., et al., 2009. Study on Practical Renovations Regarding Energy Conservation for Apartment House (Part 1), (Part 2), Summaries of Technical Papers of Annual Meeting, Architectural Institute of Japan, pp. 43–46 (in Japanese).
- Ismail and Henriquez, 2005 K.A.R. Ismail, J.R. Henriquez; Two-dimensional model for the double glass naturally ventilated window; International Journal of Heat and Mass Transfer, 48 (2005), pp. 461–475
- International Standard, 2003 International Standard: ISO 9050, 2003
- Karlsson and Roos, 2000 J. Karlsson, A. Roos; Modelling the angular behavior of the total solar energy transmittance of windows; Solar Energy, 69 (4) (2000), pp. 321–329
- Sakamoto et al., 2009 Sakamoto, Y., et al., 2009. Verification of Thermal Benefit Obtained by Retrofitting Windows in the Head Office Building of the UT (Part 1), (Part 2), Summaries of Technical Papers of Annual Meeting, Architectural Institute of Japan, pp. 209–212 (in Japanese).
Document information
Published on 12/05/17
Submitted on 12/05/17
Licence: Other
Share this document
Keywords
claim authorship
Are you one of the authors of this document?
