Abstract
The architecture of the Ouargla Ksar has long been recognized as an example of adaptation to harsh climate in the deep desert of Algeria. Over the last few decades, it has undergone some changes in its initial urban structure, due to accelerated and uncontrolled modern urbanization, that had negative implications and devaluation of its thermal characteristics. This article tries to understand the bioclimatic concept of adaptation of this Ksar and assess to what extent its morphological transformation has impacted its microclimatic conditions. This assessment is made through a comparative study between two different areas: one untransformed and the other transformed. A referential weather station situated in the suburbs was also exploited for consolidation of comparison. The investigation was undertaken using site measurements and observations.
Keywords
Ksar ; Traditional settlement ; Ouargla ; Desert ; Transformed ; Comfort
1. Introduction
The Sahara, from the Neolithic era, has always been an area of great change. Man has adapted and persisted through the centuries to guarantee its survival within the climatic constraints of southern Algeria. The climate has been the foremost environmental factor that influenced the evolution of vernacular settlements and building design. It is well known that southern Algeria is one of the most arid lands of the world. The prevailing outdoor environmental conditions that influence inhabitants comfort are mainly of four types: high temperatures and intense solar radiation; high glare from direct and reflected sunlight; dust storms, mainly in the afternoons; in some regions with cold winters, cold winds in the winter season; low annual rainfall, torrential rain causing severe floods. In general the south of Algeria has a typical desert climate with variations between seasons and between day and night temperatures. The climate is hot and dry during the summer with cold nights and mild days during the winter. The rainfall occurs mainly in winter (few days per year) and the relative humidity is low especially during the summer. Wind is the main factor for the desert topography. Sandstorms occur during certain times of the year, usually in March and April. Regarding the Sirocco, it occurs at an average of 10 days/year during the period from May to September months. Protection against the devastating effects of wind on the inhabitants has become a major problem to deal with. The use of screens and obstacles is one of responses. Under these harsh conditions and inhospitable surroundings the vernacular settlements survive using passive means to provide comfort of inhabitants as demonstrated by Bouchair and Dupagne (2003) and Bouchair (2004) . In addition to the use of climate responsive buildings, people adapt their behavior and activities to the diurnal or seasonal climate changes: the internal migration from one time of day to another, or from one season to another, between parts of the house or areas that provide more comfortable indoor conditions.
The basic factors influencing thermal comfort are the surrounding air temperature, radiant temperatures of the surrounding surfaces, humidity of the air, and air movement. In order to illustrate how thermal interactions affect human comfort, the explanation below describes the body temperature control mechanisms and how environmental conditions affect them. For example, when we are uncomfortably hot in the direct light of the sun, we can cut off the radiant energy coming directly from the sun by stepping into the shade of a tree. Since air is a poor absorber of radiant heat, nearly all radiant exchanges are with solid surfaces to which we are exposed. Radiant heat may travel toward or away from a human body, depending on whether the radiating temperatures of surrounding surfaces are higher or lower than the bodys temperature. In a cold room, the warmer body or its clothing transmits radiant heat to all cooler surfaces such as walls, glass, and other construction within view. If there is a cold window in sight, it will typically have the largest impact in terms of draining heat away and making the body feel colder. By closing the drapes, a person can block the radiant transfer in the same way that a person can cut off the radiant energy from the sun by stepping into the shade of a tree. The rate of radiant transfer depends on the temperature differential, the thermal absorptivity of the surfaces, and the distance between the surfaces. The body gains or loses heat by radiation according to the difference between the body surface temperature and the MRT of the surrounding surfaces. The mean radiant temperature (MRT) is a weighted average of the temperatures of all the surfaces in direct line of sight of the body. If the MRT is below the body temperature, the radiant heat is a positive number, and the body is losing radiant heat. If the MRT is above the body temperature, radiant heat is negative, and the body is gaining radiant heat.
It should be kept in mind that the body loses radiant heat according to its surface temperature. For a comfortable, normally dressed adult, the weighted average temperature of the bare skin and clothed surfaces is about 27 °C. In still air at a temperature near skin temperature, radiant exchange is the principal form of heat exchange between the body and its environment. The MRT affects the rate of radiant heat loss from the body. Since the surrounding surface temperatures may vary widely, the MRT is a weighted average of all radiating surface temperatures within line of sight. It can be calculated as follows: MRT=∑(Tθ )/360, where T is the surface temperature and θ the surface exposure angle (relative to occupant) in degrees.
The thermal effect of humidity on the comfort of sedentary persons is small, that is, comfort is maintained over a wide range of humidity conditions. In winter, the body feels no discomfort over a range of relative humidity (RH) from 50% down to 20%. In summer, the tolerance range extends even higher, up to 60% RH when the temperature is 24 °C; above that, the skin feels sweaty. Nevertheless, some types of industrial applications, such as textile manufacturing, optical lens grinding, and food storage, maintain an RH above 60% because of equipment, manufacturing processes, or product storage requirements. At the other extreme, certain pharmaceutical products, plywood cold pressing, and some other processes require an RH below 20%.
In hot dry climate in southern Algeria, compact settlements (known as Ksur, plural of Ksar) have evolved over time to make the best use of locally available materials and resources to provide comfortable shelter for populations inhabiting even the most extreme climates of the world with minimum energy consumption. The well known Ksur in the desert of Algeria are M'zab Ksur (Ghardaia, Melika, Beni Izgen, Bounoura and El Atteuf), the Ksar of Ouargla city, the Ksur of Djanet city (El-Mihan, Azelouaz and Adjahil) located in the Wilaya of Illizi and the Ksar of Knadsa in the wilaya of Bechar (Bouchair, 2013 ). These settlements were adapted to give shelter for privacy and for thermal comfort (Bouchair and Dupagne, 2003 ). Privacy includes cultural, social, psychological and religious elements. For thermal comfort, the building must act as a barrier, transforming the outdoor climate to conditions suitable for indoor activities. Numerous studies have been conducted on this topic and several have recognized lessons from the past and demonstrated the usefulness of passive tools in achieving thermal comfort of inhabitants such as wind towers (Bahadori, 1985 ), storage of coolness in adobe walls (Bahadori, 1985 ) and solar chimneys (Bouchair, 1994 ).
Unfortunately, modern urban transformations and development have overturned the microclimatic conditions of the settlements because they are not adapted to climatic constraints and have, consequently, mitigated the well being and thermal comfort of inhabitants. This is mainly due to the use of industrialized non-adapted material with low thermal inertia, low albedo, and the use of wide streets and open spaces. An in depth study was made by Boukhabla et al. (2012) to show the effect of urban morphology on urban heat island in the city of Biskra in southern Algeria where the negative implications of unplanned modern urban transformation upon the warming up of the city were shown.
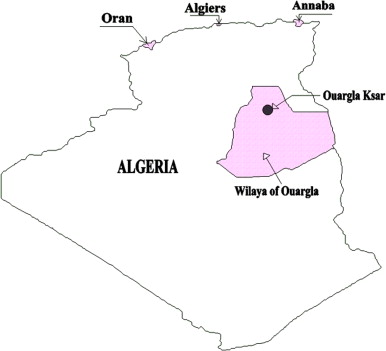
This study concerns the city of Ouargla located in the south-east of Algeria. It is one of the Saharan cities which are characterized by hot and dry climate. Ouargla is a true capital of the desert, located at 190 km east of the city of Ghardaia, 388 km south of the city of Biskra and 160 km south-east of the city of Touggourt. It is located between 28° and 32° north latitude and the meridians 4° and 8° East (Figure 1 ). The hot desert or arid zone is characterized by high mean annual temperatures and low mean annual precipitation. The city of Ouargla is characterized by long periods of overheating and thermal discomfort is felt strongly. The climate of Ouargla is one of the hardest of the North Eastern Sahara. The average annual temperature is 23.44 °C. The mean value of air temperature in July, the warmest month, is 35.7 °C and for January, the coldest month, is 11.6 °C (Table 1 ). The maximum temperature can exceed in certain cases 50 °C under shelter. The average annual rainfall is very low; it is 52.3 mm/year (Table 2 ). Sources of weather data can be obtained through national or regional meteorological stations (Meteorological station of Ouargla, Algeria).
|
|
|
Figure 1. Location of the wilaya of Ouargla, Algeria. |
| Month | Jan | Feb | Mar | Apr | May | Jun | Jul | Aug | Sep | Oct | Nov | Dec | Mean |
|---|---|---|---|---|---|---|---|---|---|---|---|---|---|
| Mean temperature (°C) | 11.6 | 13.7 | 17.8 | 22.5 | 29.9 | 32.1 | 35.7 | 33.1 | 30.8 | 24.9 | 16.9 | 12.3 | 23.44 |
| Month | Jan | Feb | Mar | Apr | May | Jun | Jul | Aug | Sep | Oct | Nov | Dec | Mean |
|---|---|---|---|---|---|---|---|---|---|---|---|---|---|
| Mean rainfall (mm) | 11.13 | 0.92 | 3.46 | 4.03 | 1.29 | 0.13 | 0.58 | 1.56 | 5.58 | 13.4 | 7.53 | 2.71 | 52.3 |
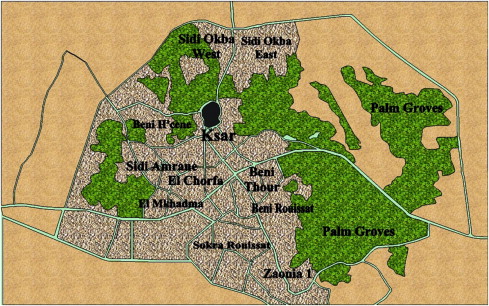
The city of Ourgla was originally a Ksar (traditional settlement) surrounded by a rampart provided with three gates each of which is oriented towards the tracks leading to the nearest cities such as Ghardaia, N'goussa and El-Golea. These three tracks influenced to a large extent the formation of the settlement around the old market. Figure 2 shows the general plan and location of this Ksar in relation to the whole city of Ouargla. It remains in the memory of inhabitants a cultural and spiritual sanctuary. It continues to play the true function of city center of Ouargla, and the new modern expansions become simple specialized districts or suburbs.
|
|
|
Figure 2. Location of the Ksar in the city of Ouargla. |
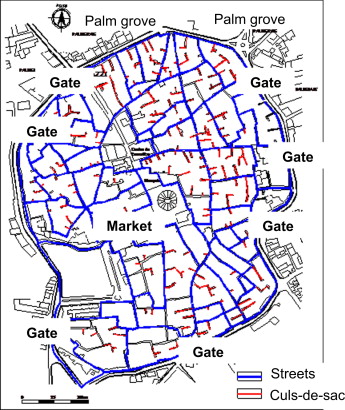
Traditional Ksar of Ouargla contains many features and qualities that merit study and examination. It meets the weather conditions by adapting to the physical environment and protecting against adverse climatic factors. This adaptation involves several levels: in the form of houses, the road system, the window size, and fabric building materials. Figure 3 shows the general layout of Ouargla Ksar with its seven gates. The house is built similarly as any desert typical traditional house, with an internal courtyard and terrace. Each house has a courtyard, which serves both family life and thermal control. The space of the house is organized in hierarchy, from public to private to insure human privacy. The bedroom is the last space to reach. Outside spaces such as roofs are designed to be used for sleeping at night during the summer.
|
|
|
Figure 3. Compact cellular layout of Ouargla Ksar. |
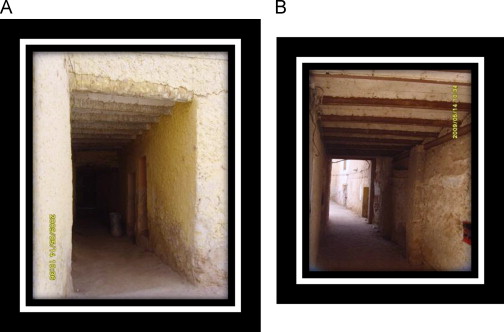
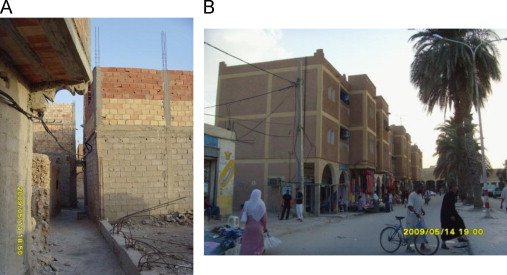
Cul-de-sac or dead end is a narrow street leading directly into few buildings. In addition to its role of insuring privacy and security of children, it is a space that offers shade to the facades most of the time. Figure 4 shows a typical cul-de-sac and a road covered by rooms to offer more shade in the untransformed area of the Ksar. These are also the only way to densify the settlement in the absence of free land for building.
|
|
|
Figure 4. (A) Typical cul-de-sac in the Ouargla Ksar and (B) typical covered passage of a street in Ouargla Ksar. |
Streets are narrow, irregular and generally covered to reduce direct exposure to sun and sandstorms.
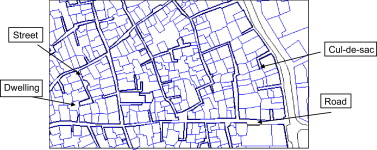
Hierarchic arrangement of external spaces is a main feature of building layout of this Ksar. Dwellings open generally into semi-private spaces or cul-de-sacs, which lead into streets as semi-public space and then public roads (Figure 5 ).
|
|
|
Figure 5. Typical tissue of Ouargla Ksar showing hierarchical arrangement of streets and their irregular form. |
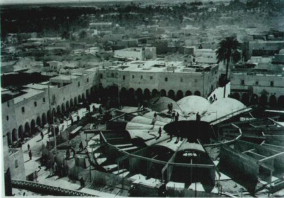
The Ksar has been in progressive decline due to the inappropriate modern transformation. Extensions were built of modern materials such as hollow bricks and prefabricated concrete blocks without considering negative thermal performance implications. Modern transformations introduced to the Ksar of Ouargla started during French occupation. The first breakthrough through the Ksar into the market place, currently known as Bohafs Ouakel road, was ordered by them. The main French district was built outside the Ksar beginning from 1927. This was an introduction of a new mode of space perception unknown to the inhabitants of Ouargla. Figure 6 shows a general view of the market place with the market concrete building integrated during French occupation without considering the environmental implications. Similarly, Figure 7 shows general views of integrated construction parts using modern materials (hollow prefabricated bricks and concrete blocks).
|
|
|
Figure 6. Market place occupying a large square with modern inadaptable building material. |
|
|
|
Figure 7. Modern transformations within the Ksar: (A) extension above street in the Ksar and (B) insertion of collective housing. |
In this study we will try to assess thermal qualities of both transformed and untransformed areas and understand the causes and implications of such transformation in order to give guidelines to avoid the urban decline in our traditional cities.
2. Material used for the investigation
2.1. Measuring instruments
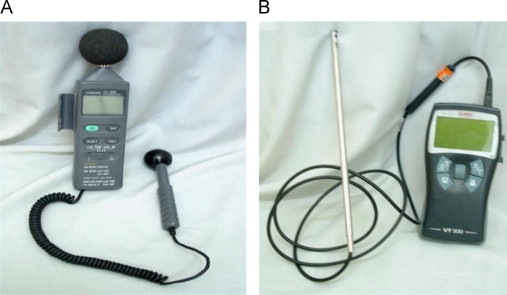
The measurement instruments used for this investigation were an Environment Meter Model 8820 and a hot wire anemometer (Figure 8 ). These are used to obtain direct measurements of predefined climatic factors. Photo camera, stopwatch and notebook are also used as complementary tools.
|
|
|
Figure 8. Measurement instruments: (A) environment meter 8820 and (B) hot-wire anemometer. |
2.1.1. The environment meter
This instrument acquires four parameters using different probes; in this study we used it to measure radiant temperature and relative humidity. The definition of the mean radiant temperature of an environment stipulates that is the uniform temperature of an imaginary black enclosure in which a person would exchange the same amount of heat by radiation than in its real non-uniform environment. The thermocouple of measurement is placed within a black painted enclosure. The relative humidity was measured using a humidity integrated sensor. This sensor measures up to 95% RH with a resolution of 0.1% RH.
2.1.2. The anemometer
This instrument is used to acquire the ambient air temperature and air velocity. It measures the air temperature from −20 °C to 80 °C and air velocity from 0 to 30 m/s.
3. Method used for the investigation
This study assesses quantitatively the impact of Ksar transformations upon its microclimatic urban parameters for the case of Ouargla. The work compares the results measured in two areas within the Ksar. The acquisition of the measurements was made on samples of traditional urban fabric. The measurements were taken through the chosen trajectories passing through selected locations. The measuring locations were selected on the basis of a typo-morphological study to be representative of the given area sample.
3.1. Purpose of the investigation
The purpose of the study aims at firstly verifying the conditions of urban microclimate in the traditional fabric of the original Ksar (untransformed area) and underlining the bioclimatic adaptation strategies to the hot and dry climate of the desert. Secondly, the assessment of the negative microclimatic impact on the urban Ksar, caused by the inappropriate transformations in the Ksar morphology and structure (transformed area).
Then, the comparison of the two situations will help us to understand the degree of discrepancies and variation between them.
The urban components used to perform this work are the streets, alleys, covered passages, cul-de-sac and squares. The thermal quality in these areas was assessed.
3.2. The chosen areas of intervention
The choice of the two trajectories is motivated by
- the diversity of the urban tissue between them (traditional and modern);
- the proximity of the two urban tissues which helps investigator to avoid time consuming during the measurements;
- the distinct characteristics of the physical structure (density built-up factor of the sky seen through the surface, albedo, etc.) of each of the urban tissues.
Differences existing between the two tissues showed us oppositions, which we refer to in selecting areas of measurement in order to be representative for all the tissues and to avoid duplication. Among these oppositions are traditional/planned, cement/clay, winding/straight, wide/narrow, open/closed, indoor/outdoor, sunny/shaded, compact/loose, etc.
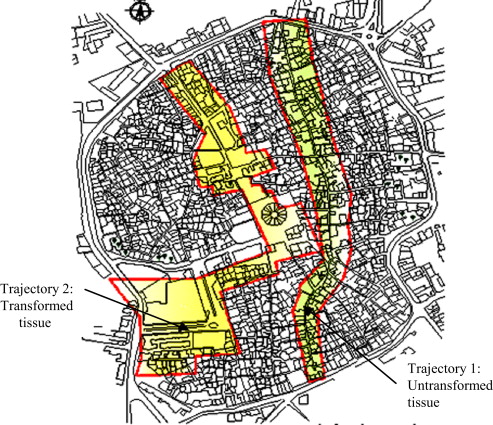
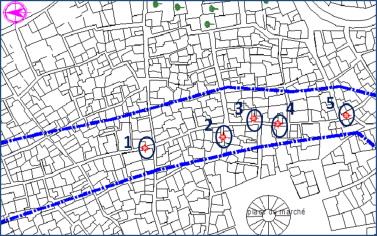
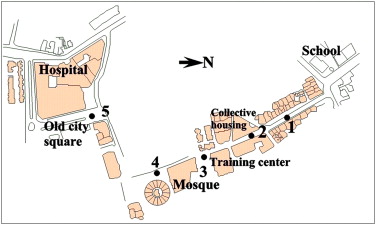
Figure 9 shows the locations of the two trajectories investigated. Figure 10 ; Figure 11 show the position of the measuring points.
|
|
|
Figure 9. Locations of the two trajectories investigated in the Ksar of Ouargla. |
|
|
|
Figure 10. Position of measuring points on trajectory 1. |
|
|
|
Figure 11. Position of measuring points on trajectory 2. |
3.3. Description of the implementation of measurement campaigns
Taking measurements at urban scale requires a prior determination of the period of data collection, schedules selected and the method of flow measurement campaigns.
A typical summer day is chosen to represent the harshest microclimatic conditions which cause thermal discomfort. It was a calm day with clear skies. Four thermal environment variables are measured and assessed; these are air temperature, radiant temperature, air speed and relative humidity.
The chosen moments are related to daily temperature regime: before sunrise: first heat gain; after the sunrise: early gain; at noon: when the sun is directly overhead; before the sunset: after a maximum accumulation of heat; after the sunset: beginning the dissipation of the stored heat. These moments are correspondingly 5 h, 9 h, 12 h, 17 h and 21 h.
We have chosen the 3rd of August 2009 to undergo the measurements with the agreement of the weather station. The calibration of all instruments, our instruments and those of the weather station, was checked for the measurement day. The tests were performed within two different tissues inside the Ksar of Ouagla. Five measuring points were selected in each tissue. Subsequently, we spent a day driving before the day of the experiment to determine the transition time between the measurement points and calculate sufficient time and persons to pass through all measurement points. So, three persons were mobilized to achieve quickly the tests.
The first campaign of measurements started at the first point of the second tissue (transformed tissue), and then the second, and the third, until the fifth point. This schedule is justified by the freedom of movement due to the absence of obstacles. The team went through the whole trajectory of action on foot. The estimated time between the first and last measurement did not exceed 15 min. The estimated time between the measurement points is varied from 3 to 5 min. The measurements were taken at a height of 1.60 m above the ground.
The second campaign of measurements started immediately after the end of the first campaign of measurements. The measurements in the second tissue (untransformed tissue) started with the fifth measurement point because of its proximity to the second trajectory so that we do not waste time. Then, we measured the remaining points until the first point of this trajectory. The total duration spent for the two measuring campaigns was of about 30–40 min.
4. Results
4.1. Variation of temperatures in the untransformed tissue (trajectory 1)
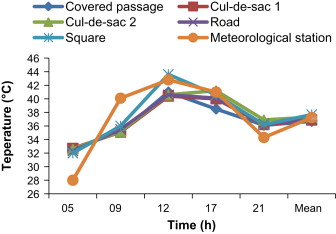
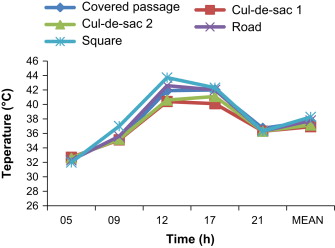
Figure 12 ; Figure 13 plot the variation of air and radiant temperatures measured in the trajectory 1 for traditional tissue and air temperature at the meteorological station of Ouargla during a typical summer day (the 3rd of August). It can be seen that the curve patterns for air temperature and radiant temperature in relation to meteorological station values are similar. It can be observed that the traditional tissue is cooler than the open site of meteorological station in the morning. In late afternoon till the evening, the contrary happens.
|
|
|
Figure 12. Variation of air temperature in trajectory 1 |
|
|
|
Figure 13. Variation of radiant temperature in trajectory 1. |
It can be noticed from Table 3 ; Table 4 that the square is hotter than the rest of the locations with a mean air temperature of 37.68 °C and mean radiant temperature of 38.26 °C. The highest values for both air temperature and radiant temperature throughout the day are also recorded in it at 12 h. They are 43.6 °C and 43.7 °C correspondingly. It can also be noticed that the mean air and radiant temperatures are merely the same for the two cul-de-sac. The mean radiant temperature, 37.56 °C, for the trajectory 1 is a little bit higher than the mean air temperature, 37.1 °C. During the daytime, from 9 h till 17 h, the air temperatures as a whole are less than those recorded in the meteorological station (open area), whereas they are a little bit higher at night, 5 h and 21 h (Table 3 ).
| Measurement points | Designation | Time of the day | Mean temperature | ||||
|---|---|---|---|---|---|---|---|
| 05 h | 09 h | 12 h | 17 h | 21 h | |||
| 1 | Covered passage | 32.7 | 35.1 | 41 | 38.5 | 36.1 | 36.68 |
| 2 | Cul-de-sac 1 | 32.7 | 35.1 | 40.4 | 40 | 36.2 | 36.88 |
| 3 | Cul-de-sac 2 | 32.6 | 35.2 | 40.6 | 41.2 | 36.9 | 37.3 |
| 4 | Road | 32.3 | 35.5 | 40.6 | 40.1 | 36.3 | 36.96 |
| 5 | Square | 32 | 36 | 43.6 | 40.6 | 36.2 | 37.68 |
| Mean | 32.46 | 35.38 | 41.24 | 40.08 | 36.34 | 37.1 | |
| Meteorological station | 28 | 40.1 | 42.8 | 41 | 34.3 | 37.24 | |
| Measurement points | Designation | Time of the day | Mean temperature | ||||
|---|---|---|---|---|---|---|---|
| 05 h | 09 h | 12 h | 17 h | 21 h | |||
| 1 | Covered passage | 32.7 | 35.1 | 41.9 | 42 | 36.7 | 37.68 |
| 2 | Cul-de-sac 1 | 32.7 | 35.1 | 40.4 | 40.1 | 36.3 | 36.92 |
| 3 | Cul-de-sac 2 | 32.6 | 35.2 | 40.6 | 41.1 | 36.3 | 37.16 |
| 4 | Road | 32.3 | 35.6 | 42.6 | 42 | 36.3 | 37.76 |
| 5 | Square | 32 | 37 | 43.7 | 42.3 | 36.3 | 38.26 |
| Mean | 32.46 | 35.6 | 41.84 | 41.5 | 36.38 | 37.56 | |
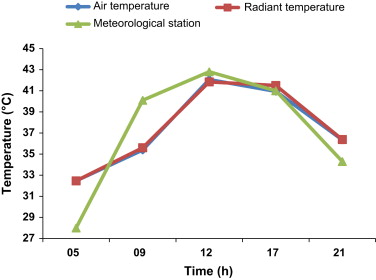
Figure 14 plots the hourly mean values of air and radiant temperatures for the whole points of trajectory 1. Table 5 presents their numerical values. It is observed that the air and radiant temperatures have merely the same values. They are lower than the temperatures recorded in the meteorological station during the day (9 h, 12 h, 17 h) and higher during the night (21 h and 5 h).
|
|
|
Figure 14. Variation of air and radiant temperatures in comparison to meteorological station values, trajectory 1. |
| Time of the day | Mean temperatures (°C) | |||||
|---|---|---|---|---|---|---|
| 05 h | 09 h | 12 h | 17 h | 21 h | ||
| Air temperature | 32.46 | 35.38 | 42.06 | 40.94 | 36.34 | 37.44 |
| Radiant temperature | 32.46 | 35.6 | 41.84 | 41.5 | 36.38 | 37.56 |
| Meteorological station | 28 | 40.1 | 42.8 | 41 | 34.3 | 37.24 |
4.2. Variation of relative humidity in trajectory 1
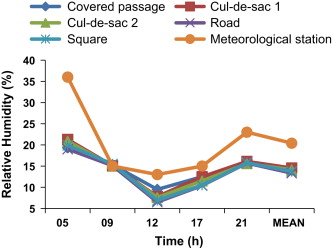
Figure 15 shows the variation of relative humidity values in trajectory 1 during the typical summer day. Table 6 gives their appropriate numerical values. It can be observed that the relative humidity in traditional tissue is lower than that of meteorological station, with a mean value of 14.04 in the trajectory against 20.4 at the meteorological station in the suburbs. The relative humidity at night is higher than during the day in both the traditional tissue and at the meteorological station. The minimum values occur at noon.
|
|
|
Figure 15. Variation of relative humidity in trajectory 1. |
| Measurement points | Designation | Time of the day | Mean relative humidity (%) | ||||
|---|---|---|---|---|---|---|---|
| 05 h | 09 h | 12 h | 17 h | 21 h | |||
| 1 | Covered passage | 19.3 | 15.3 | 9.5 | 12.5 | 15.6 | 14.44 |
| 2 | Cul-de-sac 1 | 21.3 | 15.1 | 7.8 | 12.5 | 16.1 | 14.56 |
| 3 | Cul-de-sac 2 | 20.9 | 15 | 7.6 | 11.5 | 15.6 | 14.12 |
| 4 | Road | 19 | 15.1 | 6.5 | 10.4 | 15.7 | 13.34 |
| 5 | Square | 19.9 | 15.5 | 6.9 | 10.5 | 15.8 | 13.72 |
| Mean | 20.08 | 15.2 | 7.66 | 11.48 | 15.76 | 14.04 | |
| Meteorological station | 36 | 15 | 13 | 15 | 23 | 20.4 | |
4.3. Variation of air speed in trajectory 1
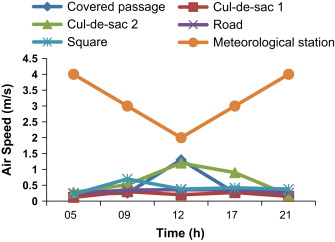
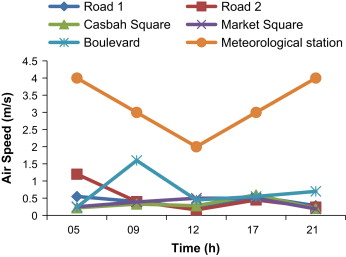
From Figure 16 we can observe that the hourly values of air velocity in the whole points are lower than those recorded at the meteorological station in the suburbs. The mean air velocity in the cul-de-sac 2 has the highest value with 0.62 m/s and then follows the covered passage with a value of 0.45 m/s, the square with a value of 0.42 m/s, the road with a value of 0.31 m/s and then the cul-de-sac 1 with a value of 0.21 m/s as the lowest one (see Table 7 ). It is worth noting that air speed in the untransformed tissue is higher during the day and lower during the night. The maximum mean value, 0.69 m/s, for the trajectory occurs during the day at 12 h, whereas at the meteorological station, the situation is inversed, with lower values during the day and higher values at night (Table 7 ).
|
|
|
Figure 16. Variation of air velocity in trajectory 1. |
| Measurement points | Designation | Time of the day | Mean air speed | ||||
|---|---|---|---|---|---|---|---|
| 05 h | 09 h | 12 h | 17 h | 21 h | |||
| 1 | Covered passage | 0.22 | 0.25 | 1.3 | 0.26 | 0.22 | 0.45 |
| 2 | Cul-de-sac 1 | 0.12 | 0.30 | 0.20 | 0.27 | 0.15 | 0.21 |
| 3 | Cul-de-sac 2 | 0.28 | 0.52 | 1.20 | 0.9 | 0.19 | 0.62 |
| 4 | Road | 0.25 | 0.35 | 0.36 | 0.35 | 0.26 | 0.31 |
| 5 | Square | 0.22 | 0.70 | 0.38 | 0.42 | 0.38 | 0.42 |
| Mean | 0.22 | 0.42 | 0.69 | 0.44 | 0.24 | 0.40 | |
| Meteorological station | 4 | 3 | 2 | 3 | 4 | 3.2 | |
4.4. Variation of temperatures in the transformed tissue (trajectory 2)
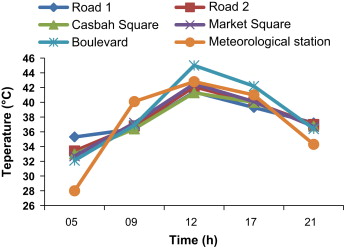
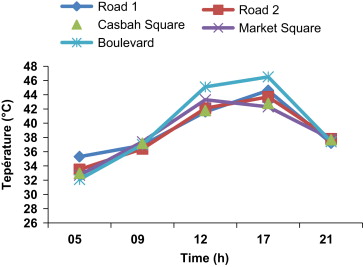
Figure 17 ; Figure 18 plot the variation of air and radiant temperatures measured in trajectory 2 for the transformed tissue and air temperature at the meteorological station of Ouargla during the typical summer day. It can be observed that the temperatures in the boulevard are higher than the rest of the locations. Table 8 shows that the daily mean air temperature in the boulevard is 38.52 °C, whereas, the road 1, road 2, the small and large squares are 37.92 °C, 37.86 °C, 37.7 °C and 37.84 °C respectively. We can also notice from Figure 17 that during the day the air temperature of the boulevard is higher than that of meteorological station, whereas the rest of the points have slightly lower temperatures. From Figure 13 we can observe that the radiant temperatures of all points have higher temperatures than those recorded at the meteorological station from 12 h until 9 h. From Table 9 , the mean value of radiant temperature for trajectory 2, 38.93, is higher than the temperature recorded at the meteorological station which is 37.24 °C. The boulevard and road 1 seem to be hotter than the rest of the locations with mean radiant temperatures of 39.62 °C and 39.12 °C.
|
|
|
Figure 17. Variation of air temperature in trajectory 2. |
|
|
|
Figure 18. Variation of radiant temperature in trajectory 2. |
| Measurement points | Designation | Time of the day | Mean air temperature | ||||
|---|---|---|---|---|---|---|---|
| 05 h | 09 h | 12 h | 17 h | 21 h | |||
| 1 | Road 1 | 35.3 | 36.4 | 41.4 | 39.3 | 37.2 | 37.92 |
| 2 | Road 2 | 33.4 | 36.8 | 42.1 | 40 | 37 | 37.86 |
| 3 | Casbah Square | 33 | 36.4 | 41.3 | 40 | 36.8 | 37.5 |
| 4 | Market Square | 32.7 | 37.2 | 42.5 | 40.1 | 36.7 | 37.84 |
| 5 | Boulevard | 32.1 | 36.9 | 45 | 42.2 | 36.4 | 38.52 |
| Mean | 33.30 | 36.74 | 42.46 | 40.32 | 36.82 | 37.93 | |
| Meteorological station | 28 | 40.1 | 42.8 | 41 | 34.3 | 37.24 | |
| Measurement points | Designation | Time of the day | Mean radiant temperature | ||||
|---|---|---|---|---|---|---|---|
| 05 h | 09 h | 12 h | 17 h | 21 h | |||
| 1 | Road 1 | 35.3 | 36.9 | 41.6 | 44.6 | 37.2 | 39.12 |
| 2 | Road 2 | 33.5 | 36.4 | 42.1 | 43.7 | 37.8 | 38.7 |
| 3 | Casbah Square | 33 | 37.2 | 41.8 | 42.8 | 37.7 | 38.5 |
| 4 | Market Square | 32.7 | 37.4 | 43.3 | 42.3 | 37.8 | 38.7 |
| 5 | Boulevard | 32.1 | 37 | 45.1 | 46.5 | 37.4 | 39.62 |
| Mean | 33.32 | 36.98 | 42.78 | 43.98 | 37.58 | 38.93 | |
The highest values for both mean air temperature and radiant temperature throughout the day are also recorded at 12 h and 17 h respectively. These are 42.46 and 43.98 °C correspondingly.
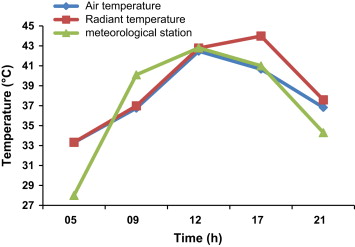
Figure 19 plots the hourly mean values of air radiant temperatures for the whole points of the trajectory 2. Table 10 presents the numerical values. It can be observed that air and radiant temperatures have similar values from 5 h till noon. But from noon till 21 h radiant temperatures are generally higher than both air and meteorological station. Table 10 shows that mean radiant temperature which is 38.92 °C is higher than both air temperature and meteorological station which have 38 and 37.24 °C respectively.
|
|
|
Figure 19. Variation of air and radiant temperatures in trajectory 2 vs. the meteorological station temperatures. |
| Time of the day | Mean temperatures | |||||
|---|---|---|---|---|---|---|
| 05 h | 09 h | 12 h | 17 h | 21 h | ||
| Air temperature | 33.30 | 36.74 | 42.46 | 40.66 | 36.82 | 38.00 |
| Radiant temperature | 33.32 | 36.98 | 42.78 | 43.98 | 37.58 | 38.92 |
| Meteorological station | 28 | 40.1 | 42.8 | 41 | 34.3 | 37.24 |
From the comparison of daily microclimatic variations in the different measuring points of trajectory 2 we can observe
- A remarkable increase of the temperature values recorded in the boulevard from other areas in this space there is the maximum temperature that exceeds even the value measured by the meteorological station.
- The maximum air temperature was recorded at noon; however that of the radiant temperature was recorded before sunset, exceeding the temperature recorded by the meteorological station.
4.5. Variation of relative humidity in trajectory 2
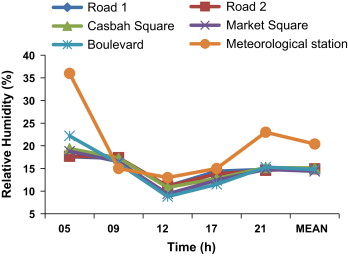
Figure 20 shows the variation of relative humidity in trajectory 2 during the typical summer day. Table 11 gives numerical values. It can be observed that the relative humidity in the transformed tissue is lower than that of meteorological station, with a mean value of 14.84 in the trajectory against 20.4 at the meteorological station in the suburbs. The relative humidity at night is slightly higher than that during the day in the trajectory.
|
|
|
Figure 20. Variation in relative humidity in trajectory 2. |
| Measurement points | Designation | Time of the day | Mean relative humidity (%) | ||||
|---|---|---|---|---|---|---|---|
| 05 h | 09 h | 12 h | 17 h | 21 h | |||
| 1 | Road 1 | 17.6 | 17.2 | 11.1 | 14.4 | 14.8 | 15.02 |
| 2 | Road 2 | 17.7 | 17.4 | 11.1 | 13.8 | 14.6 | 14.92 |
| 3 | Casbah Square | 19.4 | 17.3 | 10.8 | 12.8 | 15.2 | 15.1 |
| 4 | Market Square | 18.8 | 16.5 | 9.4 | 12.4 | 14.8 | 14.38 |
| 5 | Boulevard | 22.2 | 16.1 | 8.8 | 11.5 | 15.3 | 14.78 |
| Mean | 19.14 | 16.90 | 10.24 | 12.98 | 14.94 | 14.84 | |
| Meteorological station | 36 | 15 | 13 | 15 | 23 | 20.4 | |
4.6. Variation of air speed in trajectory 2
It can also be observed from Figure 21 that the air velocity values are always less than those recorded at the meteorological station, and this is obviously due to the presence of buildings and obstacles in urban areas. The highest value of the air velocity was recorded in the boulevard most of the time. From Table 12 it can be seen that the mean air speed value in the boulevard, 0.71 m/s, is higher than the rest of the locations. The maximum value is recorded at 9 o′clock with 1.6 m/s. The air velocity measured is lower than that raised by the meteorological station.
|
|
|
Figure 21. Variation in air speed in trajectory 2. |
| Measurement points | Designation | Time of the day | Mean air speed (m/s) | ||||
|---|---|---|---|---|---|---|---|
| 05 h | 09 h | 12 h | 17 h | 21 h | |||
| 1 | Road 1 | 0.55 | 0.4 | 0.22 | 0.55 | 0.28 | 0.4 |
| 2 | Road 2 | 1.2 | 0.4 | 0.16 | 0.45 | 0.24 | 0.49 |
| 3 | Casbah Square | 0.22 | 0.33 | 0.28 | 0.6 | 0.2 | 0.33 |
| 4 | Market Square | 0.25 | 0.39 | 0.5 | 0.5 | 0.19 | 0.37 |
| 5 | Boulevard | 0.24 | 1.6 | 0.45 | 0.55 | 0.7 | 0.71 |
| Mean | 0.49 | 0.62 | 0.32 | 0.53 | 0.32 | 0.46 | |
| Meteorological station | 4 | 3 | 2 | 3 | 4 | 3.2 | |
4.7. Comparison of the results between the two trajectories
4.7.1. Comparison of temperatures
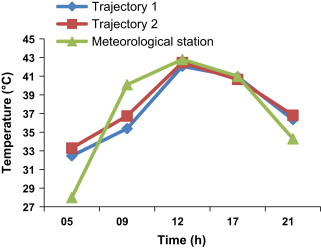
Figure 22 shows comparison of air temperatures between the two trajectories (original traditional tissue and transformed tissue) as well as the meteorological station values during the typical summer day. The comparison of the results from the graphs shows that the air temperatures recorded in the trajectory 1 are slightly lower than those measured in trajectory 2 in the morning (from 5 h till 12 h) and they become merely equal after that. From around 6 h till noon, both trajectories have temperatures lower than those recorded at the meteorological station but they become higher the rest of the time. Table 13 shows that the mean air temperature for trajectory 1 of 37.44 °C is lower than that of trajectory 2 which is 38 °C.
|
|
|
Figure 22. Comparison of mean air temperatures for the two trajectories and the weather station. |
| Time of the day | Mean air temperature (°C) | |||||
|---|---|---|---|---|---|---|
| 05 h | 09 h | 12 h | 17 h | 21 h | ||
| Trajectory 1 | 32.46 | 35.38 | 42.06 | 40.94 | 36.34 | 37.44 |
| Trajectory 2 | 33.30 | 36.74 | 42.46 | 40.66 | 36.82 | 38.00 |
| Difference (T2−T1) | 0.84 | 1.36 | 0.4 | −0.28 | 0.48 | 0.56 |
| Meteorological station | 28 | 40.1 | 42.8 | 41 | 34.3 | 37.24 |
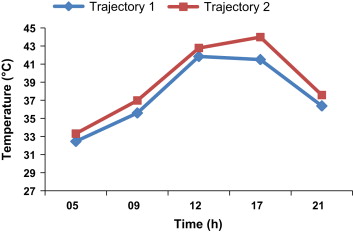
Figure 23 shows comparison of radiant temperatures between the two trajectories (original traditional tissue and transformed tissue) as well as the meteorological station values during the typical summer day. It can be easily noticed that radiant curve for trajectory 1 is always below the one for trajectory 2. This confirms that the transformed tissue is hotter than the untransformed tissue. In comparison to the meteorological station values we notice that the temperatures in trajectory 1 become higher from 17 h till 5 h whereas for trajectory 2 they become higher from 12 h and this is due to the heat gain. Table 14 shows that the mean radiant temperature for trajectory 1 of 37 °C, 56 °C is lower than that for trajectory 2 which is 38.92 °C.
|
|
|
Figure 23. Comparison of mean radiant temperatures for the two trajectories. |
| Time of the day | Mean radiant temperature (°C) | |||||
|---|---|---|---|---|---|---|
| 05 h | 09 h | 12 h | 17 h | 21 h | ||
| Trajectory 1 | 32.46 | 35.6 | 41.84 | 41.5 | 36.38 | 37.56 |
| Trajectory 2 | 33.32 | 36.98 | 42.78 | 43.98 | 37.58 | 38.92 |
| Difference (T2−T1) | 0.86 | 1.38 | 0.94 | 2.48 | 1.2 | 1.36 |
4.7.2. Comparison of relative humidity
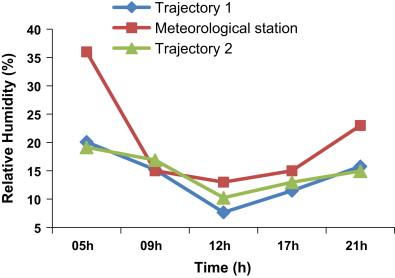
From Figure 24 it can be observed that, although there is discrepancy in mean values of relative humidity between the two trajectories, they are both lower than those recorded at the meteorological station most of the time. But if we observe numerical values from Table 15 we notice that the mean value for trajectory 1 is 14.04 which is slightly lower than that of trajectory 2 which is 14.84 but both are largely lower than the meteorological station mean which is 20.4.
|
|
|
Figure 24. Comparison of mean relative humidity for the two trajectories and the weather station. |
| Time of the day | Mean relative humidity (%) | |||||
|---|---|---|---|---|---|---|
| 05 h | 09 h | 12 h | 17 h | 21 h | ||
| Trajectory 1 | 20.08 | 15.2 | 7.66 | 11.48 | 15.76 | 14.04 |
| Trajectory 2 | 19.14 | 16.9 | 10.24 | 12.98 | 14.94 | 14.84 |
| Meteorological station | 36 | 15 | 13 | 15 | 23 | 20.4 |
4.7.3. Comparison of air speeds
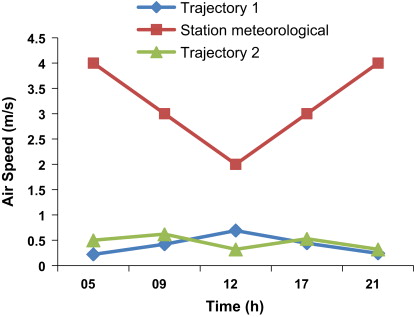
Comparison of mean values of air velocity from Figure 25 shows a significant decrease in the air velocity for the two trajectories in relation to the meteorological station values throughout the day. Table 16 gives numerical values and shows that if we take the mean values we can observe that the air speed in trajectory 1 of 0.4 m/s is lower than both trajectory 2 of 0.46 m/s and the meteorological station of 3.2 m/s.
|
|
|
Figure 25. Comparison of mean air speed for the two trajectories and the weather station. |
| Time of the day | Mean air speed (m/s) | |||||
| 05 h | 09 h | 12 h | 17 h | 21 h | ||
| Trajectory 1 | 0.22 | 0.42 | 0.69 | 0.44 | 0.24 | 0.40 |
| Trajectory 2 | 0.5 | 0.62 | 0.32 | 0.53 | 0.32 | 0.46 |
| Meteorological station | 4 | 3 | 2 | 3 | 4 | 3.2 |
5. Discussion of the results
The comparison of temperatures for traditional untransformed tissue, transformed tissue and the weather station in the open area (non-urbanized land) shows relative cooler thermal conditions within the former. The pattern of the curves demonstrates that the cooling effect happens mostly in the morning (before noon) before the heating up of the fabric which starts radiating heat in the afternoon. In the transformed tissue, we identify a thermal effect characterized especially in the period of the afternoon, which is expressed in the increase of the average values of air temperatures close to those of the meteorological station. The mean air temperature difference between trajectory 2 and trajectory 1 is 0.56 °C whereas the mean radiant temperature difference between trajectory 2 and trajectory 1 is 1.36 °C.
These results confirm the devaluation of microclimate in the transformed tissue, which is affected by the warming of the heat transferred from the sensible heat stored in the building materials and asphalt on the ground.
We distinguished a classification according to the urban thermal environment in each area and we found that the cul-de-sac and the road, for example, benefit from a thermal environment cooler than its immediate non-urbanized (weather station).
It is noticed that the relative humidity is relatively low, 14.04%. This is in fact due to the absence of vegetation. But from thermal comfort stand point as indicated in the literature, relative humidity as low as 9% is judged to be comfortable over long periods of time for hot dry climate. However, an acceptable range extends from 30% to 65%, with the optimum at about 50% (Evans, 1980 ; Indraganti et al ., 2012 ).
Air speeds are low during the day in the untransformed tissue but it is higher at night. Air movement is not very acknowledged in the desert cities during the day because they are hot. But it is required at night when the air is relatively cooler.
Figure 11 ; Figure 16 show that the wind speed at open areas of Ouargla is of the order of 3–4 m/s which is high in the scale of comfort, especially during hot days. The urban organic configuration and irregular road system reduce wind speed and create a continuous low flow of winds with changing direction, causing wind cuts that increase the differences in air pressure around the built-up areas improving necessary ventilation. During the night, it prevents the wind to drive up fresh air accumulated between buildings. The magnitude of air speed recorded in the traditional tissue (trajectory 1) is of the order of 0.4 m/s. Air velocity has little effect on evaporation at low humidity, as it takes place readily. However it is of great importance in hot dry conditions in affecting the convection transfer (Olgyay, 1963 ; ASHRAE, 2009 ).
The results obtained could have been more substantial if the measurements covered more urban areas districts and time of survey (variance). The study has relative limitation especially in the absence of some modeling.
6. Conclusion
This investigation demonstrates that the traditional settlement or Ksar of Ouargla was a good reference of adaptation to harsh climatic conditions and that the recent morphological transformations have influenced negatively the existing favorable microclimatic conditions and resulted in increasing ambient temperatures in the transformed areas. This will lead to the non-clean energy consumption to achieve the occupants thermal comfort. Traditional architecture of Ouargla Ksar brings good passive design environmental solutions to energy consumption and negative environmental effects. The traditional untransformed tissue shows relatively cooler thermal in the city of Ouargla. Air movement is not very acknowledged in the desert cities during the day because they are hot. But it is required at night when the air is relatively cooler. The absence of vegetation in hot dry climates has serious implications on the urban microclimate humidification.
This thermal quality comes from several architectural and urban factors; among them we quote
- the compactness of urban fabric of the Ksar which minimizes the exposure of building surfaces to solar radiation in summer and cold winds of winter,
- the road structure is irregular, streets are deep and twisting which create shadowed areas and reduce the radiant temperature.
This is because passive design solutions allow buildings to adapt more appropriately to their local climates and take better advantage of natural energy resources, such as wind, material, and shadow, to create favorable environment.
References
- ASHRAE, 2009 ASHRAE, 2009. ASHRAE Handbook Fundamentals. Atlanta, GA, ASHRAE.
- Bouchair and Dupagne, 2003 A. Bouchair, A. Dupagne; Building traditions of Mzab facing the challenges of re-shaping of its built form and society; Building and Environment, 38 (2003), pp. 1345–1364
- Bahadori, 1985 M.N. Bahadori; An improved design of wind towers for natural ventilation and passive cooling; Solar Energy, 35 (1985), pp. 119–129
- Bouchair, 1994 A. Bouchair; Solar chimney for promoting cooling ventilation in southern Algeria; Building Services Engineering Research and Technology, 15 (2) (1994), pp. 81–93
- Bouchair, 2004 A. Bouchair; Decline of urban ecosystem of Mzab valley; Building and Environment, 39 (2004), pp. 719–732
- Bouchair, 2013 Bouchair, A., 2013. Compact cities as a response to the challenging local environmental constraints in hot arid lands of Algeria. Presented in the international conference: Mediterranean Green Energy Forum, 16-20 June, Fes, Morocco.
- Boukhabla et al., 2012 M. Boukhabla, D. Alkama, A. Bouchair; The effect of urban morphology on urban heat island in the city of Biskra in Algeria; International Journal of Ambient Energy. (2012) http://doi.org/10.1080/01430750.2012.740424
- Evans, 1980 M. Evans; Housing climate and comfort; Architectural. Press Ltd., London. Meteorological station of Ouargla, Algeria (1980)
- Indraganti et al., 2012 Indraganti M., Ooka1R. Rijal H.B., 2012. Significance of air movement for thermal comfort in warm climates: a discussion in Indian context. In: Proceedings of 7th Windsor Conference: The Changing Context of Comfort in an Unpredictable World, Cumberland Lodge, Windsor, UK. Network for Comfort and Energy Use in Buildings, London [Website: 〈http://nceub.commoncense.info/uploads/W1213%20Indraganti.pdf〉 ].
- Olgyay, 1963 Olgyay, V., 1963. Design with Climate, Bioclimatic Approach and Architectural Regionalism. Princeton University Press, Princeton.
Document information
Published on 12/05/17
Submitted on 12/05/17
Licence: Other
Share this document
Keywords
claim authorship
Are you one of the authors of this document?
