Abstract
There exists a great demand to utilize renewable energy sources instead of burning fossil fuels. Currently, power conversion efficiency of domestic solar cells is 23.6%, and further improvements are necessary. Furthermore, real-world domestic solar panels show an efficiency of just about 15 percent. Combining piezoelectric strips (harnessing vibrational energy) and solar cells can potentially enhance power generation and efficiency. Solar cells and piezoelectric strips were exposed to simulated sun, rain, and wind, and tilting angles (0o-75o), to determine optimal power output. Solar cells were tested within an enclosed testing chamber with a 100W Halogen bulb as a light source simulating the sun (30.48cm from the cells). Power generation remained constant during the trials with and without piezoelectric strips, producing 10.0 mW and 10.2 mW, respectively. To simulate wind, a fan was utilized at 8.9m/s, 8.0m/s, and 7.2m/s. When assessing wind, 8.9m/s (0o) produced the highest power (0.36mW) in comparison to 7.2m/s (0.3mW). To simulate rain, a peristaltic-pump (10mL/min and 25mL/min) dispersed water droplets onto piezoelectric strips for testing. High water droplet (diameter=1.0 cm) speed produced the highest power in comparison to low speeds, 0.058mW and 0.053mW respectively. Mixed condition testing produced 10.3 mW, an 8.3% increase in comparison to solar alone, showcasing that piezoelectric strips can effectively be implemented in conjunction with solar cells. In order to maximize power output with this combined setup, areas with higher annual rainfall and wind speeds could benefit the most.
Introduction
Today, the reduction in the use of fossil fuels is highly important. Society is experiencing a climatic emergency due to high amounts of pollutants. The generation of renewable energy is becoming more prevalent, due to its ability to produce energy without harming the environment (Sucupira and Castro-Gomes, 2021). It is also important to generate power at high voltage levels through renewable sources. The potential difference generation of renewable sources can be improved by using the wind energy harvesting ability of piezoelectrics (Chatterjee, 2019). Piezoelectric materials generate electric charge when subjected to deformation, while solar cells convert light energy into electricity. By incorporating these sources as built-in battery chargers, the need to carry extra batteries or chargers can be significantly reduced. Moreover, these power sources are environmentally friendly and contribute to minimizing battery waste, making them safer options for power generation (Cardenas et al., 2012). A piezoelectric energy harvester utilizes external forces acting on piezoelectric elements to produce energy. Typically, this technology is employed to convert surplus ambient energy into usable electrical energy. The functioning principle of the piezoelectric energy harvester relies on the direct piezoelectric effect. As the harvester experiences stress, charges are generated on the surface of the materials in direct proportion. When connected to an external circuit, these charges induce a current to flow through the connected load. Hence, in this operation, the piezoelectric material serves as a source of voltage, current, charge, or power (Li and Lee, 2022).
Using piezoelectric strips in regard to power is a crucial innovation that has the potential to assist in power generation. Currently, all types of solar cells show below 50 percent efficiency (Woodford 2022). Furthermore, real-world domestic solar panels show an efficiency of just about 15 percent. Technologies, such as piezoelectric strips, can be used to help further enhance energy production when coupled with solar cells. Weather across different regions constantly varies. However, the proposed model of a hybrid system containing solar cells and piezoelectric strips would be able to measure these differences and produce the greatest amount of energy output possible. Since many areas do not receive high amounts of sunlight, using a system that can harvest energy via other weather conditions can increase efficiency (Kumar, 2015). Another problem that this project addressed was the scarcity of electrical energy in resource-limited environments. Bukhari et al (2019) explained how the usage of batteries in portable devices is harmful to the environment and leads to waste (Bukhari et al, 2019). Therefore, piezoelectric strips have the potential to offer a safe and cheap alternative to harnessing electrical energy and using it to power devices efficiently, without the worry of harming the environment. There is also the idea of harnessing raindrop energy. However, the low efficiency of raindrop energy harvesting is a dominating barrier to the use of raindrop solar cells in practical applications (Xie et al, 2022). The utilization of piezoelectric strips, in varying weather conditions, would prove to be crucial from a general economic and environmental perspective, especially in regions of low socioeconomic standing.
According to APC (2015), piezoelectrics are able to produce an electrical charge when exposed to mechanical stress. Therefore, they require no external power source and operate solely on applied forces. Piezoelectric strip bending actuators are made of two pieces of piezoelectric ceramic material. One ceramic layer expands while the other ceramic layer contracts, creating a bending motion, and allowing the strip to produce power via vibrations (Strip Bending Piezo Actuators - View Spec Sheet and Part Numbers, n.d.). The power that can be utilized with piezoelectric strips will change energy power in areas with varying conditions in the environment as well as geographical location. Piezoelectrics provide a sustainable method to harvest energy. Due to their flexibility and simplicity, piezoelectrics can produce energy without depleting natural resources (Nia et al., 2017). TENGs for self-powered strips, energy harvesters, and triboelectrification, often known as contact electrification, are used by a TENG. Previously, there have been other means of harvesting energy, such as the use of coal and oil, using piezoelectric strips is a safe and relatively inexpensive alternative that is also less strenuous on the environment and the organisms within it. When mechanical stress is applied to certain materials, a charge is produced across them. Piezoelectric pressure strips use this effect by detecting the voltage created by the applied pressure across a piezoelectric element. Solar cells are a little different; when the sun shines on a solar panel, the PV cells in the panel absorb the energy from the sun. This energy causes electricity to flow by forcing electrical charges to shift in response to an internal electric field in the cell. These two factors could be potentially combined for a system that harvests energy in new ways. Despite the rapid development of modern batteries such as fuel cells and lithium-ion batteries, due to the huge distribution of battery usage and short life span, great efforts are still required for battery monitoring, replacement, and recycling (Zhao and Zhu, 2020). There are also problems with these, such as inevitable factors that can affect energy dissipation, including mechanical vibration. TENG is a very similar system to the piezoelectric strips, so they can essentially be used interchangeably to study their effects on solar cells under different weather conditions (rain and wind). Another important factor in TENG is that of self-powered technology. TENG can convert mechanical energy into electrical energy by contact and relative motion (similar to piezoelectric strips), thus providing the possibility of self-powering for electric equipment (An et al, 2021).
Liu et al (2018) utilized triboelectric nanogenerators in combination with solar cells as a viable solution to harness additional energy. When it rains, solar cells, which are a promising technology for turning light into power, work poorly. Solar cells convert light energy into electrical power through the photovoltaic effect. When photons strike the solar cell's surface, they excite electrons in the semiconductor material, creating a flow of electrical current. To generate power from both sunlight and raindrops, an energy-collecting structure incorporating a solar cell and a triboelectric nanogenerator (TENG) device was created. Combining an imprinted-polydimethylsiloxane (PDMS) as a triboelectric material and PEDOT: PSS layer as an electrode, a single-electrode mode water-drop TENG on the solar cell was developed. With a peak short-circuit current of 33.0 nA and a peak open-circuit voltage of 2.14 V, respectively, the TENG's output was considerably improved by increasing the contact area between the imprinted-PDMS and water drops. The integrated electrode layout of the hybrid energy harvesting system may combine the benefits of a solar cell's high current and a TENG device's high voltage, suggesting an effective solution for collecting energy from the environment under various weather circumstances (Liu et al, 2018).
Combining wind and solar energy harvesting abilities can maximize the efficiency of energy generation. A wind/solar energy harvesting device is a viable concept for maximum power measurements (Silva-Leon et al., 2019). Since solar energy is scarce in certain regions, it is important to consider other ways to harvest energy in areas with a high presence of wind and rainfall. A hybrid system with piezoelectrics and solar cells would be capable of generating electricity from solar as well as wind and rain energy (Vatansever et al., 2012). At the University of Manchester, scientists have developed a flag that, while being raised on a building, can harness wind and solar energy by utilizing the mechanics of solar cells and piezoelectrics (Flying the – 4 Milliwatt – Flag for Piezo/Solar Renewables, 2019).
By mimicking these studies, this project aimed to create a hybrid system with piezoelectric strips in conjunction with solar cells to optimize power output via exposure to varying weather conditions (solar, rain, and wind). The purpose was to simulate an environment of varying weather conditions via a halogen sunlight simulator (solar), variable flow pump (rain), and a box fan (wind) to find the optimal energy output in combination with piezoelectric sensors and solar cells. It was hypothesized that higher angled cells with piezoelectric sensors added and heavy types of rain, sunlight, and wind (depending on the specific trials) will produce a greater overall power output, than the output of solar cells alone. The null hypothesis was that different angle placements with varying weather conditions will not affect the power output of the piezoelectric sensors-implemented solar cells. Also, the engineering goal of the experiment was to successfully construct an enclosed region for the solar, wind, and rain aspects to simulate real-life weather conditions
Methodology
Procedure:
This model was designed by solely testing solar cells, and then piezoelectric sensors were added to test the efficiencies. Both solar cells and piezoelectric sensors were purchased for this study. These sensors were positioned above the cell. The power output of the solar cell and the piezoelectric cells were measured when exposed to all testing conditions (sunlight, simulated rain, simulated wind). When the piezoelectric cells were introduced or integrated, it was essential to determine how the combination of them with solar cells affected overall power output. The preliminary testing consisted of only the solar cell in an enclosed region, and then piezoelectric strips were added with sunlight simulators, fans, and water pumps depending on the trials.
Aspect 1: Optimization of Tilting Angles during Simulated Sunlight Exposure (Control)
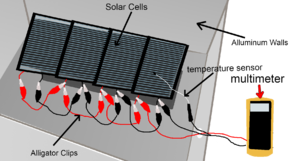
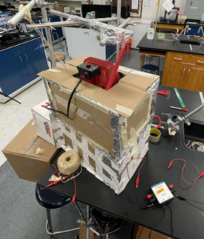
In the control group, only the solar cell was tested. To ensure accuracy, the solar cell was set in an enclosed region with concentrated 100W Halogen light (Sun Simulator Light, Fuel Cell Store) beaming onto the solar cell. The distance between the solar cell and light, consistent across all trials, was 30.48 cm. A temperature sensor was placed directly above the solar cell to measure temperature, in Celsius, throughout the trial. Using cardboard and black construction paper, this chamber was built to block ambient light in the room and avoid fluctuations in solar output due to other light hitting the solar cell, as shown in figure 4. A light meter was used to measure light intensity prior to running the trials to ensure that the light intensity was consistent across all trials. After the trials (600 seconds), power, voltage, temperature, and amperage were recorded through the use of a vernier energy sensor by the second. Since this was the control group and the testing point of the experiment, the power generated by the variables of piezoelectric strips and weather conditions allowed for comparison in the efficiency compared to a normal solar cell. Different tilting angles of the solar cell in 15-degree increments between 0-75 were also examined in these variables. These tilting angles were replicated and tested throughout all of the aspects.
Aspect 2: Tilting Angles and Weather Conditions (Solar)
For the solar condition, the sunlight was provided by a sunlight simulator. The sunlight simulator (100 W Halogen bulb, Fuel Cell Store) was used for all trials and the distance from the solar cell was kept constant. This simulator provided light to the solar cell at a distance of 30.48 cm within the constructed chamber (previously stated in aspect 1). The light that was in the testing room independent of the experiment was accounted for in the conditions by minimizing it with an enclosed region. The test was simply conducted by parallelly connecting a piezoelectric strip to a multimeter. These strips were placed above the solar cell. Then, the light was left on for 600 seconds intervals in between trials of different numbers of piezoelectric cells to find the optimal current. The light that was in the testing room independent of the experiment was accounted for in the conditions by minimizing it with an enclosed region. Finally, the tilting angle of the solar cell was changed by the use of a rectangular base plate to account for the energy difference when the model was placed on different inclines.
Aspect 3: Tilting Angles and Weather Conditions (Wind)
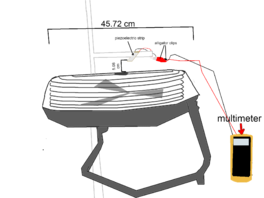
Wind energy was also harnessed into usable energy in the experiment. These tests were conducted with a box fan, in order to isolate wind as a factor and measure its respective power as seen in figure 2. The fan was turned on and all tests were conducted for intervals of 120 seconds to test the energy output under the wind condition. A crucial feature of the fan that was utilized in the experiment is variable speeds. The low, medium, and high wind speed settings on the fan at a distance of 5.08 cm from the piezoelectric strip (constant) were measured by an anemometer (vernier). The measurement was taken before each trial and the different settings were tested 18 times for accuracy. Similar to the other variable conditions, the tilting angle of the solar cell was tested using a rectangular base plate to account for the energy difference when the model was placed on different inclines. This aspect did not contain any light shined onto the solar cell and solely focused on energy production by piezoelectric strips to determine the optimal angle and wind speed for energy production.
Aspect 4: Tilting Angles and Weather Conditions (Rain)
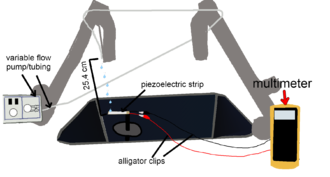
Another aspect of piezoelectric cells combined with solar cells was raindrop power generation. The conversion of rain into usable energy was another factor that was tested. A variable flow peristaltic pump was used with strips in intervals of 120 seconds and data was collected with a multimeter, as depicted in figure 3. An important variable that was considered in this procedure was varying drip rates. The variable pump that yields flow rates of 0.4 mL/min to 85 mL/min was used to account for the effect of the different rates. The test was conducted by attaching the pump tubing around a sink faucet to allow the water droplets to drip directly onto the piezoelectric strip (shown in figure 3) and the flow rate was changed for each trial multiple times from 10ml/min to 25ml/min. There were 18 trials conducted for each flow rate. The tilting angle of the solar cell was evaluated by the use of a rectangular base plate, much like the other variable conditions, to account for the energy difference when the model was put on different inclines.
Aspect 5: Tilting Angles and Weather Conditions (Mixed Conditions)
The last variable tested was all of the weather conditions in one test. Essentially, the most efficient drip rate from the pump was used in this test, as well as the most efficient wind speed. This test helped find the most optimal condition and whether it was useful when compared to the power output of solely solar cells (control group). Therefore, the sunlight simulator was also utilized as a constant solar energy source. The pump, simulator, and fan were all turned on before the trial, and the strip was connected to measure output. The fan was placed in the opposite direction of the sunlight simulator, to avoid blocking any of the variables. However, the water droplet placement could have been affected by the wind, which could have affected the overall energy output.
Data Analysis:
Data was analyzed by averaging all of the numerous tests for each trial. The main areas that were tested are voltage, power, and amperage. A multimeter was also utilized to collect voltage, a light sensor calculated light intensity to account for efficiency, and an ammeter collected amperage to finally calculate power. Also, the multimeter recording the bending of the piezoelectric strips was recorded on video. Energy output was measured using a Vernier energy sensor and LabQuest. Solar cell efficiency was calculated for each weather/testing condition to determine if the addition of piezoelectric strips helps offset the loss in efficiency (power out/power in) of the solar cell. Data was collected during the duration of the experiment (one hour). Mean + Standard Deviation was calculated and graphs constructed using Excel. Data was analyzed via a One-way ANOVA followed by a post hoc Scheffe where p<0.05 was used for analysis (IBM SPSS ver. 26).
Figure 4: Experimental setup for the control group (aspect 1) - The sunlight simulator is propped up and the enclosed region is closed with aluminum foil on the inside of the box; alligator clips are used to connect all solar cells to the vernier energy sensor
Results
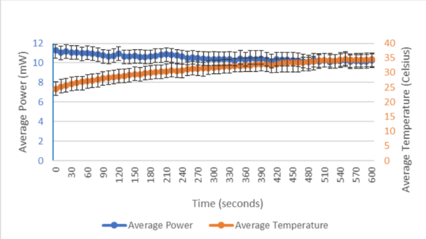
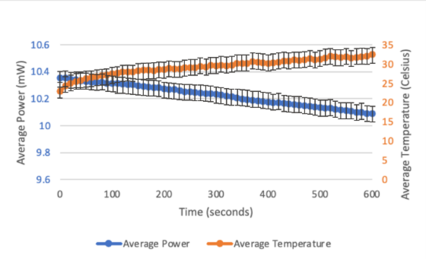
Figure 5: Power vs. Temperature over Time graph for the control group - 0 Degrees (n=3)
The power vs temperature graph for 0 degrees of the control group/solar aspect, shown in figure 5, showed the maximum potential power output for the solar cell by itself and loss of power with the addition of the piezoelectric strip. The average power of the 0-degree group, when averaging the six trials, was close to 10.2 milliwatts. Also, the temperature increased from approximately 27 to 35 degrees celsius, due to the constant heating of the sunlight simulator. The information from the results of this group was crucial for future variables as it was important to test the piezoelectric strip’s effectiveness compared to that of solar cells.
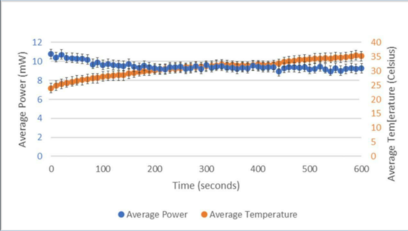
Figure 6: Power vs. Temperature over Time graphs for 0° of implementation of piezoelectric strip of solar aspect (n=3)
In figure 6, the same conditions were tested as the control group (refer to figure 5) with the addition of the piezoelectric strip. Compared to the 10.2 milliwatts produced by the 0-degree control group (figure 5), the 0-degree group of the solar aspect produced around 10.0 milliwatts when averaging the trials. This demonstrated that the power dropoff of implementing a piezoelectric strip is very minimal and can be compensated with the potential power output of the other weather conditions.
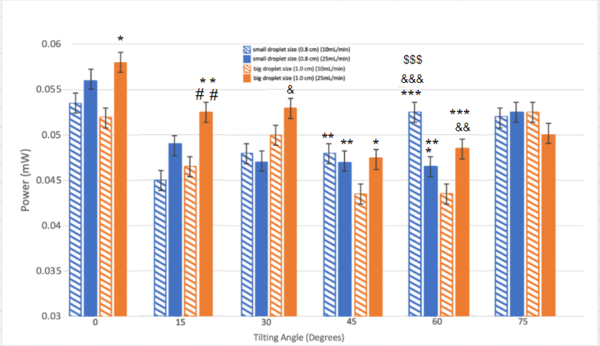
Figure 7: Power Output For Varying Tilting Angles at 10mL/min and 25mL/min (n=36)
In figure 7, the graphs for the rain aspect are shown. These graphs provide information on how the piezoelectric strip was able to harness power with water droplets. Power output when piezoelectric strips were tilted at varying angles as well as exposed to varying flow rates (10mL/min and 25mL/min) was assessed. The variable flow pump setting was altered to 25 ml/min to test the effect of faster droplets on the power output due to the fact that piezoelectric strips generate power through vibrational energy. The 0-degree group produced the highest power output, and the big droplet size produced the most power at around 0.058 milliwatts. As seen by the symbols on the graph in figure 7, the big droplet size at 25ml/min was statistically significant, where p<.05, to the big droplet size at the 10ml/min setting at the 0-degree tilting angle. At the 75-degree tilting angle, there is no statistical significance between the groups because there was an inconsistent strain applied with the increase of the tilting angle of the strip.
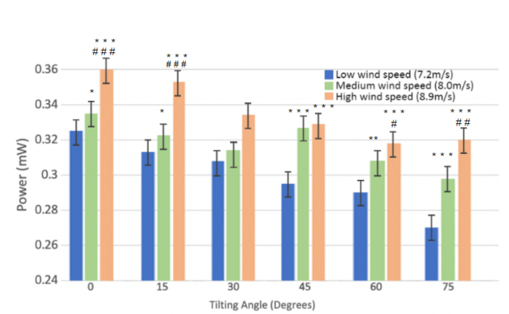
Figure 8: Power Output For Varying Tilting Angles at Low, Medium, and High Winds Speeds (n=36)
In figure 8, the graph of the power output of the low wind speed trials is also shown. There is a general trend of the power output decreasing with the increase of tilting angles, as the 0-degree group produced the highest power, which is likely due to the fact that the strip was able to have a wider vibration when it was flat. The same trend followed through with the medium and high wind speed groups. The same y-axis scaling was used for all graphs for direct comparison. Overall, the high wind speed group at 0 degrees produced the highest power output. The piezoelectric strip produced 0.36 milliwatts, which is around 0.2 milliwatts more than the most optimal condition for the rain aspect. This is most likely due to the fact that the wind speeds were consistently vibrating the strip instead of water droplets dropping from a distance. The power output of the high wind speed (8.9m/s) was statistically significant to that of the medium (8.0m/s) and low (7.2m/s) wind speeds, where p<.001. Therefore, the highest wind speed allowed the strip to frequently oscillate, resulting in higher power output.
Figure 9: Power vs. Temperature over Time graphs for most optimal Mixed Condition (n=3)
In figure 9, the power output graph for the mixed conditions aspect which included solar, wind, and rain components is shown. The data for the mixed condition aspect showed 0.10 milliwatts increase from the previously most efficient condition, which was the control group. Since the piezoelectric strip decreased the power output by around 0.20 milliwatts, with the wind and rain aspects combined, the overall power output increased by 0.10 milliwatts.
Discussion
The purpose of this research was to identify the significance of the power output production via a piezoelectric strip in comparison to a larger scaled solar cell. Since the piezoelectric strip can only harness an energy output based on vibrational energy, it was expected that the strip would cause a decrease in total power output in the solar condition only, since there was no external source vibrating the system. The alternate hypothesis was rejected, as an increase in tilting angles led to a decrease in power output. This is likely due to the fact that as the tilting angle of solar cells increases, there is a smaller percentage of surface area that the halogen sunlight simulator is hitting the solar cell. The same trend applied to the piezoelectric strip, but with the rain and wind conditions.
By observing the graph of the 0-degree tilting angle of the control group, many comparisons can be made. With the increase of temperature throughout the trial, the power tends to slightly drop, but not by a significant amount. Throughout the duration of the trial, the cells are overheating since the sunlight simulator reaches temperatures that the sun would not reach in the real world. The power, when averaging the trials for the 0-degree group, was close to 10.2 mW. The same type of graph was constructed for the results of aspect 2 (implementation of piezoelectric strips). It was expected that the power output would be lower compared to the control group since the strip would block some of the sunlight coming in from the sunlight simulator. Compared to the 10.2 mW produced by the 0-degree control group, the 0-degree group of aspect 2 produced around 10.0 mW. In terms of the wind, rain, and mixed conditions aspect, the piezoelectric strip was seen to be an important variable pertaining to overall power output. The piezoelectric strip covered a small portion of the surface area of the solar cell and slightly reduced power output. Therefore, it was important to test if the wind and rain conditions could produce a higher power output than it lost by covering the solar cell. As seen by the results of the mixed conditions group, the piezoelectric strip produced more power than it lost with the wind and rain conditions. Due to varying weather conditions, each variable was individually considered for real-world applications.
The piezoelectric strip covered some surface area of the solar cell and slightly reduced power output (roughly 2.0% power loss). Also, raindrops were able to harvest minimal power output through the vibrational mechanism of the piezoelectric strip (Jeon et al, 2015). Capacitance didn’t have a major impact on the power output of the strip (Bukhari et al, 2019). The water droplet at the 25 ml/min setting hit the piezoelectric strip with a greater strain. Raindrop kinetics involves the study of raindrop motion and behavior as they fall through the atmosphere. It examines factors like size, shape, velocity, and interaction with air currents. When raindrops hit surfaces, they convert their kinetic energy into vibrational energy upon impact. This energy transfer causes phenomena such as splash, rebound, or infiltration, depending on the surface characteristics and the raindrop's energy (Warude et al, 2015). As seen by the symbols on the graph in figure 7, the big droplet size at 25ml/min was statistically significant, where p<.05, to the big droplet size at the 10ml/min setting at the 0-degree tilting angle. At the 75-degree tilting angle, there was no statistical significance between the groups due to the fact that there was an inconsistent strain applied with the increase of the tilting angle of the strip. The wind condition was more effective than the rain condition since there was constant stress applied. Irrespective of the tilting angle, as the fan wind speed increased, the power output also increased. The power output of the high wind speed (8.9m/s) was statistically significant to that of the medium (8.0m/s) and low (7.2m/s) wind speeds, where p<.001. Therefore, the highest wind speed allowed the strip to frequently oscillate, resulting in higher power output. As seen by the results of the mixed conditions group, the piezoelectric strip produced more power than it lost with the wind and rain conditions (0.3mW compared to 0.2mW).
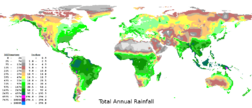
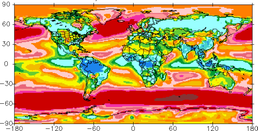
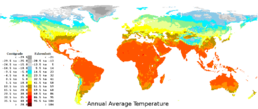
In terms of real-world applications, areas with higher temperatures, such as Africa and South America (figure 10), might consider solar cells with no strip as a viable option. China, an area that highly invests in solar power, also might not find the piezoelectric strip applicable due to high temperatures (Which Countries Are Leading the Way with Solar Power?, 2021). In terms of harvesting energy through raindrops, areas with more rainfall, such as southeast Asia and other parts of Europe, could utilize the piezoelectric strip mechanism and harvest additional energy. In terms of wind energy, areas with higher wind speeds, such as the east coast of North America, can also use the vibrational energy of the strip to harvest energy. Overall, for every region in the world, sun, rain, and/or wind will always be present. In areas that receive mixed conditions all year, such as New York, it may be effective to implement the hybrid system and combine the piezoelectric strip with solar cells. This way, to account for unpredictable weather conditions, houses/buildings can ensure that they are producing a power output regardless of the outdoor conditions. By looking at areas that exhibit patterns of high rain and wind conditions, the system used in this study can be utilized to ensure energy is harvested in all conditions.
For limitations, power output is also unstable in the real world due to unpredictable temperature and humidity. Outdoor conditions can fluctuate which was not accounted for in this study. Also, further research on different polymeric coatings for the piezoelectric strip can be tested to account for these conditions. Another limitation is that the piezoelectric strip needs consistent vibrations from the surroundings (in the form of the sun, wind, and rain) to produce a power output.
|
Figure 10: Annual Average Temperature, Rainfall, Wind Speed (Climate-Charts, 2017)
Conclusion
Overall, the most optimal condition was the mixed weather condition, as it utilized high water droplet speeds and high wind speeds. This was likely due to the frequent vibrations of the piezoelectric strip that allowed it to produce a higher power output than just the solar cell (control group) in a hybrid system (Ramli et al., 2021). The alternate hypothesis was disproven by the actual results since the increase in the tilting angles did, in fact, not produce a higher power output. It can also be seen that the 0-degree group produced the highest power output since the sunlight simulator was placed directly above the enclosed region. Therefore, when placing solar cells on the roofs of houses/buildings, they should switch angles throughout the day to face the sun. Other than finding the optimal angle for these solar cells, we can conclude that with the results thus far, the implementation of piezoelectric can be effective in maximizing total power output in real-world applications. Since the results showed that implementing piezoelectric strips caused a minimal drop off in overall power output, due to the cast of a shadow above the solar cell resulting in shade (Staff, 2019), using the energy produced by the strip from the rain and wind conditions (0.3 mW), the power output will make up for the power lost and produce even more power. In terms of future studies, these experiments can be replicated in other laboratories to validate the results of this study. Furthermore, to provide a more accurate account of the effectiveness of implementing piezoelectric strips on these solar cells, the structure can be placed outside when the sun is shining to depict real-world conditions. This same technique can be applied to other weather conditions (rain and wind).
Future Studies
In terms of future studies, these experiments can be replicated in other laboratories to validate the results of this study. Furthermore, to provide a more accurate account of the effectiveness of implementing piezoelectric strips on these solar cells, the structure can be placed outside when the sun is shining to simulate real-world conditions. This same technique can be applied to other weather conditions (rain and wind). Also, this study utilized pre-made piezoelectric strips, so future studies could explore creating strips, and modifying their shape/size, to potentially enhance their ability (Ilyas and Swingler, 2015). The development of renewable and sustainable building systems through the utilization of enhanced techniques to improve the piezoelectricity of cement and the application of material piezoelectricity for diverse building functions are also potential studies for the future (Sekhar et al., 2021). Finally, since this study utilized small solar cells, in the future, this study can be repeated with larger cells, ones that would normally be used on the roofs of houses, to determine just how effective and significant the power output of the piezoelectric strips are in comparison to the energy loss of the solar cells when the strips are placed over them (Mostafa et al., 2018).
Bibliography
An, X., Wang, C., Shao, R., Sun, S. (2021). Advances and prospects of triboelectric nanogenerator for self-powered system. International Journal of Smart and Nano Materials, 12, (3), 233–255, DOI: 10.1080/19475411.2021.1973143.
APC. (2015). Top Uses of Piezoelectricity in Everyday Applications | APC International Ltd., [CrossRef].
Bukhari, M. U., Riaz, K., & Tauqeer (2019), Simple and low cost triboelectric nanogenerator (TENG) for resource limited environment, DOI: 10.1080/19475411.2021.1973143, [CrossRef].
Cardenas, C., Vendiola, C., Chavarria, A., Fedorov, I. (2012). Solar/Motion Powered Shoe Heater, [CrossRef].
Chatterjee, P. P. (2019). Integration of Solar and Wind Energy to Generate Piezoelectric Potential Difference. Journal of Resources, Energy and Development, 16, (1), 1–8, DOI: 10.3233/red-160101.
Chris Woodford (2022) “How Do Solar Cells Work?” Explain That Stuff, [CrossRef].
Flying the – 4 milliwatt – flag for piezo/solar renewables. (2019). Pv Magazine International, [CrossRef].
Ilyas, M. A., Swingler, J. (2015). Piezoelectric energy harvesting from raindrop impacts. Energy, 90, DOI: 10.1016/j.energy.2015.07.114.
Jeon, S.-B., Kim, D., Yoon, G.-W., Yoon, J.-B., & Choi, Y.-K. (2015) Self-cleaning hybrid energy harvester to generate power from raindrop and sunlight, Nano Energy, [CrossRef].
Kim, W.-G., Kim, D.-W., Tcho, I.-W., Kim, J.-K., Kim, M.-S., Choi, Y.-K. (2021). Triboelectric Nanogenerator: Structure, Mechanism, and Applications. ACS Nano, 15(1), 258–287, DOI: 10.1021/acsnano.0c09803.
Kumar, C. N. (2015). Energy collection via Piezoelectricity. Journal of Physics: Conference Series, 662, DOI: 10.1088/1742-6596/662/1/012031.
Liu, Y., Sun, N., Liu, J., Wen, Z., Sun, X., Lee, S.-T., Sun, B. (2018). Integrating a Silicon Solar Cell with a Triboelectric Nanogenerator via a Mutual Electrode for Harvesting Energy from Sunlight and Raindrops. ACS Nano, 12(3), 2893–2899, DOI: 10.1021/acsnano.8b00416.
Li, T., Lee, P. S. (2022). Piezoelectric Energy Harvesting Technology: From Materials, Structures, to Applications. Small Structures, 3(3), DOI: 10.1002/sstr.202100128.
Mostafa, Silva-Leon, J., O’Connor, J. K., Kennaugh, A., Revell, A. (2018). Simultaneous Energy Harvesting Using Dual Piezo-Solar Devices. 267–278, DOI: 10.1007/978-3-030-55594-8_24.
National University of Singapore. (2022) "New efficiency record for solar cell technology." ScienceDaily. [CrossRef].
Nia, Elham Maghsoudi, Zawawi, Noor Amila Wan Abdullah, Singh, Balbir Singh Mahinder (2017) IOP Conf. Ser.: Mater. Sci. Eng. 291 012026, DOI: 10.1088/1757-899X/291/1/012026.
Ramli, H., Mohd Yusoff, S. A. N., Azmi, M., Sabtu, N., & Hezmi, M. A. (2021). Influence of drop size distribution and kinetic energy in precipitation modelling for laboratory rainfall simulators, DOI: 10.5194/hess-2021-462.
Sekhar, B. C., Dhanalakshmi, B., Rao, B. S., Ramesh, S., Prasad, K. V., Rao, P. S. V. S., Rao, B. P. (2021). Piezoelectricity and Its Applications. In www.intechopen.com. IntechOpen, [CrossRef].
Silva-Leon, J., Cioncolini, A., Nabawy, M. R. A., Revell, A., Kennaugh, A. (2019). Simultaneous wind and solar energy harvesting with inverted flags. Applied Energy, 239, 846–858, DOI: 10.1016/j.apenergy.2019.01.246.
Staff, S. C. (2019). Why even partial shading is bad for solar power systems. Solar Choice, [CrossRef].
Strip Bending Piezo Actuators - View Spec Sheet and Part Numbers. (n.d.). Piezo Direct., [CrossRef].
Sucupira, L., Castro-Gomes, J. (2021). Review of Energy Harvesting for Buildings Based on Solar Energy and Thermal Materials. CivilEng, 2(4), 852–873, DOI: 10.3390/civileng2040046.
Vatansever, D., Hadimani, R. L., Shah, T., Siores, E. (2012). Hybrid Photovoltaic-Piezoelectric Flexible Device for Energy Harvesting from Nature. Advances in Science and Technology, 77, 297–301, [CrossRef].
Wang, H., Han, M., Song, Y., & Zhang, H. (2020) Hub: Design, manufacturing and applications of wearable triboelectric nanogenerators. Sci. [CrossRef].
Warude, S.C., Unhale, P.R., Khandagale, S.P., Waykar, A.D., Gaonkar, S.S. (2015). Harnessing of Kinetic Energy of Raindrops, International Journal of Recent Research in Civil and Mechanical Engineering (IJRRCME), 2, 1, 192-199, [CrossRef].
Which Countries Are Leading The Way With Solar Power? (2021), [CrossRef].
Xie, L., Yin, L., Liu, Y., Liu, H., Lu, B., Zhao, C., Khattab, T. A., Wen, Z., Sun, X. (2022). Interface Engineering for Efficient Raindrop Solar Cell. 16(4), 5292–5302, DOI: 10.1021/acsnano.1c10211.
Yang, H., Fan, F. R., & Wu, W. (2021) Design and engineering of high-performance triboelectric nanogenerator for ubiquitous unattended devices, [CrossRef].
Zhao, K., & Zhu, Z. (2020) Application of triboelectric nanogenerator in smart home and clothing, Frontiers, DOI: 10.3389/fmech.2020.576896.
Zhao, X., Li, C., Wang, Y., Han, W., & Yang, Y. (2021). Hybridized nanogenerators for effectively scavenging mechanical and solar energies. iScience, [CrossRef].
Document information
Published on 09/06/23
Submitted on 09/06/23
Volume 5, 2023
Licence: CC BY-NC-SA license
Share this document
Keywords
claim authorship
Are you one of the authors of this document?
