Abstract
Aim of the present work is to investigate mechanical and metallurgical characteristics of continuous wave CO2 laser welded dissimilar couple of AISI 304 stainless steel and commercially pure copper sheets in autogenous mode. Metallurgical analysis of the fusion zone has been done to understand the mixing and solidification behavior. Macroscopic examination has been carried out to observe the macro-segregation pattern of Cu, Fe and Cr rich phases in different zones, and the thickness of HAZ was found to be around 10 µm. The micro-channels formed from the steel side to weld pool describe that the copper solidifies first and provides the nucleation surface for the residual melt to grow. These tubular micro-channels formed may be due to carbide precipitation. The EDS analysis conforms the well mixing of SS and Cu inside the weld pool. The mechanical properties in terms of tensile stress found up to 201 MPa and the fracture are obtained outside the weld zone. Microhardness measurements over the fusion zone have been done to understand the keyhole growth and quenching, solidification sequence and stress distribution over the full area.
Keywords
Laser ; Welding ; Dissimilar ; Metal ; AISI 304 SS ; Copper ; Microscopy ; Precipitation
1. Introduction
The increase in popularity of use of dissimilar metal couples in process industries has opened up a vast area of research, which includes process development, parameter optimization and material development. The academic engineering fraternity is largely focused on process development and optimization for welding parameters applied to commercially available metal and alloys being used as dissimilar couple. Welding processes are chosen depending upon properties of the dissimilar couple under consideration and the properties of the product being desired for specific application [1] . Dissimilar welding of incompatible couples results in intermediate alloys of myriad compositions. Different welding process offers different levels of control over alloying. Out of all welding processes available, as laser beam welding offers a small weld bead, narrow heat affected zone (HAZ) and high penetration draw more attention.
Stainless steel (SS)–Cu dissimilar couple is extensively used in nuclear power plants, steam turbine power plant, heavy electronics, switch gears etc., due to their complementary properties like high thermal and electrical conductivity of Cu and corrosion resistance of SS. Autogenous welding of this couple is challenging because of a miscibility gap in solid state. Addition of Ni as a filler material is the best solution because of infinite mutual solubility of Ni and Cu in liquid as well as solid state, and Fe and Ni are mutually soluble. But, in cases where addition of filler material is prohibited or not feasible, the only solution left is to undertake filler-less autogenous welding operation with a objective to obtain a sound microstructure. The mechanics of different phase separation and development of various features have been explained by various workers. Rowcliffe et al. [2] studied the feasibility of using an austenitic SS and precipitation harden (ph) Cu bonded by hot isostatic pressing. Their main focus was on the performance of the intermediate bi-layer in the radio neutron-rich active environment. They observed that the ph Cu exhibited anisotropic fracture toughness and poor cracking growth resistance in the direction parallel to bi-layer.
Chen et al. [3] characterized SS–Cu dissimilar joint made by continuous CO2 laser welding. They studied the effect of energy input on the development of weld pool microstructure and interface. Their work attempted to improve upon the technique suggested by Yao et al. [4] to control the microstructure through dilution ratio altered by scarf geometry. They proposed to use minimum possible copper in the weld pool so that solidification cracking would not occur, giving better weld quality. Phanikumar et al. [5] also studied the mixing mechanism and dilution behavior of the copper in the melt. While it has been common knowledge that due to miscibility gap of Fe and Cu below the peritectoid point, the two segregate as pockets or bands in the fusion zone; researchers [3] , [4] and [5] observed that Fe and Cu segregate in an ordered manner. Fe droplets form Cu matrix or Cu droplets form in Fe matrix. Further, at higher resolution, this phenomenon repeats at micro scales. Hence, upon solidification, Fe–Cu would produce fractal repetitions because of miscibility gap. This may be taken up as a defect and can be addressed largely by addition of Ni. Alloying with Ni reduces the hot-shortness caused due to Cu, because Cu and Ni are fully soluble to each other. Suga et al. [6] explained the variation in tensile shear stress of dissimilar joint of austenitic stainless steel and pure copper by laser brazing with respect to different filler combinations like Cu–Si, Cu–Ni, Ni–Cu, Cu, Ni etc. and concluded that Ni–Cu type showed relatively high shear value compared to others.
Baghjari and AkbariMousavi [7] observed that the fusion zone microstructure and the HAZ microstructure are controlled by growth rate and temperature gradient across the fusion zone. Thus, this approach may be adopted to improve the microstructural texture of Fe–Cu based dissimilar welds. Fe in Cu or Cu in Fe segregation is essentially droplet shapes, which are conductive to offer crack resistance. Torkamany et al. [8] explained the microstructure and mechanical characteristics of weld fusion zone with effect of laser welding mode. The equiaxed grains and fine columnar dendrites form at the fusion boundary and grow toward the molten pool center.
The non-equilibrium copper rich phases highlight the problems in microstructural stability of joint. Different materials such as steel, copper, kovar alloy and aluminum are welded by Nd-YAG laser. All characteristics like mixing behavior, the microstructure, cracks, hardness and stress in the weld zone are investigated by Mai and Spowage [9] . Roy et al. [10] investigated the metallurgical and mechanical properties of Cu–SS 304 dissimilar weld by shielded arc welding method. They found phases like equiaxed, columnar, cellular dendrite structure, etc. in the weldment and observed fracture line at the HAZ of the copper side due to grain coarsening effect. Yao et al. [4] suggested the appearance of α and ε phase near the interface between intermixing zone and Cu plate increases the possibility of formation of intermetallics. Yan et al. [11] observed that the laser welding gives the smallest dendrite size in the weldment in comparison to TIG and hybrid welding. The solid solution zone near the interface and formation of different phased based on (Fe, Ni), (Fe, Cr, Ni) and (Fe, Cr) chemical system occur in diffusion bonding of SS 410 and copper with Ni interlayer. Gao et al. [12] explained the non-uniformity microstructure detect at the fusion zone and interface, which is improved by increasing the heat input in laser-arc hybrid welding. Sun and Ion [13] suggested the presence of δ-Fe in the weld zone due to insufficient time for phase transformation from δ→γ in the laser welding. The martensitic HAZ in alloy and high-carbon or medium steels may be due to the result of high cooling rate in laser welds. The only precaution to avoid excessive hardness is preheating the metals. According to Hussain et al. [14] , the austenitic phase begins to precipitate during cooling of weld zone, which is very less in laser welding.
The present experimental work focuses on some more explanations on the microstructure of SS–Cu dissimilar joint by CO2 laser to get a bigger picture. A detailed study is performed on different phases in fusion zone, HAZ, interface as well as microhardness.
2. Experimental
2.1. Materials and laser welding
In the present work, two dissimilar metals sheets such as AISI 304 stainless steel and commercially pure copper (chemical compositions of the base metals are given in Table 1 ) are taken into the consideration for welding, and their mechanical and microstructural characteristics are investigated.
| Fe | Cu | Si | C | Cr | Mn | Ni | |
|---|---|---|---|---|---|---|---|
| SS | 74.11 | – | 0.29 | – | 17.75 | 0.72 | 7.13 |
| Cu | – | 99.63 | 0.37 | – | – | – | – |
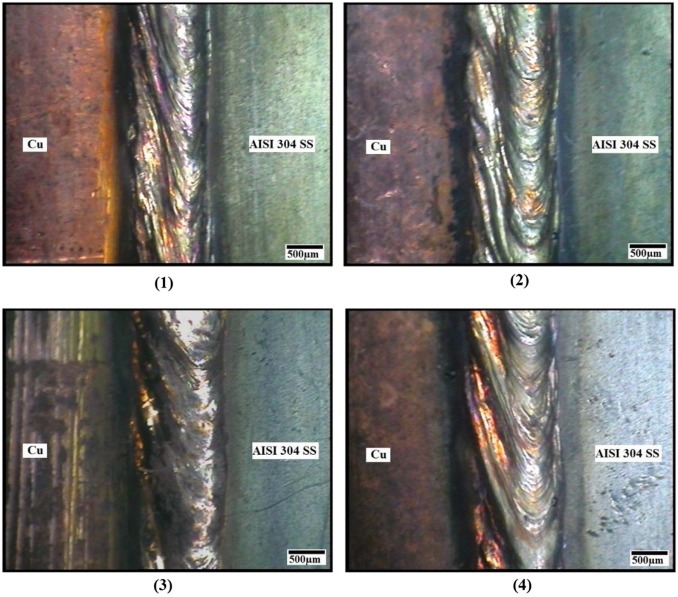
Flats of AISI 304 SS and commercially pure copper are welded in butt configuration. The welding is carried out in a “3.5 kW CO2 slab laser” continuous wave laser welding unit. The machine has a power output of 50–3500 W, wavelength of 10.6 µm. The beam used in the experiment was of a pure TEM00 mode with beam quality k > 0.96. Working conditions and different process parameters used for the laser welding are shown in Table 2 . Helium is used as shielding gas with a flow rate of 20 lpm and fed through a 5 mm diameter nozzle at an angle of 45° in the trailing mode configuration. The nozzle stand-off distance was maintained at 3 mm. Gas post flow of 5 seconds was given to prevent oxidation of the hot weld regions and to maintain the cooling rate. Initial bead on plate (BOP) experiments are performed to identify the process parameters window by means of laser coupling observations. The top surfaces of the welded samples as shown in Fig. 1 captured by optical microscope at 40× demonstrate an appreciable welding from outside observation.
| Welding parameters | Values |
|---|---|
| Laser power (kW) | 3.0, 3.5 |
| Scan speed (m/min) | 2.0, 3.0 |
| Position of laser beam | 50 µm offset toward SS Beam |
| Diameter (mm) | 0.18 |
| Beam profile | Gaussian mode |
| Focal length (mm) | 300 |
| Laser beam angle | 900 |
| Gas flow rate (lpm) | 20 |
| Focal position | At the surface |
|
|
|
Fig. 1. Top surface of welded samples. |
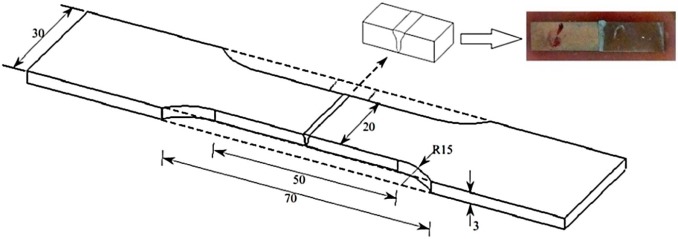
The welded samples were rectangular after welding. Hence, standard test specimen conforming to tensile test standard ASTM E8M-04 was prepared by removing extra material from the gauge length with the help of a wire EDM cutter. The scheme of cutting has been shown in Fig. 2 . The portion discarded from the sides while preparing the dogbone shape samples (of the gauge length) was used for metallographic observation. The face being observed under microscope is a transverse section of the weld normal to the welding direction.
|
|
|
Fig. 2. Schematic diagram of welding specimen. |
2.2. Characterization
The weld cross-sections are obtained by cutting with wire-EDM, and subsequent polishing. The metallurgical specimen was cleaned in an ultrasonic bath, and etched in 10% oxalic acid solution for 3 minutes at 3 Volts. Microstructure of the weld cross section was observed in a scanning electron microscope (Oxford, JEOL JSM 6084LV) and optical microscope (SEIWA). Vickers microhardness measurements were carried out with a diamond tip indenter applying 200 gf load for 10 seconds dwell time. Tensile tests are performed on an Instron® 600KN UTM as per standard ASTM E8M-04 .
3. Results and discussions
3.1. Macro and microstructure
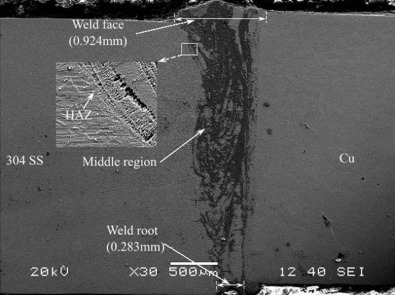
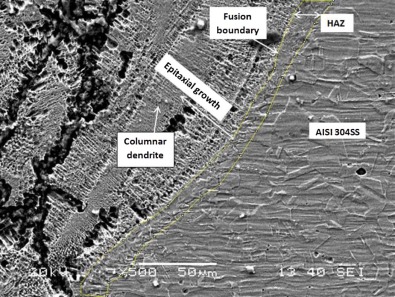
Macrographs are taken from the polished transverse section of the weld pool and are analyzed with ImageJ® software. Average area of the weld pool is found to be 1.78 mm2 , with widths of the weld pool measuring 0.924 mm, 0.645 mm and 0.283 mm approximately at weld face, middle and weld root regions respectively. The macroscopic view of pool area as well as measurements is shown in Fig. 3 , and the average width of the HAZ was found to be 10 µm. The SEM image in Fig. 4 shows the solidification growth of weld pool from the fusion boundary in SS side, the HAZ and change of phases etc. The epitaxial growth takes place from the fusion boundary toward weld pool with columnar dendrites. It is also observed that wall of the weld pool is more curved on SS side and straighter (vertical) on copper side. It has been understood that difference in thermal conductivity between Cu and SS is the reason behind the curvature of the weld pool wall. However, the curvature is not uniform along depth. Hence, there must be something more than only the thermal conductivity. The most probable parameters are Biot number and Nusselt number, which are also likely to vary along the depth due to their dependence on material state and local shape.
|
|
|
Fig. 3. Measurement of weld pool area and width at various depths. |
|
|
|
Fig. 4. Solidification growth of weld pool from fusion boundary. |
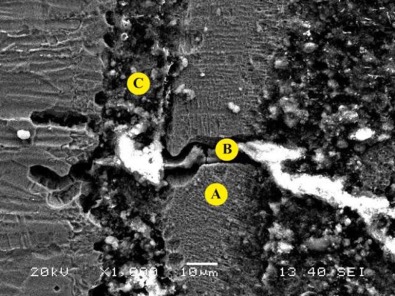
The Fig. 5 shows a vertical microchannel of approximately 22 µm and two roughly horizontal microchannels. The average width of the upper one is with 8 µm, and the lower one is with 9.5 µm. The microchannels may have formed due to mutual immiscibility of Cu and SS in molten state. Their characteristics shapes are influenced by the Reynold number of the flow active in that locality during melt flow. As the materials are immiscible and create different zones, they will reduce the strength of the joint. After etching, the vertical and the lower horizontal channels show islands running along their lengths. The upper one does not feature an island probably because of its narrower width. The islands might have formed due to microsegregation of immiscible melts into distinct zones that follow the weld flow lines (after the material around them got etched away reacting with Oxalic acid).
|
|
|
Fig. 5. SEM image of peripheral area of weld pool showing microchannel formation; the labels in yellow circles show sites where EDS was performed. |
Matsumoto et al. [15] have given experimental accord of surface tension values for SS and Cu over the temperature range 1823K–2073K. Brillo and Egry [16] have shown different surface tension values for binary alloy system of Fe–Ni, Cu–Ni and Cu–Fe because of differential Cu concentration in the surface. These differences in surface tension cause immiscibility in liquid state. Further, due to change of flow regime from laminar to turbulent and back, the phases follow the streamlines of the flow but do not intermix. This may be the controlling factor behind the undulating nature of alternating Cu and SS microchannels. The phase separation and the curved feature may reduce the tensile strength of the joint.
3.2. EDS observations
Quantitative compositional analysis with EDS is carried out for select sites in the weld pool microstructures. The observed microchannels, the weld pool boundaries and the islands are the sites of interest to understand the phenomena behind their formation. Three sites—A, B, C as shown in Fig. 5 —are chosen for EDS analysis. A is in the matrix, and B and C are in the islands of horizontal and vertical micro channels, respectively. The zone A as indicated in Fig. 5 has been referred to as the matrix, because the base material SS 304 is present predominantly as compared to the zone B and C. Zones B and C have been described as Cu micro channels. The elemental compositions are given in Table 3 .
| Site | Fe(K) | Ni(K) | Co(K) | Mn(K) | Cr(K) | Si(K) | F(K) | O(K) | Cu(K) |
|---|---|---|---|---|---|---|---|---|---|
| A | 49.96 | 7.85 | 2.31 | 1.31 | 10.59 | 1.01 | 10.64 | 5.09 | 11.24 |
| B | 6.64 | 4.55 | – | 0.30 | 2.01 | – | – | 4.97 | 81.54 |
| C | 8.84 | 2.02 | – | 0.87 | 1.57 | 0.03 | – | 7.53 | 79.12 |
Zone A is composed of stainless steel base metal interspersed with trapped copper. It is a recast region in the periphery of the melt pool. It appears to be of bainitic microstructure with a dendritic arm spacing of 1.07 µm. This region is somewhat chromium depleted. The region A and its counterpart on the other side of the horizontal microchannel exhibit epitaxial growth in multiple directions, mostly perpendicular to the copper zones. It can be inferred that in this part of the weld pool, copper solidifies first, and it provides the nucleation surface for the residual melt to grow.
Zone B is copper with entrapped steel traces, and the feature is not a bezier curve in appearance. Hence, there is a fair chance that it formed during cooling under turbulent conditions. The boundaries of the copper channel mixed with the surrounding stainless steel, but the core is retained as pure copper.
Zone C is taken at the horizontal copper microchannel, and EDS indicates that there is trace amount of silicon found, which can be attributed to the trapped steel. The absence of Si in zone B is due to extremely low steel entrapment. This zone is a sandwich of outer stainless steel, intermediate carbide precipitates and central copper.
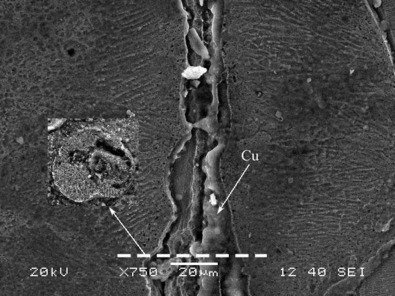
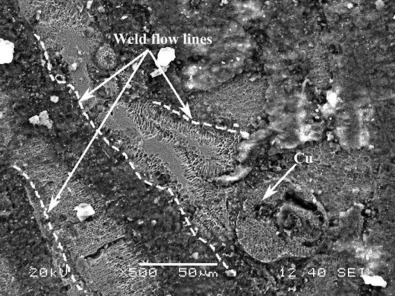
The vertical feature in Fig. 6 is a hollow tubular channel in stainless steel matrix, found after etching separately with FeCl3 and 10% Oxalic acid. This channel joins a flow line at one end. The inside hollow shape in the tubule and its correlated cross section in Fig. 7 suggest carbide precipitation inside it. EDS of the twin-lobed feature in Fig. 7 and the absence of material in the copper tubule as shown in Fig. 6 confirm it as Carbides. Initially, it is speculated that these are co-axial structures formed by micro-segregation of Cu and SS into different zones. But upon close inspection of the lobed structures, one can see that it is the result of curling of segregated front; much like an egg-roll is prepared. There are two competing phenomena acting here. One is the segregation of Cu and Fe into two fully distinct fronts due to their lower miscibility, which can occur if a peak temperature less than enough to initiate mixing and if the weld pool agitation are not sufficient. Secondly, the curling of this front is only possible if a temperature enough to promote material front movement is achieved, and a sufficient convective current is present to move the material.
|
|
|
Fig. 6. Tubular channel with cross-section. |
|
|
|
Fig. 7. Transverse section of Cu tubular channel with weld flow lines. |
Discrete columnar dendrite colonies are observed on lower/outer side of the weld flow line partition. These dendrites show sensitivity toward oxalic acid etching. Orientation of the dendrites is perpendicular to the base material, which continues up to the next flow line. Population of dendrites is more toward bottom side of the flow line, and less toward the upper side, with a distinct partition in between. In addition, the part above the partition line is not columnar, with spherical inclusions. If the solidification would have started from the center of a weld line, then the orientation of the dendrites would be perpendicular to it. In this case, it appears that the previously solidified zone provides the necessary surface to initiate solidification, is confirmed by the shapes of the dendrites. The base of a dendrite is wider than the tip, and in this case, the narrower tip remains toward the weld line. As the solidification progresses from the bottom toward the weld line, dendrites form which are depleted of Cr. Though chromium depletion has been conformed from EDS analysis, the reason for rejection of Cr from the dendrites is not understood. One possible reason may be the change of crystal structure from FCC to BCC. Solubility of Cr is greatly reduced by presence of Fe in Cu or Cu in Fe [17] . The rejection results in micro-segregation of Cr C2 in nodular form. This happens more toward the base as it is in solid state, and diffusion of the reject into the melt pool is no longer possible.
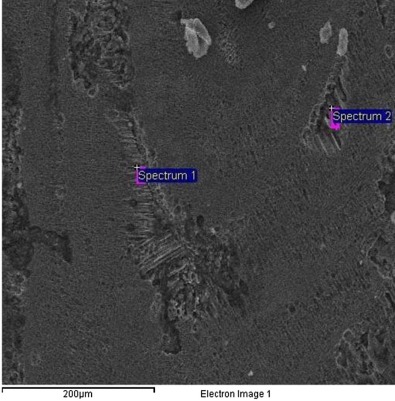
From the EDS of the area marked Spectrum 2 in Fig. 8 , the dendritic zone is found to be composed of equal amount of Fe and Cu. The Chromium percentage is at 17.5 wt%, though appearing depleted is not so. The initial Cr content was 18 0 wt% in 304 SS. Now, the zone being equally composed of SS and Cu, the net share of Cr in the mix, should be about half that in 304SS.
|
|
|
Fig. 8. Compositional analysis (by EDX) of columnar dendrites. |
Sizes of the dendrites at the two positions marked in the Fig. 8 are measured. At site 1, the average width is found to be 2.86 µm, and the average lengths are 62.68 µm for the long ones and 25.82 µm for the short ones. At site 2, the length is 38.147 µm, and width is 2.821 µm. These measurements are in agreement with that of the martensite dimensions proposed by Hatem and Zikry [18] .
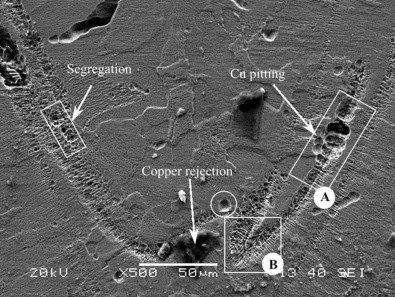
The region A marked by a rectangle in Fig. 9 shows some spherical voids after etching. These appear at the center and toward the end of a weld line. It is to be noted here that these spherical segregations in other instances were occurring at the opposite side of a dendritic colony around a weld line. But in this case, the voids are closely surrounded by dendrites in all directions, which suggest that the material present in the void provided an epitaxial surface for the dendrites.
|
|
|
Fig. 9. Solidification around weld lines. |
The region B has dendrites that are normal to the partition line. Had they started solidifying on to the channel boundary, their orientation would have been normal to the boundaries. Instead, they are normal to partition line and at various angles with the boundaries; that means there is another plane normal to the dendrites from where epitaxial growth takes place.
3.3. Microhardness
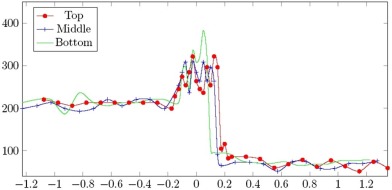
Microhardness is an indirect indicator of tensile properties of materials. Hence, its measurements are carried out across the weld at three different depths (Fig. 10 ) to reveal details about tensile strength. As the heating and cooling profiles are different at different depths, so would be the microstructure, and it influences the strength values at different zones. Typical microhardness value for stainless steel remains in the range 195–215 HV, and that for copper is 88 HV. In an ideal weld, the transition should be a straight connecting link from one side to another or a simple spline. However, in the microhardness plot, we observe four peaks interleaved with three distinct depressions with outer peaks near the HAZ. The inner peaks are roughly of same height, and their locations are marginally inner to the edges of the weld pool. The outer depressions are on the HAZ, and the central depression is on the weld line. The central depression indicates presence of softer phase, which may be due to coarser microstructure generated because of very slow cooling at the weld axis compared to the edges. Alternatively, it could be due to the presence of some soft phases, which would be forming at the end of the solidification sequence. As this trend is visible at the bottom and middle parts, it may be inferred that this is due to faster cooling rates, or due to weld pool agitation and solidification sequence.
|
|
|
Fig. 10. Microhardness profile of the welded specimen at different depths. |
With the change in cooling rate and solidification sequence of the weld pool, the grain size changes, and with change in grain size, the microhardness number changes. The microhardness number also plays a very important role in identifying the metallurgical phases. The approximate microhardness numbers for different phases in AISI 304 SS like ferrite, pearlite, bainite and martensite are 200, 250, 300 and 400, respectively. The formation of martensite phase may cause cracking, but the ferrite, pearlite and bainite phases are comparatively more beneficial for welding point of view.
The microhardness value near the top surface shows a comparatively smoother transition. All the effects observed as peaks and troughs in the middle and bottom parts are present at the top, but their intensity is being subdued. We know that conduction mode welding is known to be more effective in terms of uniform microstructure generation and the hardness [19] and [20] . The crown part of weld pool is subjected to conduction as well as keyhole mode, whereas other part is only subjected to keyhole mode. It is also seen that microhardness results have a central depression that primarily occurs at the top/crown part of the weld pool. As the temperature gradient experienced by the crown portion is smaller than that experienced by interior portion, the fluctuation in microhardness value is highest toward the root side. Nevertheless, fluctuation is also observed on the crown side too.
3.4. Tensile strength
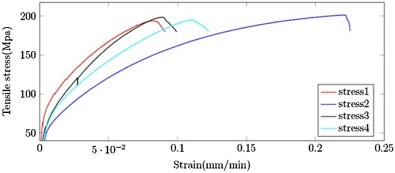
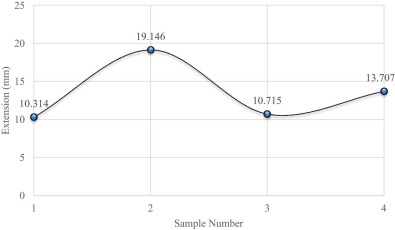
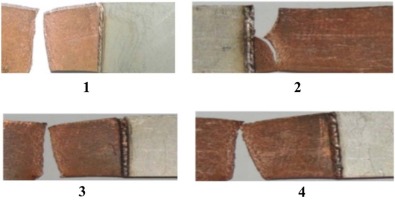
The tensile stress values of welded specimen are above 190 MPa, which is higher than the pure copper, and failure occurs away from the weld zone in copper side. The stress vs. strain graph and gauge length extension of all tensile test samples are shown in the Fig. 11 and Fig. 12 respectively, and obtained values are presented in Table 4 . The fractured samples after the tensile test are shown in Fig. 13 . The stress value is marginally higher in sample 2 in comparison to others, and the fracture that happens in the HAZ may be due to presence of substantial voids.
|
|
|
Fig. 11. Tensile test of the SS 304–Cu flat welds. |
|
|
|
Fig. 12. Extension at maximum tensile extension. |
| Sample | Tensile stress (MPa) |
|---|---|
| 1 | 190 |
| 2 | 201 |
| 3 | 195 |
| 4 | 192 |
|
|
|
Fig. 13. Fractured samples after tensile test. |
Loading at a constant strain rate of 0.01 is applied for all samples during tensile test. From Fig. 11 and Fig. 12 , it is shown that the sample 2 has more extension as well as more tensile stress compared to other samples. The marginal higher extension may be due to higher plastic deformation.
4. Conclusions
In the present work, CO2 laser welding of two dissimilar metals AISI 304 stainless steel to commercially pure copper sheets of 3.0 mm thickness, without filler metal, is studied to investigate weld metal soundness, penetration and keyhole formation. The following conclusions can be drawn from this research:
- A successful welding is carried out between AISI 304 SS and pure Cu without any filler metal by CO2 laser having acceptable weld strength of above 190 MPa.
- The microstructure analyses of the weld interface show that peripheral portion near fusion zone boundary on crown side experienced a relatively moderate cooling rate and the weld pool is mostly of nail shape. Because of differential thermal properties, it is also observed that the wall of the weld pool is more curved on SS side and straighter (vertical) on copper side. It is seen that very thin HAZ of average 10 µm is formed, and it is narrower for stainless steel side in comparison to Cu side.
- The EDS measurement carried out at different locations near microchannels gives a clear idea about size, shape and compositions of dendrite which affects the final quality of weld.
- Acceptable microhardness values across the weld pool at three different weld depths have been found to be related to cooling rates, weld pool agitation and solidification process. Hence, there is still scope for obtaining a smoother transition in microhardness values by controlling heat transfer rate and mode of welding.
References
- [1] R.E. Avery; Pay Attention to Dissimilar-Metal Welds: Guidelines for welding Dissimilar Metals; Nickel Development Institute (1991), p. 28
- [2] A. Rowcliffe, S. Zinkle, J. Stubbins, D. Edwards, D. Alexander; Austenitic stainless steels and high strength copper alloys for fusion components; J. Nucl. Mater, 258 (1998), pp. 183–192
- [3] S. Chen, J. Huang, J. Xia, H. Zhang, X. Zhao; Microstructural characteristics of a stainless steel/copper dissimilar joint made by laser welding; Metall. Mater. Trans. A, 44 (8) (2013), pp. 3690–3696
- [4] C. Yao, B. Xu, X. Zhang, J. Huang, J. Fu, Y. Wu; Interface microstructure and mechanical properties of laser welding copper–steel dissimilar joint; Opt. Lasers Eng, 47 (7) (2009), pp. 807–814
- [5] G. Phanikumar, S. Manjini, P. Dutta, K. Chattopadhyay, J. Mazumder; Characteri- zation of a continuous co2 laser-welded fe-cu dissimilar couple; Metall. Mater. Trans. A, 36 (8) (2005), pp. 2137–2147
- [6] T. Suga, Y. Murai, T. Kobashi, K. Ueno, M. Shindo, K. Kanno, et al.; Laser brazing of a dissimilar joint of austenitic stainless steel and pure copper; Welding Inter- national, no. ahead-of-print (2015), pp. 1–9
- [7] S. Baghjari, S. AkbariMousavi; Experimental investigation on dissimilar pulsed Nd: Yag laser welding of AISI 420 stainless steel to kovar alloy; Mater. Des, 57 (2014), pp. 128–134
- [8] M. Torkamany, J. Sabbaghzadeh, M. Hamedi; Effect of laser welding mode on the microstructure and mechanical performance of dissimilar laser spot welds between low carbon and austenitic stainless steels; Mater. Des, 34 (2012), pp. 666–672
- [9] T. Mai, A. Spowage; Characterisation of dissimilar joints in laser welding of steel– kovar, copper–steel and copper–aluminium; Mater. Sci. Eng. A, 374 (1) (2004), pp. 224–233
- [10] C. Roy, V.V. Pavanan, G. Vishnu, P. Hari, M. Arivarasu, M. Manikandan, et al.; Characterization of metallurgical and mechanical properties of commercially pure copper and aisi 304 dissimilar weldments; Procedia Mater. Sci, 5 (2014), pp. 2503–2512
- [11] J. Yan, M. Gao, X. Zeng; Study on microstructure and mechanical properties of 304 stainless steel joints by TIG, laser and laser-TIG hybrid welding; Opt. Lasers Eng, 48 (4) (2010), pp. 512–517
- [12] M. Gao, C. Chen, L. Wang, Z. Wang, X. Zeng; Laser-arc hybrid welding of dissimilar titanium alloy and stainless steel using copper wire; Metall. Mater. Trans. A, 46 (5) (2015), pp. 2007–2020
- [13] Z. Sun, J. Ion; Laser welding of dissimilar metal combinations; J. Mater. Sci, 30 (17) (1995), pp. 4205–4214
- [14] A. Hussain, A. Hamdani, R. Akhter; CO2 laser welding of AISI 321stainless steel ; IOP Conf. Ser, 60 (2014), pp. 12042–12047
- [15] T. Matsumoto, T. Misono, H. Fujii, K. Nogi; Surface tension of molten stainless steels under plasma conditions; J. Mater. Sci, 40 (9–10) (2005), pp. 2197–2200
- [16] J. Brillo, I. Egry; Surface tension of nickel, copper, iron and their binary alloys; J. Mater. Sci, 40 (9–10) (2005), pp. 2213–2216
- [17] V. Raghavan; Cr-Cu-Fe (chromium-copper-iron); J. phase equilibria, 23 (3) (2002), pp. 257–258
- [18] T.M. Hatem, M.A. Zikry; Modeling of Lath Martensitic Microstructures and Failure Evolution in Steel Alloys; J. Eng. Mater. Technol, 131 (2009), pp. 41207–41211
- [19] I. Felde, Z. Kálazi, B. Vero, T. Réti, G. Králik, O. Szabados; Experimental design technique for the approximation of process parameters in laser surface hardening; Fourteenth International Conference on Surface Modification Technologies (2000), pp. 360–365
- [20] M. Ahmad, J.I. Akhter, M. Akhtar, M. Iqbal, E. Ahmed, M.A. Choudhry; Microstructure and hardness studies of the electron beam welded zone of Hastelloy C-276; J. Alloys Comp, 390 (1–2) (2005), pp. 88–93
Document information
Published on 10/04/17
Licence: Other
Share this document
Keywords
claim authorship
Are you one of the authors of this document?
