Abstract
Many cities organize cultural festivals to promote their distinctiveness, boost the local economy, and enhance quality of life. However, urban spaces are packed with visitors on festival days, thus affecting accessibility to pedestrian spaces. This research examined visitor satisfaction with accessibility to pedestrian spaces during special events such as festivals. We particularly focused on the Hakata Dontaku festival, which is celebrated in Fukuoka, Japan. We studied three main elements that affect pedestrian satisfaction and perceived accessibility through walking, namely, safety, mobility, and amenities. We first analyzed previous studies and employed analytical hierarchy process to setup indicators for satisfaction measurement. Second, we determined visitor satisfaction through a survey questionnaire, which was conducted during the Hakata Dontaku festival. Third, we assessed the normality of the data set that was obtained from the questionnaire. Finally, we applied structural equation modeling. Results showed that the proposed model was a good fit, as indicated by the goodness of fit test, and the majority of indicators loaded significant values that supported their constructs. Satisfaction with amenities was found to be the most statistically significant variable that influences visitors׳ perceived accessibility during the Hakata Dontaku festival.
Keywords
Festival ; Pedestrian ; Accessibility ; SEM ; Walkability
1. Introduction
1.1. Background
In the last few decades, city-promoted festivals have become a popular instrument to create a sense of distinctiveness. In this era characterized by competitiveness at both national and international scales, many cities attract visitors by organizing cultural festivals. Researchers have determined that festivals not only help a city to preserve its local culture and history, but also enable it standout as a tourist destination. Such festivals can contribute to the urban economy, raise property values, attract commercial development, and highlight esthetic amenities in urban area (Zukin, 1995 ). Eventually, these festivals will improve citizens׳ well-being by providing free access to social recreational resources (Nelson and Prilleltensky, 2002 ) and allowing them to participate in experiences that are distinct from daily life.
Festivals attract a great number of visitors. Although festivals are short-term events, municipalities should provide facilities to ensure visitor satisfaction, which in turn will create a positive impression of the city. The scope of characteristics of these facilities ranges from tangible aspects, such as well-planned programs, comfortable amenities, and esthetics, to intangible aspects, such as convenience, security, information, and staff (Cole and Chancellor, 2009 ). Satisfied festival attendees may become repeat visitors and provide positive advertising through word of mouth (Cole and Chancellor, 2009 ). Therefore, local governments should pay close attention to improving visitor satisfaction through understanding and developing relevant indicators.
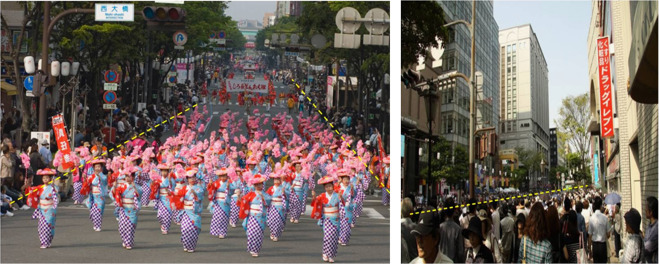
Holding a festival changes the atmosphere of urban spaces significantly, and the venue of such a festival tends to record large footfalls. The Hakata Dontaku festival, which features a two-day parade along the city׳s pedestrian routes, attracts more than two million people. Figure 1 (retrieved from Fukuoka Now and Fukuoka Dreaming websites) shows a pathway along the parade route packed with visitors. The large number of people could create accessibility or walkability (note that we use these two words inter-changeably) issues for visitors. This paper focuses on a rarely examined issue, which is visitor satisfaction with pedestrians paces in terms of perceived accessibility during festivals. Accessibility to pedestrian spaces is strongly related to both the tangible and intangible aspects of visitor satisfaction, such as comfortable amenities, convenience, and security, as mentioned before.
|
|
|
Figure 1. Full packed of visitors on the pathway during festival day. |
A number of approaches can be used to assess pedestrian accessibility. Pikora et al. (2001) employed an observation-based too land checklist to collect data in the field. They found that on normal days, personal safety, esthetics, and mobility were important elements that influenced walking. Based on their findings, this study raises the question on whether these factors also affect perceived accessibility during the festival day. We answer this question by investigating the relationship among the above-mentioned factors via structural equation modeling (SEM).
1.2. Theoretical background
Previous studies found that perceived accessibility was affected by the variables elaborated as follows:
The word “satisfaction” is generally defined as accumulative construct that is affected by user expectations and performance perceptions in any given period (Johnson et al., 1995 ). Furthermore, the urban planning literature defines perception as the process of attaining awareness and understanding sensory information. In this study, pedestrian satisfaction with accessibility is related to the perception of the ease of accessing an opportunity (social activities) based on the fulfillment of walking needs in urban spaces. Hagen (2006) noted that pedestrians have various needs; health, mobility, and safety are categorized as basic needs, and the other needs include reliability, convenience, comfort, and esthetic. The perceptions of these features produce different reactions in each pedestrian.
Researchers have focused on the relationship between urban elements in terms of pedestrian spaces that could affect accessibility. Every pedestrian needs a safe place to walk. In urban setting, this means safety from auto mobiles and crimes. Craig et al. (2002) identified the absence of obstacles in pedestrians׳ desired routes, maintenance level, road safety, personal security, directness, and selection of routes as the most important factors that influence walking. Giles-Corti and Donovan (2002) examined perception of traffic safety and found that the presence of a side walk within walking distance was positively associated with walking. De Bourdeaudhuij et al. (2003) revealed that perceptions about traffic are associated with walking for exercise or recreation, as well as to get to and from places. A study by Saelens et al. (2003) indicated that pedestrian/traffic safety and crime safety were strongly correlated with individual walkability.
Handy (2005) identified the environmental factors that promote walking, including prevalence of recreational facilities, community cohesion, and physical features enhancing image ability, and legibility. Humpel et al. (2002) founded an evidence of accessibility and safety being associated with walking for pleasure. Walkability refers to the quality of walking condition. It encompasses the quality of pedestrian features, including pathway conditions, safety, traffic speed and flow, comfort, and convenience (Pucher et al., 2011 ). Studies (Leslie et al ., 2005 ; Rastogi et al ., 2011 ) have shown that physical attributes influence walking; these attributes include pathway quality, zebra crossing, street furniture, safety measures, and adjacent traffic flow. Tsukaguchi and Vandebona (2007) emphasized that the level of pedestrian satisfaction, such as the distance that pedestrians are willing to walk, is related to the quantity and level of service offered by the pedestrian infrastructure. Thus, an appropriate design can increase quality and quantity of walking.
The pedestrian level of service (LOS) methodology used by Gallin (2001) is another approach, which provides an overall measure of walking conditions on a route, path, or facility examining design factors (e.g., path width, obstructions), location factors (e.g., connectivity), and user factors (e.g. pedestrian volume). A weighting system is then applied, which recognizes that certain factors are more important to pedestrians. Pedestrians are usually exposed to accident risks, adverse weather, thieves, and other hazards that make people tend to avoid walking long distances. People tend to walk further and more frequently if they are provided with high-quality side walk facilities (Kelly et al., 2011 ; Sisiopiku and Akin, 2003 ).
A proper design of facilities can encourage walking without compromising safety and convenience (Handy, 1996 ; Shriver, 1997 ). Khisty (1995) evaluated the qualitative elements of pedestrian spaces from users׳ perspective. Their evaluations were based on subjective variables such as visual attractiveness, comfort, system continuity, safety, and security. A study on a sample of Australian adults found that two categories of local environmental attributes are associated with an increased likelihood of walking: an esthetically pleasing environment (e.g., ratings of pleasant and attractive natural features) and a convenient environment. Carnegie et al. (2002) also founded that esthetics and a “practical” (similar to “convenient”) environment are associated with walking. Giles-Corti and Donovan (2002) founded that access to open spaces and perceived esthetic attributes were associated with an overall index of walking. The LOS approach has also been used to assess pedestrian trip quality based on more qualitative factors such as enclosure, articulated buildings, and proximity to traffic (Jaskiewicz, 2000 ). Aspects of the urban landscape contribute to the overall walking experience. Natural elements promote interactions and positive experiences for pedestrians. The presence of public seating can encourage leisure walks, especially for the elderly and disabled (Eunji et al., 2011 ). Pedestrians have different needs, which makes the availability of water fountains or vending machines, trash bins, and trees for weather protection necessary (Bahari et al., 2012 )
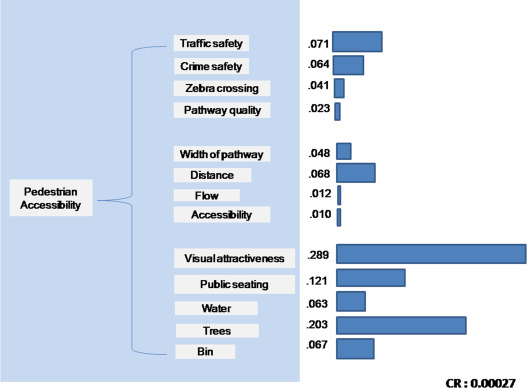
Based on the previous studies, we employed analytical hierarchy process (AHP). This method enables us to derive priorities among criteria that affect pedestrian accessibility. First, we develop a pair wise comparison matrix for each criterion, followed by scoring approach using intensity of value comparison. Next, we normalize the resulting matrix, averaging the values in each row to obtain the corresponding rating and calculate the consistency ratio (CR). Finally, the weight of average rating for each criterion is calculated. As summarized in Figure 2 , our CR value (0.00027) is acceptable; based on Saaty (1980) , the value of CR is<0.1. The weight of criteria ranging from the highest (0.289) to the lowest (0.010) rank is used for visual attractiveness, trees, public seating, traffic safety, distance, crime safety, bin, water/vending machine, width of pathway, zebra crossing, pathway quality, flow, and accessibility.
|
|
|
Figure 2. A hierarchy and weight estimation result. |
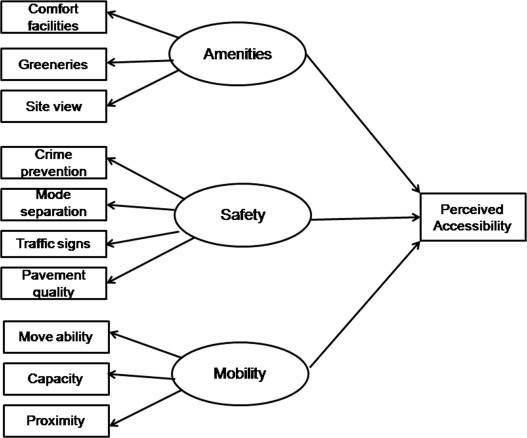
Based on the AH P result, we proposed a model in the next stage, which is presented in Figure 3 . We modified the AHP criteria based on the situation on festival days and classified it into the following three areas:
|
|
|
Figure 3. Proposed conceptual model. |
Amenities . The amenities parameter includes availability of comfort facilities (benches, vending machines, bins, etc.), presence of greenery, and interesting scenery.
Safety . Safety is one of the important parameters. In this study, safety pertains to the feeling of being safe and secure from crime, from being hit by a bicycle or a vehicle, and from slips and falls on the pathway.
Mobility . The mobility parameter revaluates pedestrian flow, pathway capacity, and proximity from transit point.
Perceived accessibility. This parameter evaluates the overall perception of visitors in terms of safety, mobility, and amenities during festival days.
The proposed model would be tested using SEM.
2. Field survey
2.1. Site overview
The survey was carried out in Fukuoka City, the capital of Fukuoka Prefecture, which is located along the northern shore line of Kyushu Island, Japan. It is a warm city with a unique character and a diverse range of attractions for tourists. Many festivals are held throughout the year, and the city is considered one of the most livable cities in the world. Yamakasa Gion and Hakata Dontaku are two well-known festivals in the city. These festivals takeplace in the streets and attract millions of visitors annually. They differ significantly in terms of their timing. The main activity of Yamakasa Gion (also called Oiyamakasa ) occurs in the early morning hours (4:59 am), whereas the Hakata Dontaku parade starts at 3 pm. We selected Hakata Dontaku in our case study because its timing coincides with the time of the day when pedestrians commonly walk along the city streets.
The questionnaire survey was given two days during the Hakata Dontaku parade in 2012 and 2013. More than 2 million local and international visitors visit the city to attend this event. This festival began in 1179 when local merchants organized a parade to celebrate the New Year. The term Dontaku is derived from the Dutch word Zondag, which means “Sunday” or “holiday.” Currently, the festival is held every year on May 3 to 4. The local government designated this festival as an Intangible Cultural Property.
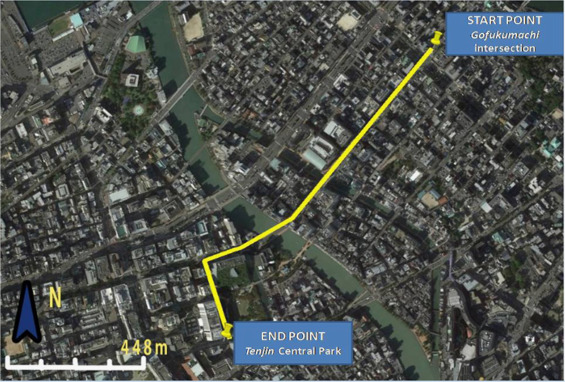
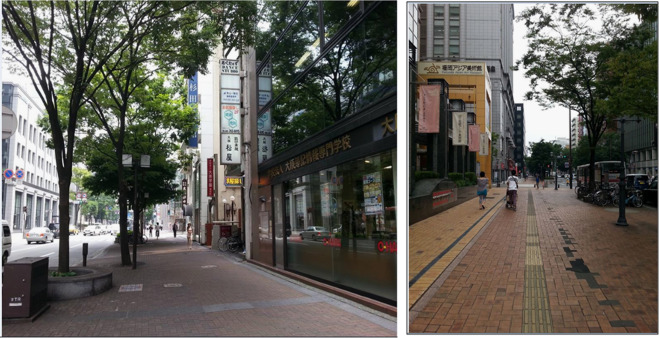
The survey was conducted in pedestrian spaces along the 3 km route of the Dontaku parade (Figure 4 ), which traverses Gofukumachi Street, Meiji Dori Street, to Tenjin Central Park. The roads pass through the Central Business District of Fukuoka City and are classified as high-standard arterial roads. Buildings that house offices, shops, and service establishments are located along the path of the parade. As the width of the sidewalks is adequate (±13 m), these roads (Figure 5 ) are considered pedestrian friendly.
|
|
|
Figure 4. Route of Hakata Dontaku parade festival. |
|
|
|
Figure 5. Pedestrian space along the festival route. |
2.2. Data description
The respondents׳ decision was affected by their availability and interest to participate in the survey. One thousand questionnaires were distributed for two years, of which 600 were returned. However, because of missing data, only 480 completed questionnaires could be used for the analysis.
The respondents were asked to rate the following elements (see Table 1 ) that enhance accessibility or encourage walking activities in pedestrian spaces during the festival days: amenities (comfort facilities, greenery, and surrounding view), safety (crime prevention, mode separation, traffic signs, and pavement quality), and mobility (movability, capacity, and proximity to the transit point). The questionnaire also includes questions that relate to the respondents׳ socio demographic characteristic information with regard to their choices of transport modes, and their last transit points. As Table 2 shows, most visitors who attended the festival in the last two years were16 to 59 years old.
| Variables | Indicators |
|---|---|
| Amenities (1=strongly dissatisfied to 4=strongly satisfied) | 1. Availability of comfort facilities (benches, vending machine, bin, etc.) is very helpful during walking. |
| 2. Presence of greenery creates convenient walking environment since it provides shade and shielded. | |
| 3. Interesting scenery (buildings and architecture) creates pleasant walking activity. | |
| Safety (1=strongly dissatisfied to 4=strongly satisfied) | 1. Feeling safe from any crimes when walk along pedestrian spaces on festival days. |
| 2. Feeling safe from being hit by bicycle since the mode separation sign is available. | |
| 3. Feeling safe from traffic accident since traffic light is working and installing properly. | |
| 4. Feeling safe from slip/fall accident since the pavement has a good quality. | |
| Mobility (1=strongly dissatisfied to 4=strongly satisfied) | 1. Walking freely and ease on pathway during festival days |
| 2. Width of pathway accommodates large number of visitor and allows them to maintain distance among other visitors. | |
| 3. Finding a tolerable distance from transit point to pedestrian spaces along festival route. | |
| Perceived accessibility (1=strongly dissatisfied to 4=strongly satisfied) | Overall perception on pedestrian accessibility in terms of amenities, safety and mobility |
| Characteristics | Survey period 2012 (N =200) | Survey period 2013 (N =280) |
|---|---|---|
| Percentage | Percentage | |
| Gender | ||
| Female | 50.20% | 51.00% |
| Male | 49.80% | 49.00% |
| Age | ||
| <15 | 8.00% | 10.00% |
| 16–29 | 33.60% | 34.30% |
| 30–59 | 43.90% | 35.00% |
| >60 | 14.50% | 21.10% |
| Transportation mode | ||
| Private Vehicles | 7.00% | 6.10% |
| Bus | 22.90% | 30.40% |
| Train | 59.30% | 56.30% |
| Walking | 10.90% | 7.00% |
As light difference in the percentage was observed between female and male visitors. They seemed to prefer public transportation (mainly the train) to reach the location of the parade.
3. SEM
SEM is a multivariate technique that combines aspects of multiple regression and factor analysis to estimate series of inter-related relationships (Hair et al., 1998 ). It was first used to research travel behavior in 1980, and its use expanded thereafter. Currently, SEM can be performed with the use of a user-friendly software. Rather than being exploratory, SEM is used to confirm a proposed hypothesis or model.
In recent years, SEM has been applied widely in various transportation studies. In the field of perception, SEM was employed by Stuart et al. (2000) to determine how a series of rating attributes for the New York subway system (e.g., crowding, personal security, cleanliness, predictability of services, etc.) are related to customers׳ ratings of value and overall satisfaction with the system. Jakobson et al., (2000) investigated causality among the acceptance of road pricing, behavioral intention reducing car usage, and feelings related to fairness and infringement on personal freedom. Friman and Garling (2001) explored satisfaction with public transportation employees, service reliability, clarity of service information, and comfort by applying SEM to stated preference data.
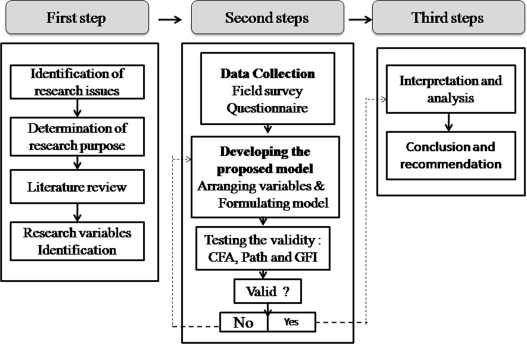
The diagram in Figure 6 shows how research is conducted with the use of SEM as an analysis tool. The initial approach consists of identification of issues, determination of research purposes, literature review, identification of research variable, and arranging variable. This research is based on AHP in arranging variable for proposed model. In the second approach, we collected the data through a field survey. The obtained data were extracted in to the proposed model, and then we tested the validity of the data set. The last approach involves interpretation, analysis, conclusion, and recommendation.
|
|
|
Figure 6. The step approaches in SEM. |
SEM has three main analytical tools: confirmatory factor analysis (CFA), path analysis, and goodness of fit analysis (GFI) (Joreskog, 1973 ; Keesling, 1972 ). Maximum likelihood (ML) was used in this research, which involves collecting data based on feelings and perception using ordinal (Likert) scale. To maximize the solution of the ML, this research performed a normality test before moving on to the primary analysis.
ML estimation requires a sufficient sample size. Stevens (1996) stated that the sample size for ML estimations should be at least 15 times the number of observed variables. Assuming we employ 10 observed variables or parameters, we would require at least 150 samples for this study. This requirement was conveniently fulfilled, as our sample size (n ) was 480. The proposed model was analyzed using AMOS21, an SEM software developed by SPSS.
3.1. Normality test
As a requirement for conducting SEM, the normality test was performed for the normal distribution of the data set. Table 3 shows the mean, standard deviation, and result of the normality test using the data from the survey. The skewness and kurtosis value (1.2 to −0.24) show that the data have a normal distribution. Hence, we confirmed the variable eligibility for the next steps of SEM.
| Variables | Code of indicators | Mean | Std | Assessment of normality | |
|---|---|---|---|---|---|
| Dev | Skewness | Kurtosis | |||
| A. Exogenous | |||||
| Amenities | X8 Comfort facilities | 2.904 | 0.612 | −0.131 | 0.125 |
| X9 Greenery | 2.9 | 0.664 | −0.246 | 0.16 | |
| X10 Site views | 2.843 | 0.679 | −0.248 | 0.186 | |
| Safety | X1 Crime prevention | 2.979 | 0.698 | −0.729 | 1.216 |
| X2 Mode separation | 2.945 | 0.643 | −0.098 | −0.248 | |
| X3 Traffic signs | 2.775 | 0.674 | −0.506 | 0.543 | |
| X4 Pavement quality | 2.883 | 0.618 | −0.257 | 0.483 | |
| Mobility | X5 Move ability | 2.972 | 0.805 | −0.771 | 0.323 |
| X6 Capacity | 2.787 | 0.623 | −0.514 | 0.77 | |
| X7 Proximity | 2.785 | 0.624 | −0.58 | 0.93 | |
| B. Endogenous | |||||
| Y1 Perceived accessibility | 3.043 | 0.548 | 0.187 | 0.873 | |
3.2. CFA
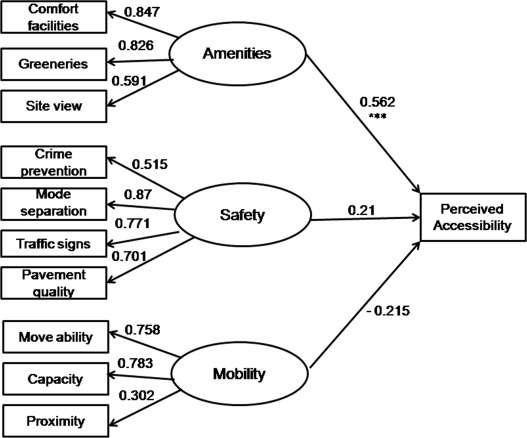
CFA clarified the validity of interrelationships between the indicators and confirmed whether each constructal ready suit the proposed model. Hair et al., 1998 considered that values larger than 0.5 indicates that the indicators could support each construct. Figure 7 presents the summary of the CFA. The overall loading factor reveals an acceptable value for supporting each construct.
|
|
|
Figure 7. Factor and path loadings. |
Results indicated that during the festival, the amenities are correlated with availability of comfortable facilities such as benches, vending machines, and public toilets (0.847); the presence of greenery/trees (0.826); and esthetic views of the buildings located along the path (0.591). Visitor safety is significantly correlated with crime prevention through the presence of many police officers (0.515); mode separation that clearly distinguishes lanes for bikers to prevent traffic accidents (0.870); correctly installed and functioning traffic signs (0.771); and good-quality, non-slippery pavement (0.701). Visitor mobility is strongly correlated with movability (0.758) and pedestrian path capacity (0.783). However, it is less significantly correlated with proximity to the transit point (0.302).
These results are in line with the field observations. We followed the path of the Dontaku parade and captured all features that fulfilled the pedestrians׳ needs. Next, we elaborate the indicators that are significantly correlated with the constructs (safety, mobility, and amenities).
Results of the measurement model revealed that the perceived amenity of festival attendees was significantly correlated with comfort facilities, greeneries, and scenery. We recorded the availability of permanent street furniture along Meiji Dori Street, which includes benches, vending machines, and garbage cans. Gehl (2010) stated that pedestrian amenities could heighten the image of a street and add an incentive for people to linger along it. The greenery along Meiji Dori Street not only provided shade and shielded visitors from rain, but also added visual interest. Moreover, the sheer variety of buildings and the beautiful architecture along Meiji Dori Street such as the Hakata Theater and the Hakata Riverain enhanced the street׳s attractiveness. Therefore, users׳ high satisfaction with safety, mobility, and amenities even during crowded events (such as the Dontaku Festival) could clearly be attributed to the ample and well-designed pedestrian space along Meiji Dori Street.
With regard to safety, crime prevention through the presence of many police officers is the dominant indicator according to the survey. The number of visitors increases during the festival, thereby necessitating added safety measures, which can be fulfilled by the presence of security officers. Many factors, including community violence and crime, are considered deterrents to walking in urban spaces. The safety factor or fear of crime has been frequently cited as the highest constraint to walking by vulnerable groups and people who often walk. Fortunately, the organizers of the Hakata Dontaku Festival area ware of this fact, as many police officers are stationed along the path of the parade.
Moreover, the sidewalk infrastructure affected users׳ feeling of safety. The route of the Dontaku parade is located in Fukuok business district and stretches 1.3 km along the arterial road of Meiji Dori . Thus, the route lies along a high-quality road and has good side walk infrastructures. This side walk infrastructure resulted from collaboration among the national Safe Pedestrian Area Project Prefectural Public Safety Commission and road management agencies.
The program was initiated in 2003 in response to various accidents in pedestrian spaces in commercial districts, which resulted in injury or death. The project involved the installation of traffic signs for drivers and barrier-free signals for the elderly and disabled; demarcation of space for traffic, pedestrians, and bikers; and changes to sidewalks, widening them and making the mnon-slippery.
The side walk along Meiji Dori Street can accommodate people despite the significant increase in the number of visitors during the festival. Visitors can walk freely and easily along the 13 m wide side walk on festival days. This research found that perceived mobility on festival days was significantly related with pedestrian movement and side walk capacity. Hayduk (1978) defined personal space as the space that individual humans actively maintain around themselves into which others cannot intrude without arousing discomfort. Pedestrians tend to be protective of their personal space. The density of available pedestrian space on festival days did not cause any complaints. Mostly, the visitors came to watch the parade in pairs or groups of 3 to 4 people, such as a family and/or friends. Hall (1966) determined that a person with family and friends in his/her group is comfortable with a distance of 0–1.2 m between him/her and the other people in the group. The corresponding distance for groups that include strangers is 4.0–10.0 m.
3.3. Path analysis
Having accomplished a valid measurement model, path analysis or SEM was employed to test the predicted relationships between the constructs of the proposed model. As shown in Figure 7 , weak statistical significant links exist between perceived accessibility and safety (0.210 p Value=0.179) as well as between perceived accessibility and mobility (−0.215), p Value 0.221. However, the perceived accessibility and amenities shows a strong relationship (0.562) supported by an acceptable p Value (<0.001).
3.4. GFI
Although the co-relationships along the path did not show 99% significance, the overall proposed model shows a good statistical fit. Table 4 shows the goodness of fit measures, which consist of five measurements. The first is chi-square/degree of freedom. Our chi-square value (616.151) exceeded the acceptable value (<5).
| GFI measures | Structured model | Acceptables values |
|---|---|---|
| Chi Square (df) | 616.151 | <5 (Wheaton et al., 1997 ) |
| NFI | 0.954 | >0.09 (Hair et al., 1998 ) |
| CFI | 0.964 | >0.09 (Hair et al., 1998 ) |
| GFI | 0.965 | >0.09 (Hair et al., 1998 ) |
| RMSEA | 0.073 | <0.1 (MacCallum et al ., 1996 ; Hooper et al ., 2008 ) |
However, the chi-square value tends to be ignored because of the large sample size. The second is the normed fit index or NFI (0.954). The third and fourth are the CFI (0.964) and GFI (0.965), respectively. As the values for NFI, CFI, and GFI exceed 0.9, the results confirm that we have a good-fitting model. The fifth measurement is the root mean square residual (0.073) that has an acceptable value (<0.1). All these measurements confirm that the good fit of the proposed model.
4. Highlighted findings
This section presents our two findings with regard to satisfaction and perceived accessibility to pedestrian spaces during the Hakata Dontaku festival based on SEM analysis. Our results reveal differences in pedestrian perceptions between normal days and festival days.
4.1. CFA results
The CFA revealed that on the festival days, proximity to the transit point is unrelated with visitors׳ perceived accessibility in terms of mobility. The distance to the destination point could significantly increase the walking level. Many scholars define 400 m as an acceptable distance for comfortable walking. However, this standard does not differentiate the purposes of a trip. In our study, the purpose of the trip is leisure. Pedestrians used nine transit points or each the festival space located along Meiji Dori Street. The distance to Nakasu Kawabata Station is the shortest, whereas that to Hakata Station (1500 m) is the longest. Although Hakata Station is far, most respondents chose it because it is considered the transportation hub of Fukuoka City. In addition, the road that leads to the festival venue is attractive and has various amenities. Thus, the pedestrians in our survey did not mind walking a long distance because they encountered interesting views and comfortable facilities on their way to the festival venue.
4.2. Path analysis results
Among the three elements (safety, mobility, and amenities), amenities contributed significantly to the enhancement of perceived accessibility for pedestrians during the festival. Pedestrians are recognized to have a slower speed compared with vehicle users. Therefore, their needs and experiences on the street were different. Pedestrians were able to observe the environment in detail because they walked at a low speed. During the Hakata Dontaku Festival, there search team found that the pedestrians tended to value the availability of amenities the most. In fact, their needs for amenities affected their perception of accessibility.
Peoples׳ needs in pedestrian spaces are varied and subjective. Deriving inspiration from the hierarchy of needs theory, Hagen (2006) classified pedestrians׳ needs in a public space. He pointed out that after their basic need is fulfilled, pedestrians would focus on achieving their next level of needs—health, safety, reliability, and convenience—before moving on to their needs for amenities. After being satisfied with safety and mobility, the pedestrians tend to shift their focus to amenities. However, this shift does not mean that they are unsatisfied with the existing amenities, but simply that they want additional amenities. The festival venue is the street. Thus, pedestrians not only walk but also line up along the pavement. Therefore, adequate space for seating is one of the fore most considerations of the visitors during the festival.
5. Conclusion
This paper applied SEM to confirm and quantify the relationship between satisfaction and perceived accessibility to pedestrian spaces during the Hakata Dontaku Festival in Fukuoka, Japan. Amenities, safety, and mobility are the three elements that could influence pedestrian walkability. Each of these elements was constructed by using some indicators. Amenities were constructed using comfort facilities, greenery, and site views. Safety was constructed in terms of crime prevention, mode separation, traffic signs, and pavement quality. Mobility was constructed using movability, capacity, and proximity. The results of the goodness of fittest indicated that the proposed model is a good fit. Furthermore, the majority of the indicators loaded a significance value that supported their constructs.
The following are the two interesting findings of this research: first, CFA revealed that on festival days, pedestrians tend to ignore the long distance from or to the transit point. Second, the results of the path analysis show that amenities are the most significant latent variable that influences perceived accessibility during festival days.
These findings provide an evidence that the fulfillment of pedestrians׳ basic needs affects their satisfaction and perceived accessibility. Municipalities play a major role in supporting urban attributes that may influence walking, accessibility, and attractiveness of the pedestrian environment both on normal and special days (such as festival days). Nevertheless, these research findings suffer some limitations related to the time series, sample size, and indicators that support the constructs of the variables. Therefore, we propose to conduct longitudinal research with a larger sample size in future studies. A more detailed determination of the constructs of variables that affect pedestrian accessibility, particularly on festival days, is also necessary.
Acknowledgment
This research is supported by Grant-in-Aid for scientific research (A), Grant number 26249085 (Leader: Atsushi Deguchi), Japan Society for the Promotion of Science, Japan .
References
- Bahari et al., 2012 Bahari, N.I., Arshad, A.K., Yahya, Z., 2012. Pedestrians perception of the sidewalk facilities in Kuala Lumpurs commercial area. Int Sustain. Civ. Eng. J. 1 (2), 28–36
- Carnegie et al., 2002 M.A. Carnegie, A. Bauman, A. Marshall, M. Mohsin, V. Westley-Wise, M.L. Booth; Perceptions of the physical environment, stage of change for physical activity and walking among Australian adults; Res. Q. Exerc. Sport, 73 (2002), pp. 146–155
- Cole and Chancellor, 2009 S.T. Cole, H.C. Chancellor; Examining the festival attributes that impact visitor experience satisfaction and re-visits intention; J. Vacat. Mark., 15 (2009), pp. 323–333
- Craig et al., 2002 C.L. Craig, R.C. Brownson, S.E. Cragg, A.L. Dunn; Exploring the effect of the environment on physical activity: a study examining walking to work; Am. J. Prev. Med., 23 (2002), pp. 36–43
- De Bourdeaudhuij et al., 2003 I. De Bourdeaudhuij, J.F. Sallis, B. Saelens; Environmental correlates of physical activity in a sample of Belgian adults; Am. J. Health Promot., 18 (2003), pp. 83–92
- Eunji et al., 2011 Eunji, Ha andYongjin Joo Chulmin Jun, 2011. Green score: an evaluation scheme for pedestrian environment. Geospatial World Forum.
- Friman and Garling, 2001 Friman and Garling, 2001. Journal of Retailing and Consumer Services 8 (2), 105–114.
- Gehl, 2010 J. Gehl; Cities for People, Island Press, Washington D.C. (2010)
- Giles-Corti and Donovan, 2002 B. Giles-Corti, R.J. Donovan; Socioeconomic status differences in recreational physical activity levels and real and perceived access to a supportive physical environment; Prev. Med., 35 (2002), pp. 601–611
- Gallin, 2001 Gallin, N., 2001. Quantifying pedestrian friendliness – guidelines for assessing pedestrian level of service. Presented at Australia: walking the 21st century.
- Hagen, 2006 Hagen, M. Van 2006. Wensen van reizigers: piramide van Maslov. In: Een gouden markt – waarom marketing van openbaar vervoer moet & loont, KPVV Rotterdam.
- Hair et al., 1998 J.F. Hair, R.E. Anderson, R.L. Tatham, W.C. Black; Multivariate Data Analysis; (5th ed.)Prentice Hall, New Jersey (1998)
- Hall, 1966 E.T. Hall; The Hidden Dimension; Anchor books, Doubleday & Company, New York, USA (1966)
- Hayduk, 1978 L.A. Hayduk; Personal space: an evaluation and orienting overview; Psychol. Bull., 85 (1978), pp. 117–134
- Handy, 2005 Handy, S. 2005. Critical assessment of the literature on the relationships among transportation, land use, and physical activity.
- Handy, 1996 S.L. Handy; Urban form and pedestrian choices; Transp. Res. Record., 1552 (1996), pp. 135–144
- Hooper et al., 2008 Hooper, D.; Coughlan, J.; Mullen, M.R. (2008) Structural equation modeling: guideline for determining model fit, Electron. J. Bus. Res. 6 53-60.
- Humpel et al., 2002 N. Humpel, N. Owen, E. Leslie; Environmental factors associated with adults׳ participation in physical activity: a review; Am. J. Prev. Med., 22 (2002), pp. 188–199
- Jakobson et al., 2000 C. Jakobson, S. Fujii, T. Garling; Determinants of private car users׳ acceptance of road pricing; Transp. Policy, 7 (2000), pp. 153–158
- Jaskiewicz, 2000 F. Jaskiewicz; Pedestrian Level of Service Based on Trip Quality; Transportation Research Circular E-C019 TRB National Research Council, Washington, D.C (2000)
- Johnson et al., 1995 M.D. Johnson, E.W. Anderson, C. Fornell; Rational and adaptive performance expectation in a custoumers satisfaction framework; J. Consum. Res., 21 (1995), pp. 695–707
- Joreskog, 1973 K.G. Joreskog; A General Method for Estimating a Linear Structural Equation System; Academic Press, New York (1973)
- Keesling, 1972 Keesling, J.W., 1972. Maximum Likelihood Approaches to Causal Analysis, Ph. D. dissertation, University of Chicago, United States.
- Kelly et al., 2011 C.E. Kelly, M.R. Tight, F.C. Hodgson, M.W. Page; A comparison of three methods for assessing the walkability of the pedestrian environment; J. Transp. Geogr., 19 (2011), pp. 1500–1508
- Khisty, 1995 C.J. Khisty; Evaluation of pedestrian facilities: beyond the level-of-service concept; Transp. Res. Record, 1438 (1995), pp. 45–50
- Leslie et al., 2005 Leslie E. et al, Residents׳ perceptions of walkability attributes in objectively different neighbourhoods: a pilot study. Journal of Health and Place II (2005) 227-236, elsevier.
- MacCallum et al., 1996 R.C. MacCallum, M.W. Browne, H.M. Sugawara; Power analysis and determination of sample size for covariance structure modeling; Psychol. Methods, 1 (1996), pp. 130–149
- Nelson and Prilleltensky, 2002 G. Nelson, I. Prilleltensky; Doing Psychology Critically. Making a Difference in Diverse Settings; EEUU Palgrave Mcmillan, New York (2002)
- Pikora et al., 2001 Pikora, T.J., Giles-Corti, B., and Donovan, R. 2001. How far will people walk to facilities in their local neighbourhoods Australia: walking the 21s t Century, Proceeding. Perth, West Australia.
- Pucher et al., 2011 J. Pucher, R. Buehler, M. Seinen; Transp. Res. Part A, 45 (2011), pp. 451–475
- Rastogi et al., 2011 Rastogi, R., Thaniarasu, I., Chandra, S., 2010. J. Transp. Eng. 137 (10), 687–696
- Saelens et al., 2003 B. Saelens, J.F. Sallis, J. Black, D. Chen; Preliminary evaluation of neighborhood-based differences in physical activity: an environmental scale evaluation; Am. J. Public Health, 93 (2003), pp. 1552–1558
- Saaty, 1980 T.L. Saaty; The Analytic Hierarchy Process; McGraw-Hill, New York (1980)
- Sisiopiku and Akin, 2003 V.P. Sisiopiku, D. Akin; Pedestrian behaviors at and perceptions towards various pedestrian facilities: an examination based on observation and survey data; Transp. Res. Part F: Traffic Psychol. Behav., 6 (2003), pp. 249–274
- Shriver, 1997 K. Shriver; Influence of environmental design on pedestrian travel behavior in four Austin (TX, USA) neighborhoods; Transp. Res. Record, 1578 (1997), pp. 65–73
- Stevens, 1996 Stevens J., 1996, Applied Multivariate Statistics for the Social Science, Lawrence Erlbaum Associates, Mahwah, New Jersey, United States.
- Stuart et al., 2000 K.R. Stuart, M. Mednick, J Bockman; A structural equation model of consumer satisfaction for the New York City subway system; Transp. Res. Record, 1735 (2000), pp. 133–137
- Tsukaguchi and Vandebona, 2007 Tsukaguchi, Hiroshi Upali Vandebona (2007) Comparison of attitudes toward walking in Japanese cities. In: Proceedings of the Eastern Asia Society for Transportation Studies. Vol. 6.
- Wheaton et al., 1997 B. Wheaton, B. Muthen, G. Summers; Assessing reliability and stability in panel models; Sociol. Methodol., 8 (1997), pp. 84–136
- Zukin, 1995 Zukin S., 1995. The cultures of cities, Blackwell Publishers, Oxford, United Kingdom Associates, Mahwah, New Jersey, United States.
Document information
Published on 12/05/17
Submitted on 12/05/17
Licence: Other
Share this document
Keywords
claim authorship
Are you one of the authors of this document?
