Abstract
The aviation industry found that a number of engine power-loss events were related to the ice crystal icing, and the research on ice crystal icing had gradually attracted the attention of scholars. In this work, the compressor and ice crystals ingested are regarded as study objects, and the trajectories of particles are calculated based on the Lagrangian approach. Moreover, the two-way coupling method is applied to solve the heat and mass transfer process between ice crystals and the flow field. The variation of particle diameter and temperature under different MVD (Medium Volume Diameter), RH (Relative Humidity) and TWC (Total Water Contents), and the variation of temperature, velocity and pressure of internal flow field are also studied. The result indicates that the MVD, RH and TWC play an important role in the ice crystals motion. Moreover, the temperature and velocity of internal flow field are also greatly affected by the three parameters while the pressure is little affected. In addition, without considering the ice crystal icing, the ice crystals ingested by the compressor would reduce the total temperature at the outlet of compressor, and improve the isentropic efficiency and mass flow rate.
Keywords: Ice crystal icing, particle trajectory, compressor, numerical simulation
1. Introduction
With the development of modern civil aircraft, engine power loss events at high altitude caused by unknown reasons occur frequently. Since 1990, more than 100 engine power loss events have occurred [1]. Based on the investigation of time, height and place of these events, Manson [2,3] found engine icing was the root. And later he proposed that the mixed phase was a necessary condition for ice crystal icing. As the research advanced, scholars reached an agreement in that the icing mechanism of ice crystals is different from that of supercooled droplets. When the ice crystals strike the surface of aircraft, they would not adhere to this surface but rebound to the air. And under the influence of high temperature of compressor, the ice crystals would melt into the mixture of water and ice, which might adhere to the surface of blades and flow channel, and freeze later. While most of droplets inside the compressor would not freeze because the temperature of droplets is heated above the freezing point. Icing may cause engine power loss, compressor stall and other hazards [4]. Meanwhile, blade damage, engine surge and other hazards may occur if the ice adhered on the blade falls off.
The experimental methods based on ice wind tunnel are important methods to study ice crystal icing. Scholars from NASA (National Aeronautics and Space Administration) and NRC (National Research Council of Canada) firstly carry out the related research. Their research includes the influence of LWC (Liquid Water Content)/TWC on the process of ice crystal icing [5], the erosion effect of ice crystals hitting the ice surface [6] and the evolution state from droplet to ice crystal [7]. Other institutions have also conducted the ice crystal icing research [8,9]. Although the institutions above have achieved many excellent results, wind tunnels are costly and experiments need cumbersome preparation work.
Compared with the experimental methods, numerical methods have been an important means to study ice crystal icing because of their low cost, short cycle and high repeatability. Presently, study based on numerical methods needs to calculate the background air flow field, the ice crystal trajectory, the ice crystal impact characteristics, the ice crystal icing thermodynamics and ice shape. Considering that the accuracy of ice crystal trajectory calculation directly affects the accuracy of the whole ice crystal icing calculation, it has always been a hot issue for scholars. The existing numerical methods could be divided into the Lagrangian method and Eulerian method. The Lagrangian method is based on Newton's second law to solve the trajectory of a single ice crystal particle. While the Eulerian method regards particles and air as a uniform multiphase flow, and calculates the particle trajectory indirectly. Both methods are wildly used in numerical calculation of icing. Villedieu modified the heat transfer model and drag force model based on the existing supercooled droplet icing model, and the sphericity was used to consider the influence of the shape of non-spherical particles [10]. Moreover, the impact and erosion effects, the influence of sphericity on ice crystal trajectory and heat and mass transfer process were considered by Norde in the numerical model [11]. Iuliano analyzed the influence of sphericity on the ice crystal particle trajectory, verified three different ice crystal trajectory calculation models based on Euler method, and analyzed the differences between the calculation results and experimental values [12]. In the meantime, the research objects gradually changed from cones and airfoils to three-dimensional complex structures with the development of numerical methods. Grift and Aouizerate used the Lagrangian method to simulate ice crystal icing on compressor blades, three-dimensional engine inlets and single-stage compressor blades [13,14].
With the study advanced in cloud and fog characteristics, scholars find that the background flow field is greatly affected by the heat and mass transfer between the ice crystal and flow field [15,16]. At present, it could be found that the most of existing work was performed on one-way coupling method. And there are few published research results on the ice crystal trajectory considering the two-way coupling between flow field and particle in the engine. In this work, a method based on Lagrangian description was used to simulate the movement of ice crystals in the compressor, and the two-way coupling method was applied to solve the heat and mass transfer process between ice crystal particles and flow field.
2. Mathematical model
In this work, the background air flow field is simulated, and the mass equation of continuous phase is given by:
|
|
(1) |
which is the velocity of air, is the density of gas, and is the mass source added to the continuous phase mass equation.
The momentum equation is given by:
|
|
(2) |
which is the air pressure, is the stress tensor, and is the external body force that arises from the interaction with the discrete phase.
And the energy equation is given by:
|
|
(3) |
where is the total energy, is the effective conductivity, is the diffusion of species, is the sensible heat of species, and is the volumetric heat sources from the discrete phase.
It is worth mentioning that, in this work, several assumptions are made to reduce the computation. First, the ice crystal particle has no deformation, its sphericity is maintained at 1. Second, the interaction of ice crystals in motion is ignored, as well as the collision effect between ice crystals. Third, the air and the water vapor are treated as ideal gas.
The particle motion is influenced by several forces, such as virtual mass, gravity and pressure gradient force. Because of the high ratio of particle density and air density and the high-speed rotating motion, these forces are much smaller than the drag force. The particle motion equation is simplified as:
|
|
(4) |
where is the particle mass, is the particle velocity, is the drag force of particle, and is the force on particle that arises due to rotation of the reference frame.
The drag force of particle is given by:
|
|
(5) |
where is the dynamic viscosity of air, and is the density of particle, and the drag coefficient is given by:
|
|
(6) |
where is the relative Reynolds number, which could be obtained by:
|
|
(7) |
And the forces of particle generated by rotation are given by:
|
|
(8) |
|
|
(9) |
where and are the forces on the particle in the Cartesian X and Y directions, respectively. and are the particle and fluid velocities in the Cartesian Y direction, is the RPM, and are the particle and fluid velocities in the Cartesian X direction.
Under the influence of high temperature environment, the ice crystals in the compressor might melt, evaporate and sublimate. As a result, the ice crystals would exist in multiple phases, and the corresponding heat and mass transfer methods would also be different.
When the temperature of particle is lower than the ice crystal melting temperature ( K), it exists in the form of ice crystal, the mass exchange between particle and flow field mainly caused by the sublimation on the crystal surface. The mass of ice crystal sublimation and the heat transfer relationship between ice crystal and flow field are given by:
|
|
(10) |
|
|
(11) |
where is the temperature of air, is the water vapor diffusion coefficient, is the mass sublimated on ice crystal surface, is the specific heat of ice crystal, and are the latent heats of fusion and evaporation. And Splading mass number, Nusselt number and Sherwood number are provided in Eqs. (12), (13) and (14), respectively:
|
|
(12) |
|
|
(13) |
|
|
(14) |
where and are water-vapor mass fractions at the particle surface and at the outside of the water-vapor layer surrounding the particle respectively, which could be obtained in Eq. (15):
|
|
(15) |
where and are the molar mass of vapor and air, , and are the vapor pressure of water, water vapor saturation pressure and air pressure, respectively. And the diffusivity of the vapor specie is given by:
|
|
(16) |
where K, Pa, and the laminar diffusion coefficient of water vapor is 2.26 e-5 m2/s.
When the temperature of particle is equal to the melting temperature of ice crystal (K), the particle is in the mixed phase of ice and water, and the particle temperature remains constant till the particle is completely melted. The mass exchange may occur at the particle surface by evaporation, and the mass change of the ice crystal by evaporation is given by:
|
|
(17) |
The mass of the melted part of the ice crystal is given by:
|
|
(18) |
where is the mass of ice in the particle, is fusion mass-flow rate, and is the evaporating mass-flow rate.
When the temperature of particles is higher than the melting temperature ( K), in this state, the particle has completely become droplets. The mass exchange may occur at the particle surface by evaporation, and the expressions are given by:
|
|
(19) |
|
|
(20) |
In the two-way coupling calculation, the influence of particles on the air flow field is substituted into the continuous phase equation in the form of source term, and the mass source term produced by particles is given by:
|
|
(21) |
The momentum source term produced by particles is given by:
|
|
(22) |
The energy source term produced by particles is given by:
|
|
(23) |
where is the initial mass flow rate of the particle injection, is the initial mass of the particle, is the mass change of particle, is the time step, is the latent heat at reference condition, is the mass of the particle on cell entry, is mass of the particle on cell exit, is the heat capacity of the particle, and is the reference temperature.
3. Case study
Aiming at studying the influence of ingested ice crystals on the working characteristics of compressor, and the motion of ice crystals, a compressor and ice crystals are regarded as the research object. The parameters of compressor are shown in Table 1. And the model and mesh distribution of the compressor are shown in Figure 1. The Spalart-Allmaras turbulence model has been widely used in the field of aerospace due to strong universality, easy convergence, low calculation cost and good calculation accuracy. It is selected as the turbulence model in this work. In addition, the sliding mesh method is chosen to solve the rotating problem due to its high accuracy. And the hexahedron cells are used to partition the calculation region. Moreover, the mesh near the blade surface and rotor tip are refined to better capture the details of the flow field. The amount of mesh in the rotor domain is about 470,000, while the amount of mesh in the stator domain is about 380,000. The values of total temperature and the total pressure assumed at the inlet are 298.15 K and 101,325 Pa. In addition, the static pressure was specified at the compressor outlet. And the no slip and adiabatic conditions were applied on the hub, shroud, and blade surfaces.
| Number of blades | Aspect ratio | Blade top clearance | |
|---|---|---|---|
| Stator blade | 36 | 1.26 | 0.5% blade height. |
| Rotor blade | 36 | 1.19 | 0.2% blade height |

| |
| (a) Geometric model | |

| |
| (b) Computational grids | |
| Figure 1. Computational model of compressor | |
The compressor is a high-speed rotating machine. With the work of compressor blades, the air is heated and pressurized. As a result, the mass change of ice crystal might occur in the compressor by evaporation, melting and sublimation, and the flow field inside the compressor is a high-speed rotating motion state with multiple phases. Therefore, it is necessary to study the change laws of ice crystal in the compressor. The calculation conditions are shown in Tables 2, 3 and 4.
| TWC (g/m3) | RH (%) | |||
|---|---|---|---|---|
| 10 | 20 | 30 | 40 | |
| 4.7 | Case A11 | Case A21 | Case A31 | Case A41 |
| 9.4 | Case A12 | Case A22 | Case A32 | Case A42 |
| 14.1 | Case A13 | Case A23 | Case A33 | Case A43 |
| 18.8 | Case A14 | Case A24 | Case A34 | Case A44 |
| TWC (g/m3) | RH (%) | |||
|---|---|---|---|---|
| 10 | 20 | 30 | 40 | |
| 4.7 | Case B11 | Case B21 | Case B31 | Case B41 |
| 9.4 | Case B12 | Case B22 | Case B32 | Case B42 |
| 14.1 | Case B13 | Case B23 | Case B33 | Case B43 |
| 18.8 | Case B14 | Case B24 | Case B34 | Case B44 |
| TWC (g/m3) | RH (%) | |||
|---|---|---|---|---|
| 10 | 20 | 30 | 40 | |
| 4.7 | Case C11 | Case C21 | Case C31 | Case C41 |
| 9.4 | Case C12 | Case C22 | Case C32 | Case C42 |
| 14.1 | Case C13 | Case C23 | Case C33 | Case C43 |
| 18.8 | Case C14 | Case C24 | Case C34 | Case C44 |
3.1 The influence of RH
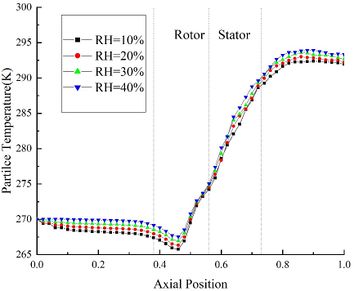
The change of ice crystal temperature under different RH is shown in Figure 2(a). Comparing the results of Case A14, A24, A34 and A44, it could be found that the particle temperature at the same axial position is positively correlated with RH. This is because the evaporation and sublimation effects of ice crystals decrease with the increase of RH. At the inlet of rotor area, the particle temperature of Case A14 is 0.9 K lower than the initial temperature. While in the stator area, the ice crystal temperature exceeds the ice crystal melting temperature (273.15 K). And at the outlet of compressor, the particle temperature of Case A44 is 1.4 K higher than that of Case A14.
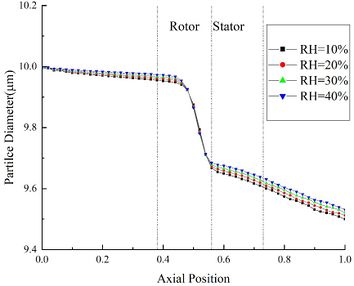
The change of ice crystal diameter under different RH is shown in Figure 2(b). It could be found that the diameter of particle decreases continuously during its movement. And the diameter is positively correlated with RH. In the rotor area, the density of particle increases due to melting, resulting in a significant decrease in ice crystal diameter. It is proved that the mixed phase of ice crystals is mainly distributed in the front edge of compressor stator. Besides, in the compressor stator area, most ice crystals have melted completely, and the density is basically unchanged. At the compressor outlet, the ice crystal diameter of Case A44 is 0.04 μm higher than that of CaseA14.
| |
| (a) Particle temperature | |
| |
| (b) Particle diameter | |
| Figure 2. Effect of varying RH on different parameters | |
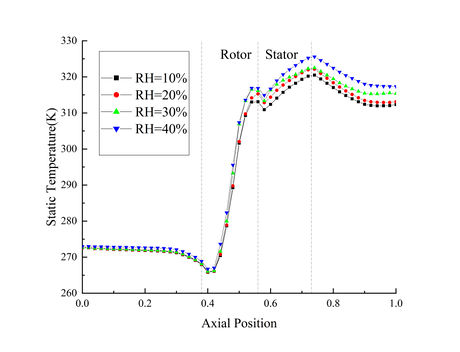
The temperature distribution of the internal flow field is shown in Figure 3(a). In the front area of the compressor, the flow field temperature curves under different RH coincide basically. At the inlet of the rotor area, the flow field temperature of Case B44 is 0.9 K higher than that of Case B14. Besides, in the rotor area, the flow field temperature increases rapidly under the work of blades, and the influence of RH on the flow field temperature increases. Furthermore, at the outlet of the compressor, the flow field temperature of Case B44 is about 5 K higher than that of Case B14.
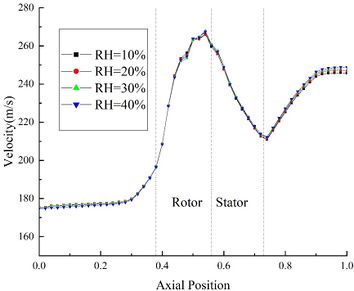
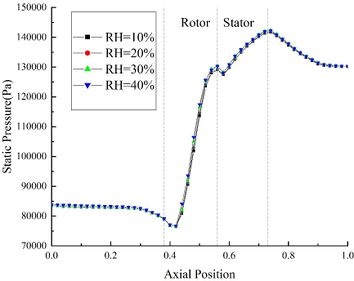
The velocity distribution and pressure distribution of the internal flow field are shown in Figures 3(b) and 3(c) respectively. It could be found that the velocity is little affected by the change of RH. At the outlet of the compressor, the velocity of Case B44 is only 2.1m/s higher than that of Case B14. And the pressure distribution curves under different RH conditions coincide basically.
| (a) Static temperature | |
| |
| (b) Velocity | |
| |
| (c) Static pressure | |
| Figure 3. Effect of RH on the compressor aerodynamic parameters | |
The contours of the flow filed temperature distribution in the compressor is shown in Figure 4. In the front area of the compressor, due to the low flow field temperature, the evaporation and sublimation effect of ice crystals are weak, hence the RH has little effect on the internal temperature distribution of the compressor. In the rear area of the compressor, there are obvious differences in the internal temperature distribution of the compressor under different RH. In this area, the high-temperature area expands with the RH increases.

| |

| |
| (a) RH=10% | |

| |
| (b) RH=20% | |

| |
| (c) RH=30% | |

| |
| (d) RH=40% | |
| Figure 4. Temperature contours of different RH (50% blade height) | |
3.2 The influence of MVD
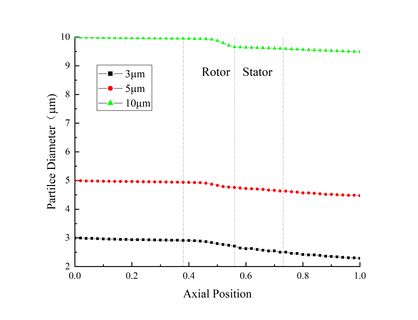
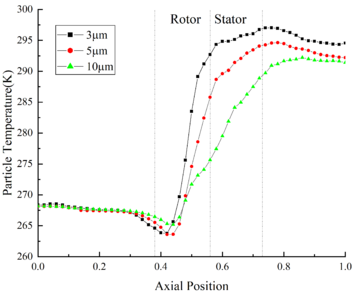
In order to study the variation law of ice crystals under different MVD, the calculation results of Case A14, B14 and C14 are used for comparison. The change of ice crystal temperature under different MVD is shown in Figure 5(a). At the inlet of rotor area, the ice crystal temperature of Case A14 is 1.8 K higher than that of Case C14. In the rotor area, the ice crystals are heated up by the high temperature flow field, and the temperature rises rapidly. At the outlet of the compressor, the ice crystal temperature of Case C14 is 3.1 K higher than that of Case A14. What could be found from the above results is that the ice crystal temperature is greatly affected by the change of MVD.
The change of ice crystal particle diameter under different MVD is shown in Figure 5(b), in which the diameter has been decreasing during the particle movement. At the outlet of compressor, the particle diameter of Case A14 is 9.48 μm, and the diameter loss is 5.2% compared with the initial diameter. While the particle diameter of Case B14 and Case C14 are 4.46μm and 2.28μm, which diameter losses are 10.8% and 24% respectively. It could be found that particles with smaller diameter have stronger heat and mass transfer effect.
| |
| (a) Particle temperature | |
| (b) Particle diameter | |
| Figure 5. Effect of varying MVD on different parameters | |
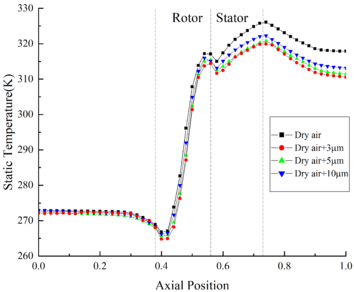
In order to obtain the influence of ice crystal diameter on the internal flow field, the calculation results of Case A14, B14 and C14 are used for comparison. The temperature distribution of the internal flow field is shown in Figure 6(a). In the front area of compressor, whether the ingestion of ice crystals or not has little influence on the flow field temperature. At the inlet of the rotor area, the temperature of flow field without ice crystals is only 0.7 K higher than that of Case C14. In the stator area, the flow field temperature rises rapidly, which makes the evaporation and sublimation effects of ice crystals enhanced. In addition, at the outlet of the compressor, the flow field temperature of Case C14 is 7.3K lower than that of flow field without ice crystals.
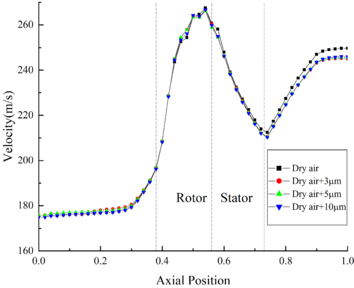
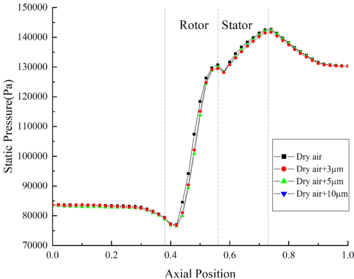
The velocity distribution of the internal flow field under different MVD is shown in Figure 6(b). Compared with the velocity of flow field without ice crystals, the velocity of flow field with ice crystals decreases significantly, while the velocity curves under different MVD conditions coincide basically. It could be found that the velocity of internal flow field is slightly affected by the change of MVD. The internal pressure distribution of flow field under different MVD is shown in Figure 6(c). It could be found that the pressure of flow field is basically not affected by the change of MVD.
| |
| (a) Static temperature | |
| |
| (b) Velocity | |
| |
| (c) Static pressure | |
| Figure 6. Effect of MVD on the compressor aerodynamic parameters | |
The contours of the flow filed temperature distribution are shown in Figure 7. The temperature distribution of internal flow field is obviously different under different MVD. The high-temperature area of the internal flow field of Case C14 is significantly shrunk compared with the flow field without ice crystals. Besides, the high-temperature area of Case A14 is not much different from that of the flow field without ice crystals.

| |

| |
| (a) Dry air | |

| |
| (b) 3μm ice crystal | |

| |
| (c) 5μm ice crystal | |

| |
| (d) 10μm ice crystal | |
| Figure 7. Temperature contours of different MVD (50% blade height) | |
3.3 The influence of TWC
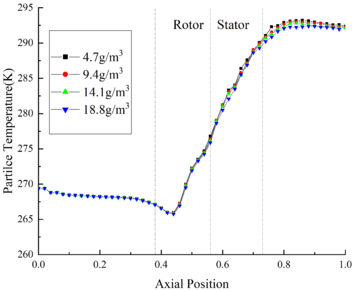
In order to study the variation law of ice crystals under different TWC, the calculation results of Case A11, A12, A13 and A14 are used for comparison. The change of ice crystal temperature under different TWC is shown in Figure 8(a). It could be found that the ice crystal temperature is little affected by the change of TWC. In the front area of the compressor, the ice crystal temperature curves under different TWC conditions coincide basically. At the outlet of the compressor, the ice crystal temperature of Case A44 is only 0.3 K lower than that of Case A14.
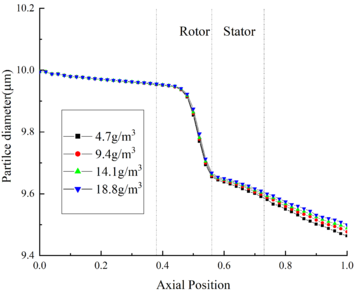
The change of ice crystal diameter under different TWC is shown in Figure 8(b). The ice crystal diameter is little affected by the change of TWC. In the front area, the ice crystal diameter curves under different TWC conditions coincide basically. While in the rotor area, the ice crystals melt, causing the density increase, and resulting in a large decrease in the ice crystal diameter. At the outlet of the compressor, the difference between the ice crystal diameter in Case A44 and Case A14 is less than 0.1μm.
| |
| (a) Particle temperature | |
| |
| (b) Particle diameter | |
| Figure 8. Effect of varying TWC on different parameters | |
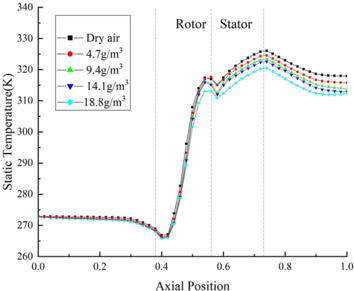
The temperature distribution of flow field under different TWC is shown in Figure 9(a). The calculation result of Case B11, B12, B13 and B14 are used for comparison. It could be found that ingesting ice crystals could decrease the temperature of flow field. In the front area, the difference between the flow field temperature under different TWC is negligible. In the rotor area, the temperature of the internal flow field of the compressor increases rapidly. Besides, at the outlet of the compressor, the temperature of flow field without ice crystals is 5.3 K higher than that of Case B14.
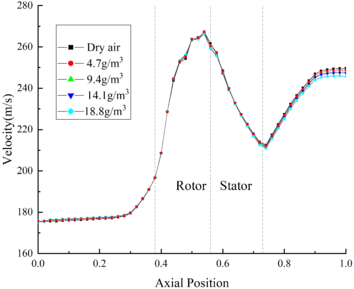
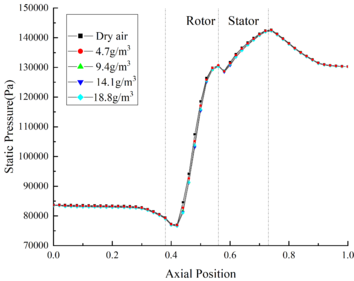
The velocity distribution of flow field under different TWC is shown in Figure 9(b). The velocity of flow field is negatively correlated with TWC. In the front area, the difference between the flow field velocity under different TWC conditions is negligible. Besides, at the outlet of compressor, the velocity of Case B11 is 4.8 m/s higher than that of Case B14. The pressure distribution of the flow field under different TWC is shown in Figure 9(c). It could be found that the pressure of flow field is little affected by the change of TWC, the pressure curve of the internal flow field under different TWC conditions coincides basically.
| |
| (a) Static temperature | |
| |
| (b) Velocity | |
| |
| (c) Static pressure | |
| Figure 9. Effect of TWC on the compressor aerodynamic parameters | |
The contours of the flow filed temperature distribution in the compressor is shown in Figure 10. In the front area of the compressor, the internal temperature distribution of the compressor under different TWC is basically the same. In the rotor area, the compressor temperature increases rapidly. The compressor temperature distribution is obviously different under different TWC. With the increase of TWC, the reduction of temperature provided by ice crystals increases, and correspondingly, the high temperature region of the internal flow field decreases.

| |

| |
| (a) 18.8g/m3 | |

| |
| (b) 14.1g/m3 | |

| |
| (c) 9.4g/m3 | |

| |
| (d) 4.7g/m3 | |
| Figure 10. Temperature contours of different TWC (50% blade height) | |
3.4 Effect of ice crystals on compressor efficiency
After ingesting ice crystals, the compressor would do work on the air and the ingested ice crystals. And the efficiency calculation expression of compressor is given by:
|
|
(24) |
|
|
(25) |
|
|
(26) |
|
|
(27) |
|
|
(28) |
where is the isentropic compression work, is the actual compression work, is the air compression work, is the vapor compression work, is the water to air ratio, is the compressor torque, is the air mass flow rate at outlet, and are the specific heat capacity of air and water vapor respectively, and are the total pressure at the outlet and inlet, is total temperature at inlet, and are the specific heat ratio of air and water vapor respectively.
In order to study the effect of MVD on the compression performance of compressor, several conditions are used to calculate the compressor performance, and the parameters for these working conditions are specified as follows: the total temperature at inlet is 288.15 K, the rotor speed is 17,188 r/min, the TWC is 18.8 g/m3 and the back pressures are 130000 Pa and 120000 Pa, respectively. The calculation results are shown in Tables 5 and 6.
| MVD | Condition | Mass flow rate (kg/s) | T at outlet (K) | Efficiency | Difference |
|---|---|---|---|---|---|
| Dry air | 0.5737 | 349.18 | 0.823 | - | |
| 3μm | Air+crystal | 0.581 | 347.05 | 0.843 | 2.43% |
| Air+water | 0.579 | 348.80 | 0.837 | 1.70% | |
| 5μm | Air+crystal | 0.5772 | 347.35 | 0.838 | 1.82% |
| Air+water | 0.5757 | 349.11 | 0.833 | 1.2% | |
| 10μm | Air+crystal | 0.5727 | 351.37 | 0.831 | 0.97% |
| Air+water | 0.571 | 352.10 | 0.828 | 0.60% |
| MVD | Condition | Mass flow rate (kg/s) | T at outlet (K) | Efficiency | Difference |
|---|---|---|---|---|---|
| Dry air | 0.575 | 345.35 | 0.820 | - | |
| 3μm | Air+crystal | 0.582 | 332.51 | 0.839 | 2.31% |
| Air+water | 0.5756 | 334.19 | 0.831 | 1.34% | |
| 5μm | Air+crystal | 0.576 | 336.10 | 0.826 | 0.7% |
| Air+water | 0.5732 | 337.83 | 0.822 | 0.2% | |
| 10μm | Air+crystal | 0.5737 | 340.36 | 0.821 | 0.1% |
| Air+water | 0.5731 | 341.21 | 0.818 | -0.2% |
The results indicate that the ingestion of ice crystals has a great influence on the working characteristics of the compressor. Under the specific conditions, the ingestion of ice crystals would reduce the total temperature at the outlet of compressor and increase the mass flow rate. In addition, the decrease of total temperature and the increase of mass flow rate are negatively correlated with the diameter of ice crystal. Moreover, if the diameter of the crystal is too large, the efficiency improvement provided by the cooling effect of ice crystal would not offset the momentum loss caused by the particle drag force.
4. Conclusion
The internal flow field of the compressor is a three-dimensional, high-speed rotating flow field, and the movement trajectory and the change in the movement process are a very complex process. Hence, the ice crystal icing needs to be studied in combination with the working characteristics of the compressor. In this work, the influence of important parameters such as MVD and TWC on the variation of ice crystals and the performance of compressor are investigated. Based on the investigations, the following conclusions could be obtained:
(1) The variation of ice crystal is greatly affected by the MVD, TWC and RH. Besides, the temperature and the velocity of internal flow field are greatly affected by the MVD, RH and TWC, while the pressure of internal flow field is basically unaffected.
(2) Affected by the compressor, the variation trend of ice crystal temperature is similar to that of internal flow field. At the front area, the variation of ice crystal diameter and temperature is not obvious. However, in the rotor area, the temperature of ice crystal would rise dramatically and might melt. As a result, the mix phase of ice crystals are mainly distributed in the front edge of the stator.
(3) Ingestion of ice crystal would have a great influence on the working characteristics of the compressor. Without considering the icing of ice crystals in compressor, the calculation results show an augmentation in the efficiency and a reduction in the temperature at outlet for the TWC increases or the MVD decreases.
Acknowledgments
The authors wish to acknowledge the financial support for this work by Open Fund of Key Laboratory of Icing and Anti/De-icing (Grant NO. IADL20190306), Key research projects of Civil Aviation Flight University of China (Grant NO. ZJ2019-02) and Student Science and Technology Innovation Fund Project (Grant NO.X2021-5).
References
[1] Bravin M., Strapp J., Mason J. An investigation into location and convective lifecycle trends in an ice crystal icing engine event database. SAE Technical Paper 2015-01-2130, 2015.
[2] Mason J.G., Strapp W., Chow P. The ice particle threat to engines in flight. 44th AIAA Aerospace Sciences Meeting and Exhibit, 9-12 January, Reno, Nevada, 2006.
[3] Mason J.G., Chow P., Fuleki D.M. Understanding ice crystal accretion and shedding phenomenon in jet engines using a rig test. Journal of Engineering for Gas Turbines & Power, 133(4):041201, 2011.
[4] Veres J., Jorgenson P., Wright W. A model to assess the risk of ice accretion due to ice crystal ingestion in a turbofan engine and its effects on performance. 4th AIAA Atmospheric and Space Environments Conference, 25-28 June, New Orleans, Louisiana, 2012.
[5] Struk P., Currie T., Wright W., Knezevici D. Fundamental ice crystal accretion physics studies. SAE Technical Paper, 2011-38-0018, 2011.
[6] Kott B., Struk P.M., Bartkus T.P. A study of ice-crystal icing erosion using the NASA icing research tunnel and propulsion systems laboratory. AIAA AVIATION 2020 FORUM, June 15-19, 2020.
[7] Struk P.M., Tsao J.C., Bartkus T.P. Plans and preliminary results of fundamental studies of ice crystal icing physics in the NASA propulsion systems laboratory. 8th AIAA Atmospheric and Space Environments Conference, AIAA 2016-3738, 2016.
[8] Baumert A., Bansmer S.E., Bacher M. Implementation of an innovative ice crystal generation system to the Icing Wind Tunnel Braunschweig. 53rd AIAA Aerospace Sciences Meeting, AIAA 2015-1225, 2015.
[9] Baumert A., Bansmer S., Trontin P., Villedieu P. Experimental and numerical investigations on aircraft icing at mixed phase conditions. International Journal of Heat and Mass Transfer, 123:957-78, 2018.
[10] Villedieu P, Trontin P, Chauvin R. Glaciated and mixed phase ice accretion modeling using ONERA 2D icing suite. 6th AIAA Atmospheric and Space Environments Conference, 2014.
[11] Norde E., Van der weide E.T.A., Hoeijmakers H.W.M. Eulerian Method for ice crystal icing. AIAA Journal, 56(1):222-34, 2018.
[12] Iuliano E., Montreuil E., Norde E., Van der Weide E.T.A., Hoeijmakers H. W. M. Modelling of Non-Spherical Particle Evolution for Ice Crystals Simulation with an Eulerian Approach. SAE Technical Paper Series, 2015.
[13] Grift E., Norde E., Van der Weide E., Hoeijmakers H.W.M. Computational Method for Ice Crystal Trajectories in a Turbofan Compressor. SAE Technical Paper, 2015-01-2139, 2015.
[14] Aouizerate G., Charton V., Balland M., Senoner J.M., Trontin P., Laurent C. Ice Crystals Trajectory Calculations in a Turbofan Engine. Atmospheric and Space Environments Conference, 2018.
[15] Davison C.R., MaCleod J.D., Chalmers J.L. Droplet Evaporation Model for Determining Liquid Water Content in Engine Icing Tunnels and Examination of the Factors Affecting Liquid Water Content. 9th AIAA Atmospheric and Space Environments Conference, 2017.
[16] Tsao J.C., Struk P., Bartkus T.P. Development of a Coupled Air and Particle Thermal Model for Engine Icing Test Facilities. SAE International Journal of Aerospace, 8(1):15-32, 2015.Document information
Published on 15/12/21
Accepted on 02/12/21
Submitted on 28/09/21
Volume 37, Issue 4, 2021
DOI: 10.23967/j.rimni.2021.12.001
Licence: CC BY-NC-SA license
Share this document
Keywords
claim authorship
Are you one of the authors of this document?
