1. Introduction
The reinforcement impregnation process in Liquid Composite Moulding is usually modelled using Darcy’s law, which states that the volume average flow velocity is dependent on the pressure gradient , the fluid viscosity , and the permeability tensor of the porous medium :
|
|
(1) |
By coupling Darcy’s law (Equation 1) with the continuity equation (Equation 2), it is possible to numerically solve LCM mould filling problems, therefore predicting possible locations of insufficient preform impregnation.
|
|
(2) |
Although this methodology allows the determination of dry spot formation, the dynamics associated with smaller voids, contained in between or inside fibre tows, are not properly accounted for. To encompass these additional phenomena, different continuum models for unsaturated flow in porous media were proposed, where a saturation field is advected with time [1–3]. Alternatively, different modelling approaches were proposed using the Navier-Stokes equations to model dual-phase inter-tow resin and air flow, and the Darcy-Brinkman equation with an added capillary term to model intra-tow flow [4,5]. Due to the dual-phase nature of the models, the Volume of Fluid (VoF) method is a common option [6]. Although the modelling approaches above mentioned have their merits, saturation-based modelling approaches do not regard void morphology. Void morphology is known to be an important parameter in void transport phenomena [7], by which its disregard can lead to potentially wrong predictions about the in-situ void content after manufacturing. Alternative approaches based on the VoF method can provide more accurate solutions encompassing the void morphology, however, these are much more computationally intensive, by which their applicability is yet to be considered in full scale mould filling simulations.
Although voids have traditionally been treated as part of a continuum domain, these can be modelled as discrete particles which move through the fluid flow. Particle tracking schemes are usually implemented in CFD software using a Lagrangean reference frame. The schemes usually formulate the particles equation of motion by summing all intervening forces, according to Newton's second law, as described in Equation 3 [8]:
|
|
(3) |
Where is the particle mass, is the particle velocity, is the fluid velocity, is the particle density, the fluid density, is an additional force and is the particle relaxation time [9], which can be obtained according to Equation 4:
|
|
(4) |
where is the particle drag coefficient (which formulation depends on both geometry and type of particle), is the particle diameter and is the relative Reynold's number, which is formulated in Equation 5.
|
|
(5) |
However, contemplating such a framework for void motion through porous media is cumbersome, since additional terms such as the capillary force would have to be considered due to the presence of significant bubble deformation through the porous architecture [10]. This would require the exact evaluation of both void and porous geometry at each time-step, which not only is computationally expensive, but also hindered by the characterization of the porous geometry of fibrous reinforcements due to the associated uncertainties and high statistical scatter that still motivate several research topics [11,12].
A commonly employed rationale in the composites manufacturing field is to consider that voids move at the same speed as the fluid flow, multiplied by a mobility factor , which is a parameter that condenses all the complex related physical interactions of the void with the resin fow as well as the fibres [13]. Thus, considering the three-dimensional cartesian space, void mobility takes the form of a second order tensor, by which void velocity can be determined using Equation 6:
|
|
(6) |
Where is the void velocity, is the void mobility tensor, and is the volume average fluid apparent velocity inside the porous medium. The apparent velocity is derived from the volume average velocity ( ) regarded in Darcy equation (Equation 1) and the porosity ( ), according to Equation 7:
|
|
(7) |
This modelling approach is less computationally intensive than the classical particle tracking schemes. Additionally, as each void can be treated as a particle, with its own set of properties, the morphology of voids can be treated in a straightforward manner. Overall, this approach as the potential to be a computationally efficient path to deal with the different parameters relevant to void formation and transport in Liquid Composite Moulding. This work presents the details of an implementation of the proposed methodology into liquid composite moulding simulations.
2. Methodology
2.1. Void framework & flow coupling
The coupling between the fluid flow solution provided by LIMS flow solver and the void framework, is established through a Message Passing Interface (MPI) protocol implementation that synchronizes the two different models [13]. This coupled modular strategy is advantageous over a monolithic approach, as every model can have its own independent implementation, by which there is no need to modify pre-existing validated code. Thus, the framework developed in this work can be added to LIMS functionality, without the need to modify LIMS flow solver itself. Nevertheless, it requires that a synchronism mechanism between LIMS flow solver and additional models is implemented, to maintain a physically accurate solution. This is especially important when coupling resin reactive models, in which the change in resin viscosity affects the flow solution [13].
2.2. Void creation
Each void is modelled as an individual particle and defined by its initial position when created, initial size (given by the diameter), and the pressure at the creation instant. This framework is flexible enough to allow the use of any void formation model available in the literature, as long as the initial void diameter is known. Therefore, saturation dependent models can use the relation between the FEM/CV mesh element volume and overall void volume inside the element, as stated in Equation 8:
|
|
(8) |
Where is the element saturation, is the volume of a void inside the element, and is the element volume. Additionally, it is possible to introduce void generation in specific locations such as the mould inlet, to simulate certain conditions such as air leakage into the mould cavity.
2.3. Void transport tracking
The void’s position at each time-step can be integrated from Equation 6 using Euler explicit discretization (Equation 9):
|
|
(9) |
Where is the void position in local element coordinates and is the time-step. Having computational performance in mind, a local coordinate based void tracking approach is preferable to a global coordinate based one, since all fluid flow computations are done primarily using local variables, as it is common in FEM software. The time-step in Equation 9 is given by LIMS' fluid flow solver for flow-front advection. Since and do not change within the time-step, Equation 9 is inherently stable, by which no sub time-stepping additions are needed.
In combination with the void position update scheme presented in Equation 7, the algorithm has to check if the bubble exits the element while within the prescribed time-step. Since the void equation of motion in Equation 9 takes the form of a line parametric equation, by having the coordinates of the nodes of the element and the boundaries normal vector stored in program memory, one can apply Equation 10 to calculate the time for the void to reach a boundary:
|
|
(10) |
where is the time to reach boundary, are the coordinates of a node at the boundary and is the boundary normal vector. This process is depicted in Figure 1. To compute which element boundary the void will cross, the tracking algorithm chooses the boundary which has the minimum positive , by evaluating Equation 8 for all boundaries. In case the time-step prescribed by LIMS is higher than the calculated time to boundary, the void position is recalculated using the remaining time-step, which is obtained by subtracting .
The transition of a void between elements can be done by converting the void position in local element coordinates to global coordinates, and back to the new assigned element local coordinates. Provided that the local referential axes are orthogonal, one can compute the global coordinates of a void with Equation 11:
|
|
(11) |
where is the transposed transformation matrix that maps the element local referential axes to the global coordinate system and are the coodinates of the reference node (which local coordinates evaluate to null). Inversely, the local void coordinates inside a newly attributed element can be computed from the global coordinates using Equation 12.
|
|
(12) |
The tracking of voids trajectories through element boundaries additionally allows the formulation of a void termination criteria. Fundamentally, after a void is created, it can be terminated if it coalesces with the flow-front, or exits the domain through a vent gate. Flow-front coalescence can be modelled by knowing the fill-factor (given by LIMS solver) of the element which sits next to the boundary being crossed by the void: if the fill factor is below a threshold value (circa 90%), then the flow-front is partially located on that element and the void is considered to be coalesced (and terminated). A void can also be terminated by exiting a vent gate if it crosses a boundary in which all nodes are declared as gates. As explained in detail in [13], the use of single gate nodes can lead to numerical instabilities in two or three-dimensional problems, as the node-based results calculated by LIMS solver are converted to cell-based results, in order to run control-volume based algorithms (such as this case). At last, element boundaries can also be mould walls, which delimit the domain. In the case a void collides with a wall, its velocity inside the element is updated taking the orthogonal component of the velocity vector by the boundary normal vector ( ), using Equation 13.
|
|
(13) |
In addition to position tracking, the tracking of void size was also considered in the algorithm. This can be done in a straightforward manner, using the ideal gas law, and assuming that the void geometry can be approximated by a sphere, as in Equation 14:
|
|
(14) |
where is the void current radius, is the current pressure being exerted on the void, is the void radius when created, and is the pressure being exerted on the void at the moment of generation. The current pressure acting around the void ( ) can be estimated by computing the arithmetic mean pressure of all the element’s nodal pressure values.
3. Results
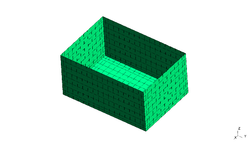
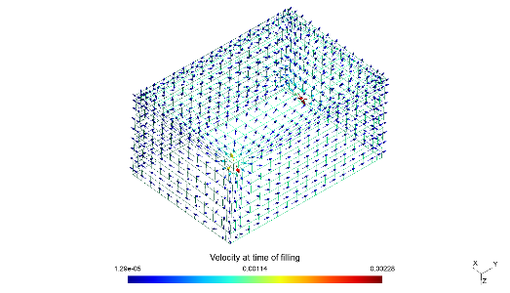
To assess the correct functioning of the algorithm, a test case was computed, which consists in a box modelled by two-dimensional shell elements. Nevertheless, the elements are distributed in three-dimensional space to account for the sides of the box. as shown in Figure 2. An inlet was positioned in a top corner of the box, thus allowing the fluid flow to address all three spatial dimensions, as can be seen by the fluid flow velocity vectors at the last time-step of the filling simulation, displayed in Figure 3. In order to simulate an air leak during mould filling, voids were generated in the elements around the inlet, at each simulation time-step, for the first half of the mould filling time. Three simulations were performed with different void mobility factors: 10, 2, and 0.5. The material properties and boundary conditions used in the simulations are registered in Table 1.
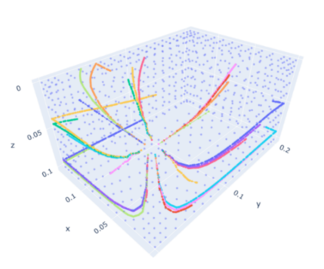
From Figure 4, it can be seen that the void paths follow the local element flow velocity vectors. Since the velocity field suffers changes throughout the mould filling simulation, this will lead to different void paths, even for voids generated inside the same element.
| K11 [m2] | K22 [m2] | Viscosity [Pa.s] | Injection pressure [Pa] |
| 1.1833E-9 | 1.1833E-9 | 0.285 | 1000000 |
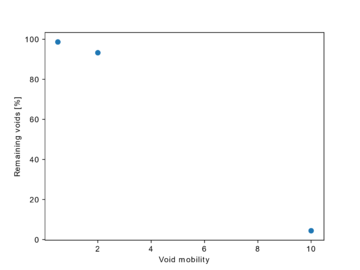
By counting the number of voids still inside the domain after complete mould fill for every simulation, the percentage of remaining voids was computed. From Figure 5, it can be observed that even for void mobility factors above unity, there is a significant percentage of bubbles that still remain in the domain, by which only with a mobility factor of 10, over 95% of voids coalesce with the flowfront. These results contrast with the expectable results using a rectilinear injection, in which a mobility higher than one leads to bubbles rapidly coalescing with the flow-front. This contrast is due to the non-uniform velocity field present in the box test-case, which leads bubbles not having a rectilinear path, and also be guided to zones where the flow velocity is very low. This effect can be seen in Figure 3, which at time of filling there are elements which flow velocity is null, and the maximum flow velocity is in the order of 2 mm/s.
4. Conclusions
In this work, a framework for void formation and transport was implemented in LIMS source code. Using the MPI implementation provided, it was possible to efficiently exchange data between solvers, as this framework required reading fluid flow conditions at each time-step from the flow solver and use those conditions to track voids inside the porous medium. The results obtained from the preliminary studies show that the efficiency of void transport is highly dependent on the voids mobility and processing conditions, but also on the injection scheme being used. Since in non-unidirectional injections the fluid flow velocity field can possess a high variability, even for higher mobility factors, such as 10, a significant portion of bubbles may still be present inside the laminate. Therefore, this study shows the importance of devising more robust bleeding strategies, as the efficiency of the voids washout may be highly dependent on part and injection design. Lastly, the comprehension of void mobility is yet scarce. Future research is needed to clarify the conditions under which voids are mobile and what is the expected mobility.
5. Acknowledgments
J. Machado acknowledges the support from the Associated Laboratory for Energy, Transports and Aeronautics (LAETA) under the Research Grant UIDB/50022/2020. S. Advani gratefully acknowledges the funding provided by the National Science Foundation Award No.2023323.
6. References
[1] Patiño-Arcila ID, Vanegas-Jaramillo JD. Modeling and simulation of filling in dual-scale fibrous reinforcements: state of the art and new methodology to quantify the sink effect. J Compos Mater 2018;52:1915–46. https://doi.org/10.1177/0021998317734038.
[2] Pillai KM, Advani SG. Numerical simulation of unsaturated flow in Woven fiber preforms during the resin transfer molding process. Polym Compos 1998;19:71–80. https://doi.org/10.1002/pc.10077.
[3] Tan H, Pillai KM. Multiscale modeling of unsaturated flow in dual-scale fiber preforms of liquid composite molding I: Isothermal flows. Compos Part A Appl Sci Manuf 2012;43:1–13. https://doi.org/10.1016/j.compositesa.2010.12.013.
[4] DeValve C, Pitchumani R. Simulation of void formation in liquid composite molding processes. Compos Part A Appl Sci Manuf 2013;51:22–32. https://doi.org/10.1016/j.compositesa.2013.03.016.
[5] Zhao C, Yang B, Wang S, Ma C, Wang S, Bi F. Three-Dimensional Numerical Simulation of Meso-Scale-Void Formation during the Mold-Filling Process of LCM. Applied Composite Materials 2019;26:1121–37. https://doi.org/10.1007/s10443-019-09770-w.
[6] Hirt CW, Nichols BD. Volume of fluid (VOF) method for the dynamics of free boundaries. J Comput Phys 1981;39:201–25. https://doi.org/10.1016/0021-9991(81)90145-5.
[7] Kang K, Koelling K. Void transport in resin transfer molding. Polym Compos 2004;25:417–32. https://doi.org/10.1002/pc.20035.
[8] ANSYS Inc. Ansys Fluent Theory Guide. 2022.
[9] Gosman AD, loannides E. Aspects of Computer Simulation of Liquid-Fueled Combustors. Journal of Energy 1983;7:482–90. https://doi.org/10.2514/3.62687.
[10] Lundström TS. Bubble transport through constricted capillary tubes with application to resin transfer molding. Polym Compos 1996;17:770–9. https://doi.org/10.1002/pc.10669.
[11] Mehdikhani M, Gorbatikh L, Verpoest I, Lomov S V. Voids in fiber-reinforced polymer composites: A review on their formation, characteristics, and effects on mechanical performance. J Compos Mater 2019;53:1579–669. https://doi.org/10.1177/0021998318772152.
[12] Bodaghi M, Lomov SV, Simacek P, Correia NC, Advani SG. On the variability of permeability induced by reinforcement distortions and dual scale flow in liquid composite moulding: A review. Compos Part A Appl Sci Manuf 2019;120:188–210. https://doi.org/10.1016/j.compositesa.2019.03.004.
[13] Simacek P, Niknafs Kermani N, Advani SG. Coupled Process Modeling of Flow and Transport Phenomena in LCM Processing. Integr Mater Manuf Innov 2022;11:363–81. https://doi.org/10.1007/s40192-022-00268-1.
Document information
Published on 29/04/25
Accepted on 10/10/23
Submitted on 20/05/23
Volume 08 - COMUNICACIONES MATCOMP21 (2022) Y MATCOMP23 (2023), Issue Núm. 8 - Fabricación y Aplicaciones Industriales - Materiales y Estructuras - Modelos Numéricos, 2025
DOI: 10.23967/r.matcomp.2025.08.08
Licence: Other
Share this document
Keywords
claim authorship
Are you one of the authors of this document?


