Abstract
This article presents a numerical-based study on the vertical holding capacity of a typical finless torpedo anchor embedded in a pure cohesive isotropic sol considering setup effects. A strategy based on two axisymmetric nonlinear finite elements (FE) models is proposed. In these models, the soil is represented with continuous solid elements with both plane translational and pore pressure degrees of freedom, which allow the modeling of the soil's strength regain after the installation of the anchor, i.e., the soil setup. The anchor is also modeled with solid elements, and its interaction with the soil is addressed with contact elements. Several analyses are conducted to evaluate setup effects, and, additionally, a parametric study on different soil undrained shear strengths and permeability coefficients is performed. The results obtained show that the permeability of the soil and its undrained shear strength have an important role in the setup process, and an inverse relationship between consolidation time and the permeability coefficient of the soil is observed. Finally, an analytical approach is calibrated with a reasonable agreement to the numerical results.
Keywords: Torpedo anchor, setup, finite elements, analytical models
1. Introduction
Dynamically installed anchors (DIAs) [1], also known as gravity installed anchors (GIAs) [2], are an attractive alternative for deep-water mooring systems due to their cost-effectiveness and capacity to withstand high vertical loads. Existing DIAs used in offshore engineering include deep penetration anchors (DPAs) [3], torpedo anchors [4], the OMNI-Max anchor [5], and, more recently, an innovative lightweight gravity installed plate anchor (L-GIPLA) [6]. Among these anchors, torpedo anchors have proven to be an outstanding alternative in Brazilian offshore fields.
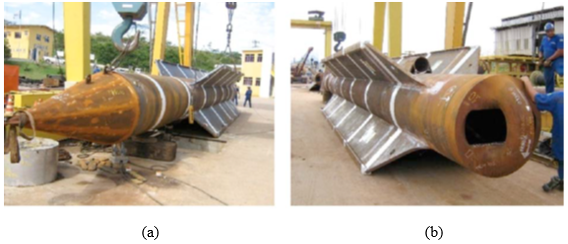
As shown in Figure 1, the torpedo anchor has a “rocket” shape with a long shaft made of carbon steel ballasted with lead and cast iron [4]. Its structure typically comprises a loading point (or padeye) attached at the top, a conical tip, which is designed to improve the embedment depth of the anchor and may have up to 4 relatively small fins at the trailing edge [7].
| |
| Figure 1. Typical torpedo anchor. (a) Conical tip. (b) Padeye details [4] | |
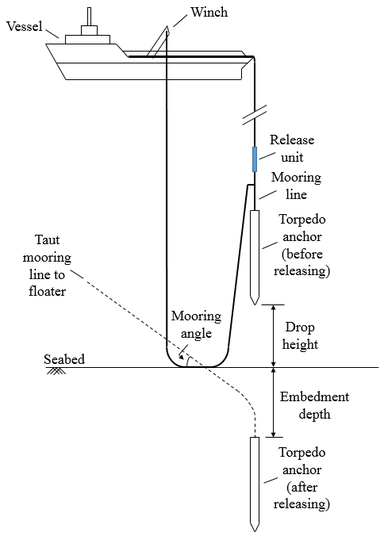
In general, a set of four to eight anchors can be transported to a location and deployed using a typical anchor-handling vessel (AHV). A schematic of the installation of a typical torpedo anchor is presented in Figure 2. The dropping anchor is connected to an installation line and an independent mooring line. The anchor is lowered to the predetermined drop height above the seabed and then released by disconnecting the installation line [8]. The anchor falls freely through the water depth using its weight as driving energy before impacting and embedding into the seafloor sediments.
| |
| Figure 2. Typical installation procedure of a finless torpedo anchor | |
Soil disturbance caused by the anchor installation induces an excess pore pressure around the anchor, which reduces its holding capacity. As the excess pore pressure dissipates over time, the holding capacity of the anchor progressively increases. This process is known as setup.
Setup is predominantly associated with an increase in the soil resistance around the anchor. Although the exact mechanism by which setup occurs is not entirely understood [9]-[11], the most important process is due to an increase in soil effective stresses with the dissipation of the excess pore pressure built up around the driven anchor and the gradual consolidation of the remolded soil. In addition, thixotropy and aging effects may also account for additional setup.
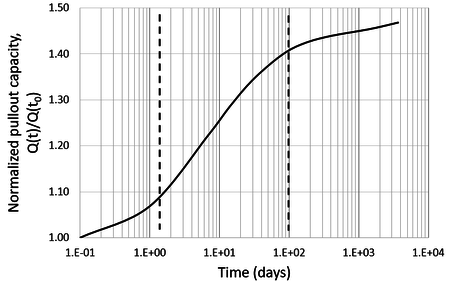
In general, the setup process can be divided into three main phases [10]. Figure 3 presents a typical setup curve, which indicates the variation of the anchor's normalized pullout (vertical) capacities with the logarithm (log) of time. In this figure, the normalized capacity is the ratio between the pullout capacity at time t and the capacity immediately after installing the anchor. During the first phase of setup, the rate of excess pore pressure dissipation is not linear with the log of time due to the highly disturbed state of the soil. According to Komurka and Wagner [10], in this phase, the effective stress increase and, therefore, the gain in soil strength is not well-understood and challenging to represent. In the second phase, the excess pore pressure dissipation rate becomes linear with the log of time, and the increase in the effective stresses follows the conventional consolidation theory. Theoretically, infinite time is required to dissipate the excess pore water pressure, but, in practice, after some time, the rate of dissipation is so slow that almost no strength regain is observed. This response corresponds to the third phase in Figure 3. In this phase, primary consolidation is completed, but secondary compression continues and is independent of the effective stress [10].
| |
| Figure 3. Example of a setup curve | |
Setup mechanisms have an important role in predicting the ultimate holding capacities of DIAs. Richardson et al. [12] conducted several experimental tests, which indicated that 50% of the anchors’ holding capacities are achieved from 35 to 350 days after installation. Furthermore, 90% of the holding capacity is achieved between 2.4 to 24 years after installation but these values highly depend on the soil properties. Lieng et al. [3] performed experimental tests and found that 70% of the holding capacity of a DPA is achieved 2 weeks after installation in the clay soil of Voring Bay in Norway. Radgahar et al. [13] and Raie and Tassoulas [14] conducted finite element analyses of finless torpedo anchors. The results indicated that the time needed to achieve a degree of consolidation around 90% is highly inferior to the time needed for the complete consolidation of the soil. It is also emphasized that a significant regain of the anchor’s holding capacity was observed after its installation. Sabetamal et al. [15] focus on numerical analyses with the Arbitrary Lagrangian-Eulerian (ALE) approach to evaluate DIAs holding capacities simultaneously with pore pressure dissipation and soil consolidation with time. The authors concluded that most of the pullout capacity of the anchors should be available much earlier than the consolidation completion, as most of the excess pore pressure dissipates within a matter of days or weeks.
More recently, Zhao et al. [7] presented the available numerical methods to analyze dynamically installed anchors and emphasized that an integrated and complete simulation of installation and pullout of a DIA is still a challenge. Regarding the setup analysis of finless torpedoes, a degree of consolidation of 90% for elements within a radial distance of 1 Da of the anchor tip, where Da is the anchor’s external diameter, was achieved within 51-82 days after the installation.
Despite its successful use in offshore applications, estimating a torpedo anchor holding capacity and predicting the stresses in its structure remains a challenge [4]. Moreover, setup effects are not directly incorporated into the design of this structure. Sousa et al. [4] mention that, in practice, a typical torpedo anchor is first loaded approximately three months after its installation. However, the imposed loads are much lower than its holding capacity, as safety factors between 1.5 and 2.0 are employed in the anchor’s design. Nevertheless, there is no guarantee that this time is sufficient to achieve the required safety factor. On the other hand, a possible reduction in the time needed to connect the floating production system and the mooring line would be economically beneficial. Hence, there is still a gap of information concerning the setup process in the design of torpedo anchors, which is important to the offshore oil and gas industry.
In this work, a nonlinear axisymmetric finite element (FE) approach is proposed to predict the axial holding capacity of finless torpedo anchors considering setup effects. According to Medeiros Jr. [16], finless torpedo anchors may be used to anchor flexible lines to avoid load transfer from flowlines to submarine equipment. Moreover, monobuoys and ships may also be anchored in shallow waters using this type of torpedo.
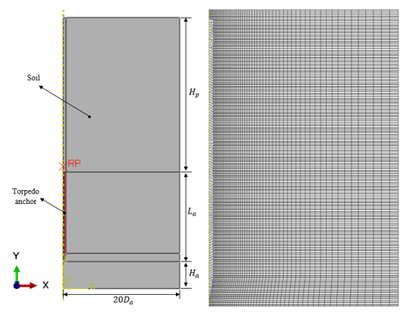
The proposed approach employs a FE model in which isoparametric solid elements are employed to represent both the soil and the anchor. These elements can describe the nonlinear physical behavior of the soil and, eventually, of the anchor. Large deformations are also addressed. Soil-anchor interaction is ensured by surface-to-surface contact elements placed on the external surface of the anchor and the surrounding soil. It is assumed that the anchor is “wished in place” and that soil initial stress conditions immediately after installation are obtained by applying the Cavity Expansion Method (CEM) in the proposed FE model. The initial stress conditions obtained are then input in another FE model, where the associated pullout capacity is determined. Both models share the same FE mesh to simplify the transference of the stress state to the holding capacity analysis. Moreover, this approach was implemented in Abaqus [17], and a view of a typical FE mesh is presented in Figure 4.
| |
| Figure 4. General view of the FE model | |
This approach was employed to analyze a finless torpedo anchor embedded in a purely cohesive isotropic soil. Different soil's undrained shear strengths and permeability coefficients were considered, and their impact on the anchor pullout capacity was assessed. Moreover, the pullout capacities obtained with the FE model were compared to those estimated using some existing analytical approaches, such as the ones of Skov and Denver [18], Svinkin and Skov [19], and ABS [20]. Additionally, in this work, an analytical methodology based on the α-Method from API [21]. is modified to account for setup effects. By relying on these comparisons, an analytical expression was calibrated to obtain the variation of the pullout capacity over time.
2. Finite element approach
2.1 Soil modeling
The soil is modeled in Abaqus [17] by considering the medium as a multiphase material and adopting the effective stress principle to describe its behavior. The FE mesh is attached to the solid phase, and the liquid present in the interior of the soil can flow through this mesh. A continuity equation is, therefore, required for the liquid. This equation can be obtained by equating the rate of increase in liquid mass stored at a point to the rate of the mass of liquid flowing into this point in a time increment:
|
|
(1) |
where is the ratio of the medium’s volume in the current configuration to its volume in the reference configuration (), is the density of the wetting liquid, is the volume ratio of free wetting liquid at a point, is the outward normal to the surface , and is the seepage velocity.
The constitutive behavior for pore fluid flow is assumed to be governed by Darcy’s law, which states that, under uniform conditions, the volumetric flow rate of the wetting liquid through a unit area of the medium is proportional to the negative of the piezometric head, i.e.:
|
|
(2) |
where is the soil saturation, is the porosity, is the permeability of the medium, and is the piezometric head, defined as:
|
|
(3) |
where is the elevation above a datum, is the pore pressure, and is the magnitude of the gravitational acceleration.
The soil is assumed to be a perfectly elastoplastic isotropic material with physical properties varying with depth. The constitutive model relies on simple bulk elasticity relationships (generalized Hook’s law) for the liquid and soil grains, combined with a constitutive theory for the soil skeleton.
The Mohr-Coulomb criterion was chosen to represent the failure of the soil. This criterion assumes that the maximum shear stress controls the failure, i.e.:
|
|
(4) |
where is the shear stress, is the effective cohesion of the soil, is the effective normal stress, and is the effective internal friction angle of the soil.
An overview of the main dimensions of the soil’s mesh is shown in Figure 4. The proposed mesh is a cylinder with a base diameter of . The height of the cylinder is given by the sum of the penetration of the torpedo anchor, , the length of the anchor, , and the distance of the tip of the torpedo anchor to the bottom of the FE mesh, .
The elements have dimensions varying between 0.10 m and 0.25 m in the regions where high plastic strains are expected to occur (close to the anchor) and between 0.25 m and 0.50 m in the regions far from the anchor, as shown in Figure 4. These dimensions were adopted after a mesh convergence study, where three different mesh densities (dense, intermediate, and coarse) were considered. The coarse mesh had about half the elements used in the intermediate mesh, while the number of elements in the dense mesh was twice the number in the intermediate mesh. As the intermediate and dense meshes did not present significant differences concerning the magnitude of the displacements and stresses, the intermediate mesh was adopted in this study.
The vertical and horizontal displacements of the cylinder were restrained at the nodes of its base. The displacements in the radial direction of the nodes associated with the outer wall of the cylinder were restrained. Moreover, once a plane of symmetry is found, the out-of-plane displacements are also restrained. Sousa et al. [4] performed several mesh tests to avoid any influence of the boundary conditions on the response of the anchor and concluded that a diameter of for the cylinder and a distance of 5.0m for was enough to simulate an “infinite” media. Thus, these values were also considered in all analyses performed in this study.
2.2 Anchor modeling
The finless torpedo anchor was modeled with isoparametric solid elements analogous to those used in soil representation but without the pore pressure degree of freedom. These elements, as shown before, are capable of considering both material and geometric nonlinearities.
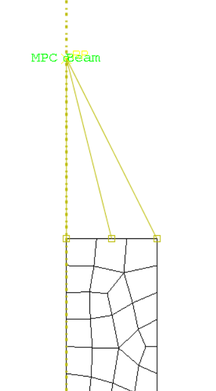
It is worth mentioning that neither the padeye at the top of the anchor nor the mooring line were represented in the proposed model. Hence, the load from the mooring line was applied at a reference node placed 1.0 m above the anchor, and it was rigidly connected to the top of the anchor by rigid bars using the beam MPC (Multiple Point Constraint) in Abaqus [17], as presented in Figure 5.
| |
| Figure 5. Detail of the point of load application | |
Anchor loading was simulated by applying a concentrated force at the reference node following a simple ramp function. As the focus of this work is evaluating the undrained capacity of torpedo anchors, the load was applied at a very high rate. Hence, after a few trials, a value of 10 000 kN/s was adopted.
2.3 Anchor–soil interaction
In problems involving contact between two boundaries, one contact surface is usually defined as the master surface, and the other is the slave surface. These two surfaces together comprise the surface-to-surface contact pair.
The slave surface is constrained against penetrating the master surface, and, usually, the slave surface is defined as the softer of the two. In the proposed model, as the anchor is much stiffer than the surrounding soil, all master elements were placed on the outer wall of the anchor, and all slave elements were on the surrounding soil contact surface.
Furthermore, the impermeability of the anchor must also be considered. As the pore pressure degree of freedom is only active in the soil elements, the FE program automatically finds the contact surface impermeable; hence, no fluid flow occurs between the soil and the anchor.
The interaction between the soil and the anchor is simulated using a penalty-type contact approach, whose main parameter is the friction coefficient between the surfaces [22]. Karlsrud [23] states that, for piles, the axial holding capacity can be obtained by calculating the shear resistance over the pile shaft concerning time and effective radial stress. The author assumes that the radial effective stress over the pile can be multiplied by a factor, , typically between 0.2 and 0.4, thus:
|
|
(5) |
where is the effective radial stress as a function of the soil consolidation ratio, and is the soil undrained shear strength as a function of the soil consolidation ratio.
During the analyses performed in this study, it was observed that when a factor between 0.2 and 0.4 was applied, the results obtained for the fully consolidated soil were much higher than the values considering the soil with intact undrained shear strength. Hence, the friction factor was calibrated against the undrained shear strength corresponding to the soil's 100% consolidation rate. It was assumed that the undrained shear strength of the fully consolidated soil is equal to the one obtained by the α-method from API [21], which will be described in section 3. Thus, the calibrated friction factor, , can be written as:
|
|
(6) |
where is the undrained shear strength of the soil, is the effective radial stress corresponding to the fully consolidated soil and is a non-dimensional factor.
2.4 Initial stress state of the soil
An important aspect of the torpedo anchor’s analysis is the simulation of the initial stress state of the soil, i.e., the stresses in the soil before applying any structural load to the anchor. As the proposed FE model does not simulate the anchor penetration in the soil, stress changes in the soil surrounding the anchor were assumed to be close to those produced from the expansion of a cylindrical cavity.
The Cavity Expansion Method (CEM) assumes that the strains induced during the anchor installation arise from an ideal expansion of a cylindrical cavity. Randolph and Wroth [24] present a solution based on the assumption of a cylindrical cavity in a perfect elastic-perfectly plastic (EP) soil model. The authors assumed axial symmetry and plane strain conditions, which implies that only radial displacement of soil particles occurs.
Hill [25] and Gibson and Anderson [26] demonstrate the expressions for the stresses around an expanded cavity. For a cavity expanded from zero radii to a radius , the radial and circumferential stress changes within the plastic zone are respectively given by:
|
|
(7) |
|
|
(8) |
where is the increment of the effective radial stress, is the increment of the effective circumferential stress, is the shear modulus at 50% mobilization of soil strength.
The relation between and can be estimated by the following empirical expression [27]:
|
|
(9) |
where is the plasticity index of the soil and is the overconsolidation ratio of the soil.
Furthermore, Randolph and Wroth [24] estimate the excess pore pressure by assuming that the mean effective stress remains constant under undrained conditions. The distribution of the initial excess pore pressure can then be written as:
|
|
(10) |
where is the distribution of the initial excess pore pressure, is the outer radius of the anchor, and is the plasticized radius of the soil, given by:
|
|
(11) |
The installation of a closed-ended pile is, in theory, modeled by the expansion of a cylindrical cavity with an initial radius of zero. In contrast, numerical calculations must begin with a finite cavity radius to avoid infinite circumferential strains [9]. Carter et al. [28] found that doubling the cavity radius is adequate for EP and modified Cam Clay models. Hence, expanding a cavity from to can approximate the cavity expansion from to . Thus, in all analyses conducted in this study, a relationship of was considered.
2.5 Solution procedure
A typical FE mesh to predict the load capacity and the structural behavior of a finless torpedo anchor considering setup effects must account for contact, geometric, and material nonlinearities. The solution procedure adopted in this study follows the steps presented by Lopes [29] and is described here in detail.
Complete setup analysis is divided into four different steps:
- Step 1: A geostatic analysis was invoked to obtain the in situ conditions of the soil mass. In this step, the effective self-weight of the soil was applied using the “body-force” option in Abaqus [17]. This option was defined to prescribe the loading per unit volume over a body.
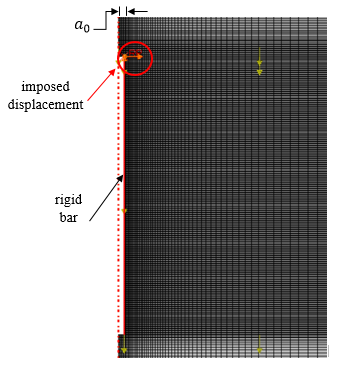
- Step 2: The expansion of the cylindrical cavity was performed. Part of the soil corresponding to the initial cylindrical cavity radius was removed and replaced with a rigid bar. Then, the bar moved against the soil to simulate the expansion of a cavity, as shown in Figure 6.
- Step 3: The second step results were imported to another FE model using the MAP SOLUTION command in Abaqus [17], where a new undeformed finite element mesh was adopted. This procedure was essential to continue the analysis as the CEM generates high strain rates in the model. Finally, the anchor was positioned into the soil mass and the setup analysis was conducted.
- Step 4: In this step, the holding capacity analysis was subdivided into three load steps. In the first load step, a time step of 0.001 seconds was employed to simulate the conditions in the soil immediately after anchor driving. The second load step involved continuing consolidation analysis for lengths of time ranging from 1 day to 18 000 days (50 years approximately). In this loading step, the excess pore pressure dissipated as time progressed, and the soil consolidated. As the excess pore pressure dissipated, the effective radial stress in the soil adjoining the anchor increased with time. This increase in the effective radial stress resulted in a higher frictional resistance between the soil and the anchor. Finally, the third load step involved assessing the pullout strength by applying a concentrated force into the reference node positioned above the top of the anchor and monitoring the vertical motion.
The proposed models had, on average, 45 200 nodes, 14 850 elements, and 105 000 degrees of freedom. Hence, the total time needed to perform a complete setup analysis was about 39 hours, considering that the models were executed sequentially. All analyses were carried out in an Intel® Core™ i7-6500 CPU @ 2.50GHz 2.60GHz machine with 16 GB of RAM.
|
| Figure 6. Detail of the rigid bar and its imposed displacement |
3. Analytical estimation of the vertical holding capacity of torpedo anchors
The ultimate holding capacity of torpedo anchors can be calculated as the sum of three terms. The first term refers to the total lateral resistance provided by the friction between the soil and the lateral area of the anchor. The second term is associated with the top resistance, and the last term is the submerged anchor’s weight.
According to Sousa et al. [4], to estimate the response of a torpedo anchor loaded vertically, the use of the expressions proposed by API [21] proved to be adequate. The ultimate holding capacity, , can be obtained by the following equation:
|
|
(12) |
where is the perimeter of the anchor at a corresponding position z, is the total length of the anchor, is the top surface area of the anchor, is the submerged weight of the anchor, and is a non-dimensional factor, calculated as:
|
|
(13) |
with the constraint that , where is the effective overburden pressure.
However, the presented expressions do not incorporate the setup effects. By combining the calculus of the ultimate holding capacity using the α-method with the CEM equations, the effective radial stress of consolidation can be written as:
|
|
(14) |
where is the effective vertical stress in-situ, is the coefficient of earth pressure at rest and is the consolidation ratio of the soil.
Moreover, some analytical expressions were proposed to estimate setup effects in cylindrical piles [10]. However, these empirical expressions are limited to specific applications and vary according to the degree of complexity and coverage.
Skov and Denver [18] presented an empirical relationship in which the setup process varies linearly with the log of time, i.e.:
|
|
(15) |
where is the axial capacity at time after driving, is the axial capacity at the time , is a constant that depends on the soil type, and is an empirical value measured in days.
Furthermore, Svinkin and Skov [19] derived a new formulation to quantify the setup effects on the holding capacity of piles installed in cohesive soils. The formula proposed assumes that equals to 0.1, and is given by:
|
|
(16) |
where is the axial capacity at the end of driving and is a constant similar to (15).
Recently, ABS [20] presented an empirical formulation that provides a preliminary assessment of the regain of dynamically installed piles capacity after driving. ABS [20] states that the regain of the pile capacity can be conservatively estimated with:
|
|
(17) |
where is the submerged weight of the pile, is the long term maximum pile capacity, and is a non-dimensional time defined as:
|
|
(18) |
where is the horizontal coefficient of consolidation, is the consolidation time after installation, and is the pile shaft diameter.
4. Parametric study
4.1 Description
In this work, several FE analyses were performed to study the effect of three parameters on the holding capacity of the anchor while considering setup effects. These parameters are the:
- 1. Soil consolidation time;
- 2. Undrained shear strength of the soil;
- 3. Coefficient of permeability of the soil.
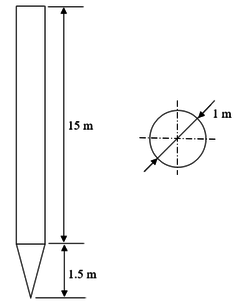
The geometry of the anchor is presented in Figure 7. The thickness of the anchor shaft and the conical tip are 65 mm and 50 mm, respectively. The material behavior of the anchor was assumed linear and elastic with Young’s modulus equal to 210 GPa and Poisson ratio of 0.3. The anchor was discretized using 8-noded plane axisymmetric elements with translational degrees of freedom. The submerged self-weight of the anchor was kept constant and equal to 500 kN.
|
| Figure 7. Main dimensions of the analyzed finless torpedo anchor |
It is worth mentioning that, in this work, the anchor was supposed to be installed perfectly vertically, while, in practice, inclinations concerning the horizontal plane are often observed. This assumption and the consideration of a finless torpedo anchor allow the use of the proposed axisymmetric model.
The soil was considered purely cohesive and isotropic with a Poisson ratio of 0.4 and Young’s modulus varying with depth according to the following expression:
|
|
(19) |
The soil is normally consolidated ( ), with a plasticity index of 30%. In all FE analyses, the rupture of the soil was verified with the Mohr-Coulomb criterion (Eq.(4)), by assuming an internal friction angle of 0° and that the cohesion equals the undrained shear strength of the soil. The initial void ratio of the soil was set equal to 1.5, and its submerged self-weight was 5.5 kN/m³. Additionally, three different shear strength profiles with a fixed permeability coefficient were considered in this study, as presented in Table 1.
| Analysis Index | Soil Label | Shear strength profile (kPa) | Permeability coefficient (m/day) |
|---|---|---|---|
| 1 | A | ||
| 2 | B | ||
| 3 | C | ||
| 4 | A | ||
| 5 | A |
An important aspect that influences the holding capacity of torpedo anchors is its embedment depth. This depth is a function of the geometry and weight of the anchor, the installation characteristics, including the anchor drop height, and the various hydrodynamic and geotechnical parameters, such as the undrained shear strength [29,30]. Therefore, torpedo anchors with different physical or geometric characteristics or embedded in soils with different properties would have different embedment depths if all other installation parameters were kept constant.
According to ABS [20], the anchor embedment depth can be assessed using True`s method [31], accounting for strain rate and drag effects. Therefore, a driving analysis was performed, based on the model presented by True [31], to verify the embedment depth of the finless torpedo anchors. Normal and tangential drag coefficients were assumed equal to 1.51 and 0, respectively, while the soil sensitivity was set constant and equal to 3.1. Moreover, an empirical shear strain rate () of 3.5, coefficients of shear strain equal to 1.4kPa.s and equal to 0.07, and an adhesion coefficient equal to 0.07 were assumed in all driving analyses. A bearing capacity coefficient of 12 for the anchor tip was also considered.
In this study, aiming to only access the effects of the undrained shear strength of the soil on the holding capacity of torpedo anchors, a unique embedment depth of 28.5 m was assumed in all cases. This particular value of embedment depth can be achieved by varying the drop height of the torpedo anchor in the driving analysis, as proved in the embedment analyses. For instance, the drop height required for soils A, B, and C were found to be, respectively, 8 m, 48 m, and 190 m.
4.2 Results
4.2.1 Undrained shear strength effects
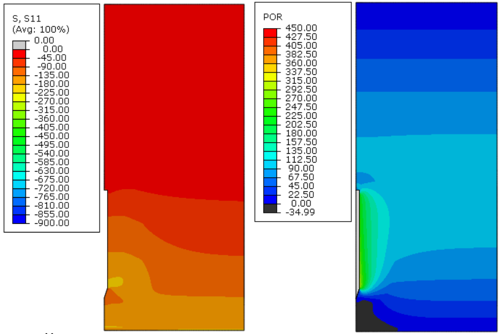
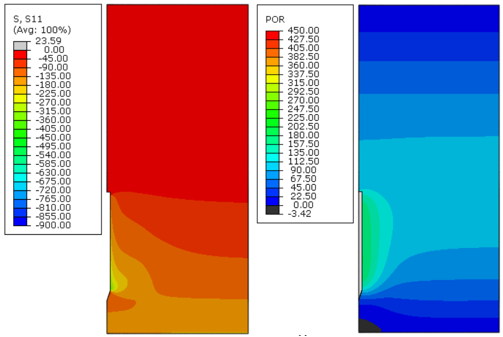
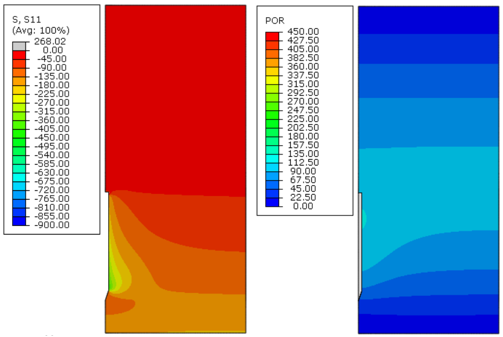
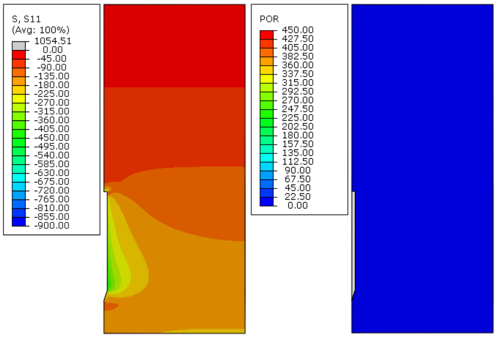
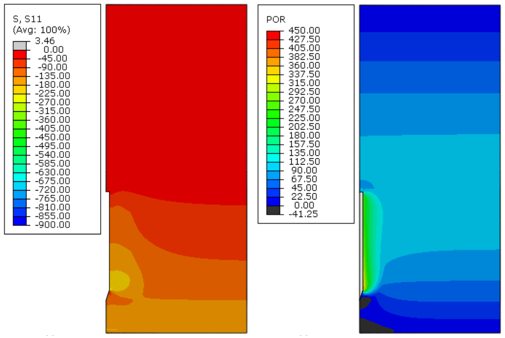
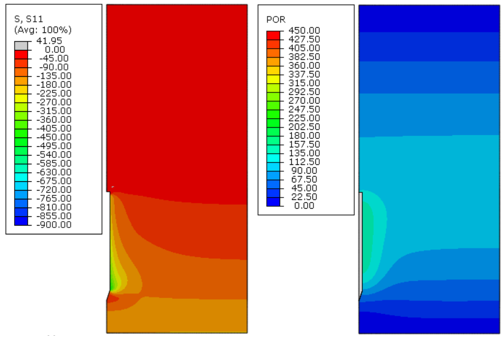
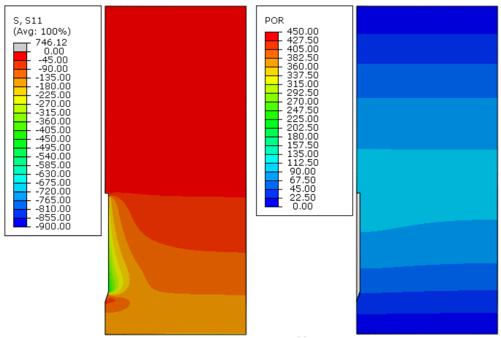
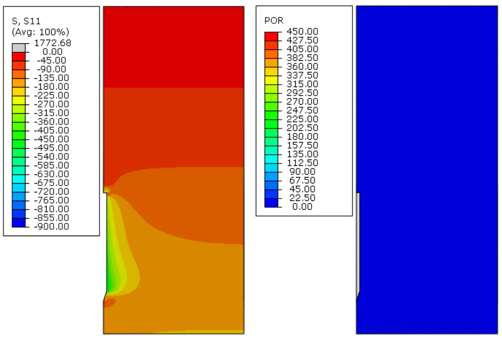
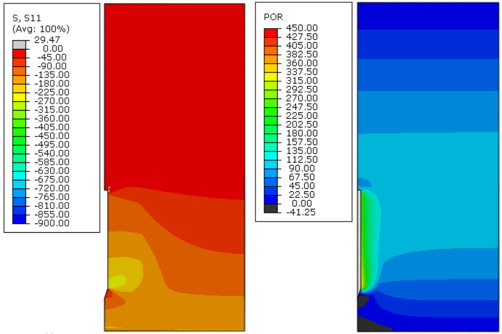
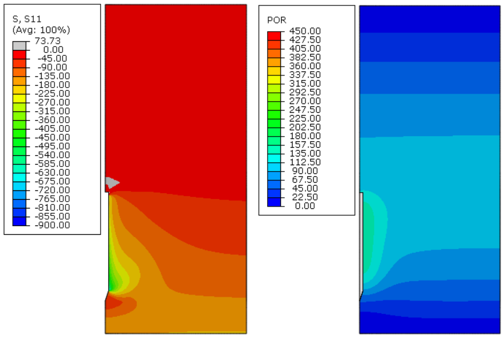
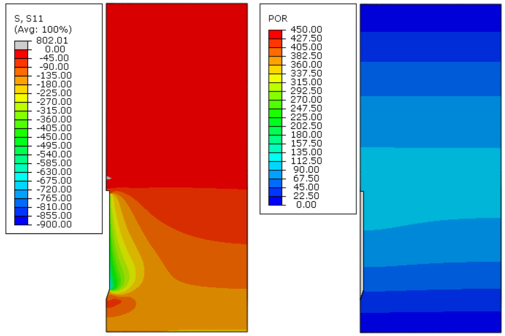
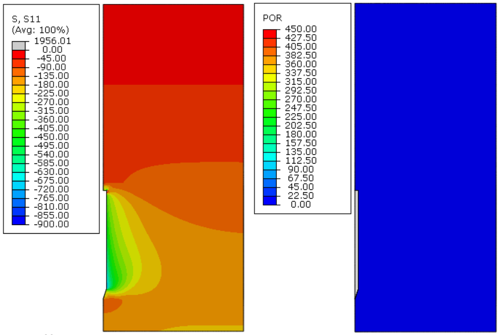
Figures 8 to Figure 19 present plots of the effective radial stresses and excess pore pressures of soils A, B, and C (analyses 1, 2, and 3 from Table 1, respectively), for different instants of time after the installation of the anchor. These results refer to the final step before pullout analyses. The anchor was removed from these figures to evaluate the soil's response properly.
|
| Figure 8. Effective radial stress (S11) and excess pore pressure (POR) in kPa, immediately after installation (0 days) – Soil A, analysis 1 |
|
| Figure 9. Effective radial stress (S11) and excess pore pressure (POR) in kPa, 10 days after installation – Soil A, analysis 1 |
|
| Figure 10. Effective radial stress (S11) and excess pore pressure (POR) in kPa, 150 days after installation – Soil A, analysis 1 |
|
| Figure 11. Effective radial stress (S11) and excess pore pressure (POR) in kPa, 18000 days after installation – Soil A, analysis 1 |
|
| Figure 12. Effective radial stress (S11) and excess pore pressure (POR) in kPa, immediately after installation (0 days) – Soil B, analysis 2 |
|
| Figure 13. Effective radial stress (S11) and excess pore pressure (POR) in kPa, 10 days after installation – Soil B, analysis 2 |
|
| Figure 14. Effective radial stress (S11) and excess pore pressure (POR) in kPa, 150 days after installation – Soil B, analysis 2 |
|
| Figure 15. Effective radial stress (S11) and excess pore pressure (POR) in kPa, 18000 days after installation – Soil B, analysis 2 |
|
| Figure 16. Effective radial stress (S11) and excess pore pressure (POR) in kPa, immediately after installation (0 days) – Soil C, analysis 3 |
|
| Figure 17. Effective radial stress (S11) and excess pore pressure (POR) in kPa, 10 days after installation – Soil C, analysis 3 |
|
| Figure 18. Effective radial stress (S11) and excess pore pressure (POR) in kPa, 150 days after installation – Soil C, analysis 3 |
|
| Figure 19. Effective radial stress (S11) and excess pore pressure (POR) in kPa, 18000 days after installation – Soil C, analysis 3 |
Figures 8 to Figure 19 indicate that, as time passed, the initial excess pore pressure generated during the installation of the anchor dissipated, and the effective radial stress of the soil around the anchor increased, which characterizes the setup phenomenon.
Immediately after installation, the excess pore pressure generated was higher because the undrained soil strength increased, as can be observed in Figures 8, 12 and 16. Moreover, the magnitude of the radial effective stresses of the soil was higher for soils with a greater undrained shear strength profile (Figures 11, 15 and 19). This response was expected because the CEM analytical formulations are directly related to the undrained shear strength of the soil, as indicated in Eqs.(7) and (10).
The plots presented in Figures 8 to Figure 19 indicate that the initial excess pore pressure was almost dissipated approximately 18 000 days after the anchor installation for all soils considered. Hence, even if the soil presents a higher magnitude for the initial excess pore pressure, the total time needed to achieve a fully consolidated scenario remains the same. It occurs mainly due to the permeability coefficient of the soil, confirming that this parameter plays an important role in consolidation analysis. Moreover, considering the same coefficient of permeability for all soils, it can be stated that the regain of the soil effective radial stresses was faster as the undrained shear strength increased.
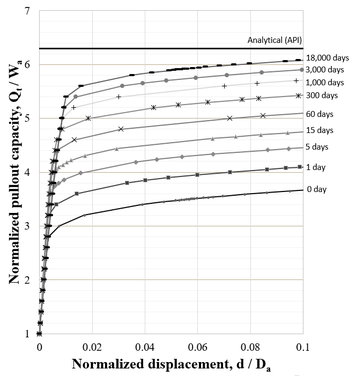
Setup effects can be better observed in Figure 20. This figure shows the variation of the normalized displacement at the top of the anchor with the normalized applied load. The normalized displacement is defined as the ratio between the total displacement at the top of the anchor and its shaft external diameter . The normalized applied load is defined as the ratio between the total applied load at the reference node and the submerged weight of the anchor . These curves refer to analysis 1 with the finless torpedo anchor embedded in soil A. In this figure, different curves indicate different consolidation times after the installation of the anchor. Additionally, the value obtained with the α-method is presented, which corresponds to a limit value, i.e., the pullout capacity after complete consolidation. Note that, as time passes, the solution converges to the ultimate value given by the analytical solution.
|
| Figure 20. Holding capacity regain of the torpedo anchor in Soil A |
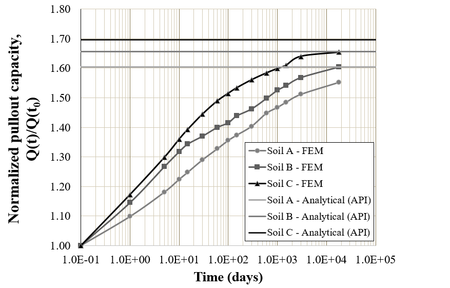
Setup curves referent to analyses 1 to 3, soils A, B, and C respectively, are presented in Figure 21. This figure indicates that the torpedo anchor’s holding capacity increased when considering soils with higher undrained shear strengths. Moreover, by evaluating the setup curves of soils A, B, and C, a higher ratio of recovery of the holding capacity when considering soils with higher undrained soil strengths can be noticed.
Figure 21 also indicates that all setup curves obtained throughout this study converged to the respective analytical response of the ultimate holding capacity (i.e., soil fully consolidated) obtained using the calibrated method based on API [21].
|
| Figure 21. Setup curves obtained for Soils A, B, and C |
Phases 2 and 3 of the setup process (Figure 3) can be observed in Figure 21. However, the first phase of the setup could not be identified in the curves. It is important to highlight that the thixotropic effects were not considered in the analyses performed in this study. According to Bergset [9], Komurka and Wagner [10], and Richardson et al. [12], thixotropic effects are more relevant in the first instants of time after installation, which corresponds to the first phase of setup. Thus, to correctly identify the first phase of setup, thixotropy effects need to be considered, which is a point that deserves future studies.
The transition between the second and the third phases of setup can be observed when the setup curve changes its inclination. For all the setup curves presented in Figure 21, this transition occurs about 5 000 days after installation.
Table 2 summarizes the main results of Figure 21. This table indicates an increasing rate of the holding capacity during the first 15 days after the anchor’s installation in all cases analyzed. However, this rate behaves more linearly after 10 or 15 days after the anchor installation. For the different soils considered, the increase in the holding capacity regarding its initial value for the range of time between 15 and 100 days was approximately 11%.
| Analysis | 0 day | 1 day | 15 days | 30 days | 60 days | 100 days |
|---|---|---|---|---|---|---|
| 1 | 1.00 | 1.12 | 1.30 | 1.35 | 1.39 | 1.42 |
| 2 | 1.00 | 1.17 | 1.40 | 1.43 | 1.46 | 1.48 |
| 3 | 1.00 | 1.20 | 1.45 | 1.51 | 1.56 | 1.59 |
By comparing Table 2 and Figure 21, it is possible to affirm that the regain rates of the holding capacity are higher in the initial moments. Immediately after, these rates start to decrease. It is important to emphasize that this conclusion is only valid because the same permeability coefficient was considered for all soils analyzed.
4.2.2 Permeability coefficient effects
In the investigation of the impact of the soil permeability coefficient in the ultimate holding capacity of the torpedo anchor, only the undrained shear strength profile of Soil A (Table 1) was considered. All other properties of the model were the same described in section 4.1.
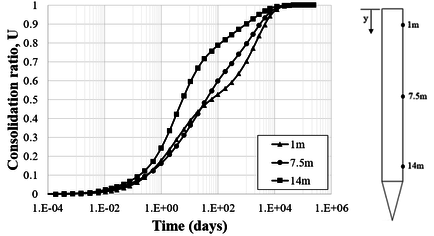
Figure 22 shows the soil consolidation ratio considering a permeability coefficient of m/day. The figure shows three different consolidation curves related to a specific point located along the anchor length. These points are also illustrated in this figure. It is emphasized that the points were chosen to ensure that the anchor geometry's boundaries do not influence the results.
|
| Figure 22. Consolidation ratio over time in Soil A |
As can be observed in Figure 22, the rate of excess pore pressure dissipation is slightly different at each of the points analyzed. However, all curves follow the same trend. Moreover, complete soil consolidation occurred practically at the same time. In this case, a time of 10 000 days is representative of this phenomenon.
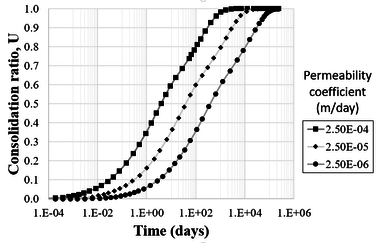
Figure 23 compares the consolidation ratio along time for soil A, considering different permeability coefficients. These results refer to the point located at 7.5 m distant from the top of the anchor, as illustrated in Figure 22. It can be observed that the time needed to achieve a certain consolidation ratio of the soil is lower when the permeability coefficient increases. On the other hand, full consolidation time is higher when the permeability coefficient decreases.
|
| Figure 23. Consolidation ratios for different permeability coefficients at 7.5m from the top of the anchor |
The total times needed for consolidation ratios of 0.1 to 0.99 are summarized in Table 3 for the different permeability coefficients considered. This table indicates that when the permeability coefficient increases an order of magnitude, the time needed to achieve a specific consolidation ratio decreases at the same ratio. Analogously, when decreasing one order of magnitude of the permeability coefficient, the total time required to achieve a certain consolidation ratio is increased by the same ratio.
| (m/dia) | Consolidation ratio, | |||||
|---|---|---|---|---|---|---|
| 0.10 | 0.25 | 0.50 | 0.75 | 0.90 | 0.99 | |
| 2.50E-04 | 3.00E-02 | 3.30E-01 | 3.79E+00 | 6.00E+01 | 3.08E+02 | 1.41E+03 |
| 2.50E-05 | 3.10E-01 | 3.26E+00 | 3.97E+01 | 6.23E+02 | 3.09E+03 | 1.52E+04 |
| 2.50E-06 | 3.09E+00 | 3.18E+01 | 4.04E+02 | 6.32E+03 | 3.10E+04 | 1.12E+05 |
Another important aspect that should be observed in Table 3 is the variation of consolidation ratio over time. It can be noted that, in the transition between the consolidation ratios chosen, a change of an order of magnitude into time scale occurs. The succeeding values of time are not precisely the previous value multiplied by a factor of 10, but they are relatively close to that.
4.2.3 Comparison between FEM and analytical methodologies
For this investigation, a unique permeability coefficient of m/day was employed in all analyses. Moreover, different undrained shear strength profiles were considered, and the effects of these profiles on the holding capacity of the torpedo anchors were assessed.
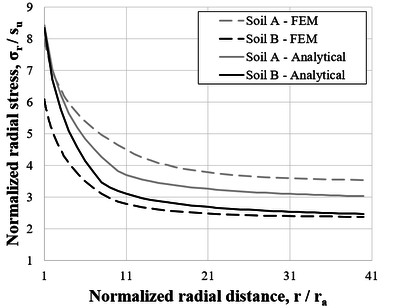
Figure 24 compares the radial stresses obtained with the FEM and the CEM analytical formulation, Eqs. (7) and (10). In this figure, the radial stress was normalized by the undrained shear strength of the soil. Furthermore, the radial distance was normalized against the external radius of the anchor. In general, both methodologies are in good agreement throughout the radial distance within the soil. Although, a significant difference can be noticed in the region close to the anchor shaft in soil B.
|
| Figure 24. Comparison between total radial stresses – Soils A and B |
Aiming at employing the analytical methodology based on the α-method from API [21], CEM equations were used to obtain the effective radial stress over the external anchor wall along time and, thus, to calculate the values of the remaining parameters at each instant of time selected.
As mentioned before, the CEM is not suitable for estimating the stresses at the top and tip of the anchor. However, due to the lack of a better analytical formulation to estimate the stresses at these two regions, CEM equations were adopted in this study.
Input parameters of combined holding capacity and , used in the empirical formulations of Skov and Denver [18], Eq. (15), and Svinkin and Skov [19], Eq. (16), were obtained from the analyses using the FEM for time instants of 1 day and 0.01 day, respectively, after the installation of the anchor.
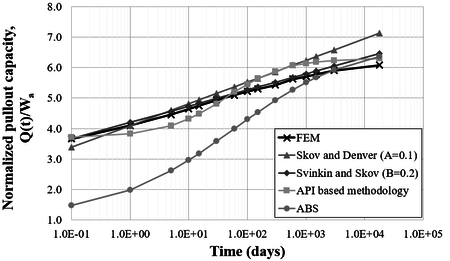
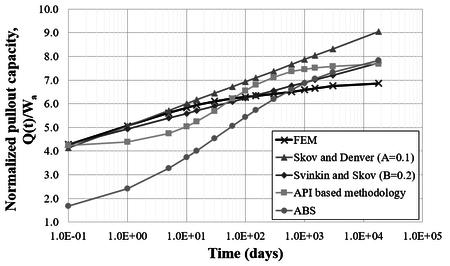
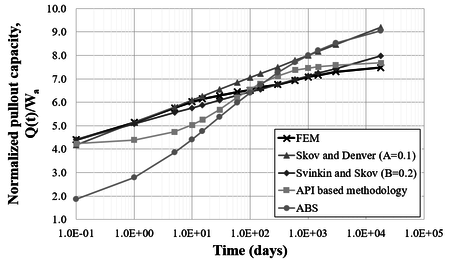
Figures 25 to 27 present comparative plots, for different soil undrained shear strength profiles considering the FE and analytical predictions. In these figures, the holding capacity of the anchor was normalized by the submerged weight of the anchor (500 kN).
In general, all methodologies have similar behavior, except for the initial instants of time for the ABS [20] formulation, which starts with a lower holding capacity value. Results obtained from FEM analyses estimated pullout capacities slightly lower for a consolidation time of 18 000 days when compared to the other methodologies. It is emphasized that for all soils analyzed, only the ABS [20] formulation and the analytical methodology based on α-method of API [21] did not present a predominant linear behavior.
Skov and Denver [17] empirical formulation, Eq. (15), presented an excellent agreement for the first ten days after anchor installation. On the other hand, the analytical methodology based on the α-method of API [21] showed better approaches for consolidation times over 100 days.
|
| Figure 25. Comparison between methodologies – Soil A |
|
| Figure 26. Comparison between methodologies – Soil B |
|
| Figure 27. Comparison between methodologies – Soil C |
The undrained shear strength of the soil has a major impact on the ABS [20] formulation compared to the other methodologies. As shown in Figures 25 to 27, the pullout capacity increases at a higher rate compared to other formulations. For soil C, the ABS [20] formulation approaches the Skov and Denver [18] formulation for a consolidation time of 18 000 days, while, for soils A and B, it approaches the other formulations.
Finally, it is emphasized that the FE analyses presented a setup curve with a predominantly linear behavior with the log of time. Among the empirical methodologies, the Svinkin and Skov [19] empirical formulation, Eq. (16), presented a better match to those obtained with the FE approach. This indicates that a reasonable approach to obtain the setup curve is to conduct a pair of analyses with the FE approach, e. g., for consolidation times of zero (i.e., immediately after the installation of the anchor) and several days after the installation (typically, 5 000 or 10 000 days). Then, the coefficient B, Eq. (16), can be calibrated using these two points of the curve. In this study, a value of 0.2 for the coefficient B was found adequate to simulate the setup for all soils considered.
5. Conclusions
This study presented a numerical approach based on axisymmetric FE models to evaluate the behavior of a finless torpedo anchor submitted to axial loads at different instants of time after its installation.
The proposed approach was employed in a parametric study aiming to evaluate the setup effect on the holding capacity of the finless torpedo anchor considering different undrained shear strength profiles, elasticity moduli, and permeability coefficients of the soil.
The parametric study evidenced the importance of the soil undrained shear strength and the permeability coefficient in estimating the holding capacity of the torpedo anchor and in the total time of setup. Soils with higher undrained shear strengths present states of effective stress with higher magnitudes and, consequently, at the end of the setup process, higher pullout capacities. It was also identified that higher undrained shear strengths are associated with higher rates of increase of soil consolidation at the first instants after installation. Regarding the anchor's ultimate capacity increase, a higher ratio was observed between the initial and ultimate capacities considering soils with higher undrained shear strengths.
When varying the permeability coefficient of the soil, an inverse proportional relation between this coefficient and the consolidation time was observed. For instance, if the permeability coefficient increases an order of magnitude, the consolidation time decreases in the same proportion, and vice-versa.
The empirical formulations presented in this study proved their potential to estimate the holding capacity of the finless torpedo anchors with good agreement to the FE approach. However, each of the empirical formulations fits better for different consolidation times after installation. Skov and Denver [18] formulation presented an excellent agreement for the first ten days after installation. ABS [20] formulation and API [21] adapted formulation agreed better for consolidation times over 100 days after the anchor installation. The Svinkin and Skov [19] formulation agreed well with the FE results. Moreover, with just a pair of numerical analyses, i.e., immediately after the anchor installation and the full consolidated soil, for instance, it is possible to calibrate the Svinkin and Skov [19] formulation and obtain a reasonable estimation of the anchor setup process with a relatively low computational effort.
Despite the insights obtained in the analyses of finless torpedo anchors, which may help design fixed points to anchor flexible lines, monobuoys or floating production systems in shallow waters, some important aspects were not addressed in this work. It is important to emphasize that the FE analyses did not consider thixotropic effects, and further investigations over this phenomenon are recommended. Thixotropy may rule the soil regain in the first instants of time after installation. Moreover, the effect of the setup when inclined loads are imposed on the anchor is another aspect that deserves future investigation. However, Sousa et al. [4] showed that, for inclinations between 40 degrees and 90 degrees (vertical), the holding capacity of the anchor can be obtained by simply projecting the pullout load in the considered direction. Finally, this study concentrated on finless torpedo anchors, but several torpedo anchors have fins that may also affect the soil stress state during installation. The effect of the fins has also to be considered in future studies.
Acknowledgments
Authors also thank the National Council for Scientific and Technological Development (CNPq) for the research grants PQ-311084/2019-2 and PQ-306357/2018-6, the Coordenação de Aperfeiçoamento de Pessoal de Nível Superior- Brasil (CAPES), Finance Code 001, and the Fundação Carlos Chagas de Amparo à Pesquisa do Estado do Rio de Janeiro (FAPERJ).
References
[1] Kim Y.H., Hossain M.S., Wang D., Randolph M.F. Numerical investigation of dynamic installation of torpedo anchors in clay. Ocean Engineering, 108:820-832, 2015.
[2] Zhao Y., Liu H. Toward a quick evaluation of the performance of gravity installed anchors in clay: Penetration and keying. Applied Ocean Research, 69:148-159, 2017.
[3] Lieng J.T., Kavli A., Hove F., Tjelta T.I. Installation of two prototype deep penetrating anchors at the Gjoa Field in the North Sea. In: Proceedings of the Offshore Technology Conference, Houston, Texas, USA, May 3-6, 2010.
[4] de Sousa J.R.M., de Aguiar C.S., Ellwanger G.B., Porto E.C., Foppa D., Medeiros Jr. C.J. Load capacity of torpedo anchors embedded in cohesive soils. Journal of Offshore Mechanics and Arctic Engineering, 133(2):021102, 2011.
[5] Han C., Liu J., Zhang Y., Zhao W. An innovative booster for dynamic installation of OMNI-Max anchors in clay: Physical modeling. Ocean Engineering, 171:345-360, 2019.
[6] Tong Y., Han C., Liu J. An innovative lightweight gravity installed plate anchor and its keying properties in clay. Applied Ocean Research, 94:101974, 2020.
[7] Zhao Y., Kim Y., Hossain M.S., Nazem M., Liu J., Hu Y. Numerical advancements on the analysis of dynamically installed anchors. Ocean Engineering, 182:343-359, 2019.
[8] Hossain M.S., Kim Y., Gaudin C. Experimental investigation of installation and pullout of dynamically penetrating anchors in clay and silt. Journal of Geotechnical and Environmental Engineering, 140(7):04014026, 2014.
[9] Bergset K. Radial consolidation of pore pressure induced by pile driving. Master Thesis, Norwegian University of Science and Technology, Trondheim, Norway, 2015.
[10] Komurka V.E., Wagner A.B. Estimating soil/pile set-up. Final Report, University of Wisconsin-Madison, 2003.
[11] Simulia. Analysis of driven pile setup with Abaqus/standard. Abaqus Technology Brief, 2007.
[12] Richardson M.D., O’Loughlin C.D., Randolph M.F., Gaudin C. Setup following installation of dynamic anchors in normally consolidated clay. Journal of Geotechnical and Environmental Engineering, 135(4):487-496, 2009.
[13] Radgahar E., Raie M.S., Motamani N. Simulation of torpedo-shaped (without fins) for semisubmersible offshore platforms under tensile force. Journal of Applied Environmental and Biological Sciences, 5(8S):107-111, 2015.
[14] Raie M.S., Tassoulas J.L. Simulation of torpedo anchor set-up. Marine Structures, 49:138-147, 2016.
[15] Sabetamal H., Carter J.P., Nazem M., Sloan S.W. Coupled analysis of dynamically penetrating anchors. Computers and Geotechnics, 77:24-44, 2016.
[16] Medeiros Jr. C.J. Low cost anchor system for flexible risers in deep Waters. Offshore Technology Conference, Houston, Texas, U.S.A., 6-9 May 2002.
[17] Abaqus/CAE v. 6.13-1. © Dassault Systèmes Simulia Corp., 2013.
[18] Skov R., Denver H. Time-dependence of bearing capacity of piles. In: Proceedings of the 3rd International Conference on Application of Stress-Waves Theory to Piles, Ottawa, May 25-27, 1988.
[19] Svinkin M.R., Skov R. Set-up effects of cohesive soils in pile capacity. In: Proceedings of the 6th International Conference on Application of Stress Waves to Piles, Sao Paulo, Brazil, September 11-13, 2000.
[20] ABS. Guidance notes on design and installation of dynamically installed piles, American Bureau of Shipping, USA, 2017.
[21] API. Recommended practice for planning, designing and constructing fixed offshore platforms – Working stress design. (RP 2A-WSD), 20th ed., American Petroleum Institute, USA, 2005.
[22]Helwany S. Applied soil mechanics with ABAQUS applications. John Wiley & Sons, Inc., Hoboken, New Jersey, 2007.
[23] Karlsrud K. Prediction of load-displacement behavior and capacity of axially loaded piles in clay based on analyses and interpretation of pile load test results. Doctoral Thesis at NTNU, Trodheim, 2012.
[24] Randolph M.F., Wroth C.P. Anaytical solution for the consolidation around a driven pile. International Journal for Numerical and Analytical Methods in Geomechanics, 3:217-229, 1979.
[25] Hill R. The mathematical theory of plasticity. Oxford University Press, 1950.
[26] Gibson R., Anderson W. In situ measurement of soil properties with the pressumeter. Civil Engineering and Public Works Review, 56:615-618, 1961.
[27] Keaveny J.M., Mitchell J.K. Strength of fine-grained soils using the piezocone. Use of In-Situ Tests in Geotechnical Engineering (GSP 6), ASCE, Reston/VA, 668-699, 1986.
[28] Carter J.P., Randolph M.F., Wroth C.P. Stress and pore pressure changes in clay during and after the expansion of a cylindrical cavity. International Journal for Numerical and Analytical Methods in Geomechanics, 3:305-322, 1979.
[29] Lopes G.K. Análise numérica da capacidade de carga de âncoras torpedo considerando efeitos de setup. Master Thesis at Federal University of Rio de Janeiro, Rio de Janeiro, Brazil, 2019.
[30] O’Loughlin C.D., Randolph M.F., Richardson M. Experimental and theoretical studies of deep penetration anchors. Offshore Technology Conference, Houston, Texas, U.S.A., 3-6 May 2004.
[31] True D.G. Undrained vertical penetration into ocean bottom soils. Ph.D. Thesis, University of California, Berkeley, California, 1976.
Document information
Published on 17/09/21
Accepted on 03/09/21
Submitted on 26/11/20
Volume 37, Issue 3, 2021
DOI: 10.23967/j.rimni.2021.09.002
Licence: CC BY-NC-SA license
Share this document
Keywords
claim authorship
Are you one of the authors of this document?