1 Introduction
Fatigue refers to the degradation of a material caused by repeatedly applied loadings. The loading levels that cause such damage may be much less than the material ultimate strength. Fatigue is widely studied in metals, mainly because metals fail in a brittle manner when they are subjected to cyclic loadings. The main damage process involved is the nucleation of a single dominant crack which eventually propagates until catastrophic failure. In composite materials, fatigue induces distributed damage before localizing a macro crack. This widespread damage is accompanied by stress redistribution involving a large amount of energy dissipation [1].
There are different life prediction methodologies for composite structures [2], from the traditional fatigue life models based on S-N curves, to more advanced phenomenological models based on residual stiffness and residual strength. The latter ones can also be referred to mechanistic damage models when they consider a variable with physical meaning (delamination growth or crack density) to define the damage evolution functions.
This work presents a stiffness-based phenomenological model, which is coupled with a residual strength model, and therefore is capable of predicting the life span and the damage accumulation of UD carbon/epoxy laminates under on-axis tension-tension fatigue loads.
2 Experimental work
The material investigated in this study is a high performance, intermediate modulus, carbon/epoxy tape. The laminate consists of six UD plies of 0.184 mm thickness. The panel was manufactured under standard aeronautic conditions. C-scan inspection did not reveal any significant flaw. The specimen is 15mm wide and 250 mm long. GFRP tabs of 60 mm length were used to avoid gripping problems. The mechanical and strength static properties were obtained following the ASTM standard .
Different load cases were applied to characterize the fatigue properties of the material, from 50% to 87.5% of the ultimate static strength, and also for different stress ratios R.
2.1 Test methodology
All tests were performed on a 250 KN servo-hydraulic test machine MTS810. The proposed methodology follows procedure A of ASTM D3479 [3] and also the works from Brunbauer et al. [4], [5]. The test starts with a displacement-controlled quasi-static test to measure the initial stiffness of the unfatigued specimen . Then, a load-controlled fatigue test is performed within a selected number of cycles, and then the stiffness is measured again quasi-statically. It should be noted that the maximum displacement applied to measure the stiffness must not exceed the peak displacement measured in the fatigue test. This procedure is repeated until fatigue failure occurs or the test is stopped at 2 million cycles.
The measure of the strain after some loading cycles becomes difficult to perform due to the surface damage that appear in most specimens. In this regard, Digital Image Correlation (DIC) has been proved to be a proper strain measure technique at the specimen edge surface where less damage seemed to occur.
3 Phenomenological model
The effect of fatigue damage is accounted in two different manners. First, it is considered that this distributed damage caused by repeated loading reduces the longitudinal stiffness of the ply. On the other hand, fatigue damage also weakens the material static strength. Within this context, two functions must be postulated; the first one describes the loss of the stiffness [6] and the second describes the loss of strength [7].
3.1 Fatigue damage function
The uniaxial response for a UD ply can be expressed as , or in dimensionless form, where is the normalized stress and is the normalized strain. The damage variable is a measure of the stiffness loss as .
It is assumed that static tensile loading does not degrade the longitudinal material properties prior to failure. Thereby, the material fails statically when . However, when a load is repeated for enough cycles the material degrades as follows:
|
|
(1) |
where d is the damage variable, Σmax is the normalized peak stress, c1-c4 are material fitting parameters. K is another measure for the stress ratio as:
|
|
(2) |
where σmax, σmin, σm, σa are the maximum, minimum, mean and amplitude stress, respectively.
Therefore, equation (1) describes the evolution of the longitudinal stiffness with respect to the number cycles for stress ratios in the range of tensile cyclic stresses (K>1). This expression can be explicitly integrated for a constant-amplitude load as:
|
|
(3) |
where d0 is the current damage state before applying a certain cycle jump ∆N for a prescribed cyclic load (Σmax and K).
3.2 Residual strength function
Residual strength models define the reduction of the static strength with respect to the loading cycles due to fatigue damage [7]. To characterize this strength reduction or residual strength in detail means breaking specimens at different fractions of life and at different stress levels, resulting in an expensive material property to obtain. However, a common assumption adopted in the literature is to consider that the ultimate strain is independent of fatigue damage [8]–[10].
If this assumption is valid, the material is expected to fail when Φ≤1, or i.e., Σ≤1-d. Consequently, this assumption provides that the evolution of the strength is of the same magnitude as the change of the stiffness 1-d. Obviously, the use of this hypothesis reduces the experimental characterization of phenomenological strength-based approaches.
The integral form of the residual strength function is well-known as S-N curve. The S-N curve estimates the number of cycles-to-failure under a constant-amplitude load test. Accordingly, the SN-curve is derived from equation (3) imposing the failure condition Σmax = 1-d as:
|
|
(4) |
4 Results
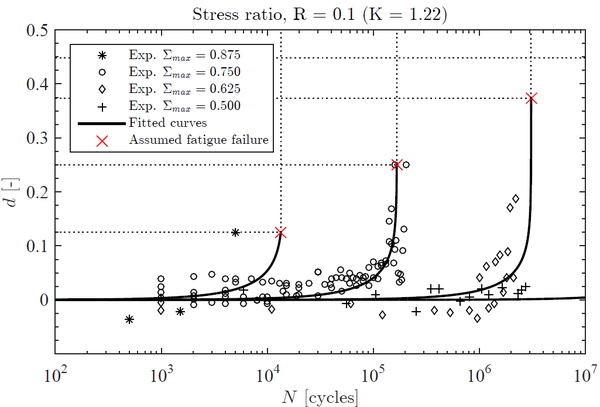
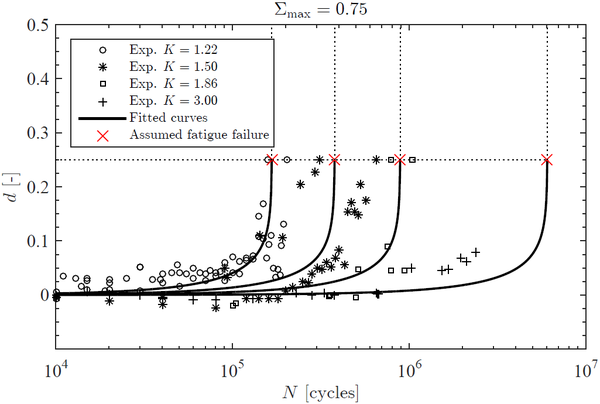
Figure 1 shows the fitted functions and the experimental data obtained for different stress levels and constant stress ratio K. The red crosses illustrate the assumed failure point for each test d=1- Σmax. For stress levels Σmax<0.5, the stiffness loss seems to be negligible up to 2 million cycles. Nevertheless, many specimens failed in the tabbed section for stress levels Σmax>0.75. These premature failures lead to an underestimation of fatigue life which should be interpreted carefully. Figure 2 depicts how fatigue life increases with the increase in the stress ratio K when the peak stress is kept constant. The best least square fitting for equation (3) is: c1=750, c2=22, c3=16 and c4=4.
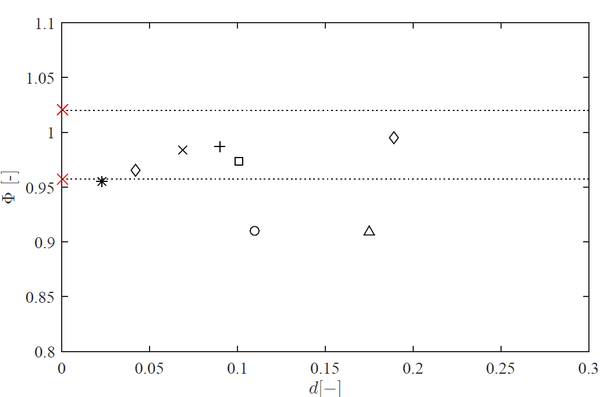
The assumption of a constant ultimate strain is appropriately validated in Figure 3. After some of the performed fatigue tests, the specimens were tested quasi-statically until failure and the ultimate strain was measured. If this residual strain is within the scatter of the ultimate static strain (red crosses), the hypothesis is admissible.
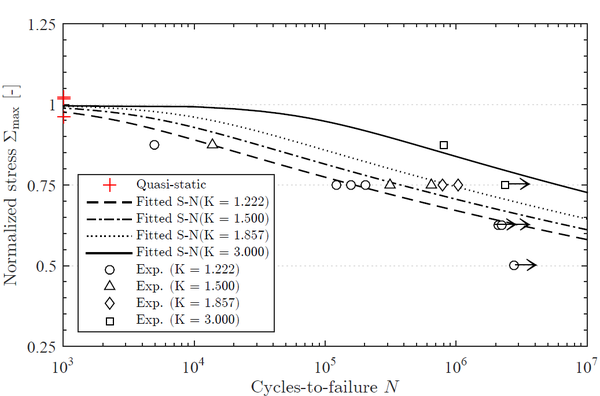
Finally, the experimental fatigue lives and the life predictions are compared in Figure 4.
5 Conclusions
An experimental characterization to study the residual stiffness and strength has been carried out in a UD carbon/epoxy laminate under on-axis T-T loads.
The excellent response of this particular material under fatigue and the application of relatively high stress levels to degrade the material, resulted in fatigue failures underneath the tabbed section. This is one important implication when testing fiber-dominated UD laminates under cyclic loadings [11]–[14]. Under these circumstances, the fatigue life computed in the experiments can be underestimated.
Phenomenological stiffness/strength based models present the inconvenience in determining the damage and residual strength functions with large experimental characterization programs. However, the assumption of a constant ultimate strain provides a relationship between the damage function and the residual strength function, which implies that the evolution of both properties is of the same magnitude. In this regard, the stiffness is a potential parameter to study the fatigue damage and can be measured continuously throughout the test.
The stiffness loss curve has been obtained for different cyclic loads. This curve shows two clear stages, a first linear stage that corresponds to some fiber breaks and matrix cracks, and a second stage where the stiffness drops abruptly. It is especially difficult to measure the stiffness loss in the last cycles due to the specimen surface damage. The use of DIC technique on the specimen edge seems to be a possible solution to measure the strain for specimens with severe surface damage.
The damage function defines the longitudinal stiffness loss with the number of cycles. This function is fitted by four material constants. On the contrary, the residual strength model, or its integral form the S-N curve, is derived imposing the ultimate strain hypothesis. By means of these two functions, a general S-N curve that accounts for different stress levels and stress ratios is finally obtained.
The life predictions were found to be in good agreement with the experimental data except for load cases with high stress levels where tab failure is unavoidable.
Acknowledgments
This work has been funded by the Spanish Government through the Project entitled ABORDA under the contract RTC-2014-1958-4, and also through the contract MAT2013-46749-R.
References
[1] C. Bathias, Int. J. Fatigue, vol. 28, no. 10, pp. 1094–1099, (2006). https://doi.org/10.1016/j.ijfatigue.2006.02.008
[2] J. Degrieck and W. Van Paepegem, Appl. Mech. Rev., vol. 54, no. 4, pp. 279–300, (2001). doi:10.1115/1.1381395
[3] ASTM D3479/3479M-12, Am. Soc. Test. Mater., (2013).
[4] J. Brunbauer and G. Pinter, in ECCM16, pp. 22–26, (2014).
[5] J. Brunbauer, F. Arbeiter, S. Stelzer, and G. Pinter, Adv. Mater. Res., vol. 891–892, pp. 166–171, (2014).
[6] W. Van Paepegem, in Fatigue Life Prediction of Composites and Composite Structures, A. P. Vassilopoulos, (2010).
[7] N. L. Post, J. J. Lesko, and S. W. Case, in Fatigue Life Prediction of Composites and Composite Structures, A. P. Vassilopoulos, (2010).
[8] H. A. Whitworth, Compos. Struct., vol. 40, no. 2, pp. 95–101, (1998). https://doi.org/10.1016/S0263-8223(97)00142-6
[9] W. Hwang and K. S. Han, J. Compos. Mater., vol. 20, pp. 154–165, (1986). https://doi.org/10.1177/002199838602000203
[10] W. Van Paepegem and J. Degrieck, Int. J. Fatigue, vol. 24, no. 7, pp. 747–762, (2002).
https://doi.org/10.1016/S0142-1123(01)00194-3
[11] I. De Baere, W. Van Paepegem, C. Hochard, and J. Degrieck, Polym. Test., vol. 30, no. 6, pp. 663–672, (2011).
doi:10.1016/j.polymertesting.2011.05.005
[12] I. De Baere, W. Van Paepegem, M. Quaresimin, and J. Degrieck, Polym. Test., vol. 30, no. 6, pp. 625–632, (2011).
doi:10.1016/j.polymertesting.2011.05.004
[13] I. De Baere, W. Van Paepegem, and J. Degrieck, Polym. Compos., vol. 30, no. 4, pp. 381–390, (2009).
doi:10.1002/pc.20564
[14] P. B. S. Bailey and A. D. Lafferty, Express Polym. Lett., vol. 9, no. 5, pp. 480–488, (2015).
Document information
Published on 14/10/18
Accepted on 14/10/18
Submitted on 14/10/18
Volume 02 - Comunicaciones Matcomp17 (2018), Issue Núm. 4 - Comportamiento en servicio de los materiales compuestos (2), 2018
DOI: 10.23967/r.matcomp.2018.10.020
Licence: Other
Share this document
Keywords
claim authorship
Are you one of the authors of this document?


