Abstract
In this study, the Fluent software is utilized to simulate the lateral impact force on a tank during liquid sloshing when the tank is subjected to turns under varying steering accelerations and filling rates. It is observed that at a steering acceleration of 0.5g, the overall force vector pointing in the lateral direction of the tank body significantly increases the likelihood of tipping. A clear trend arises when steering acceleration is held constant; as filling rates range from 0.6 to 0.85, lateral impact forces due to tank liquid sloshing progressively increase with rising filling rates, whereas a decrease in force occurs between filling rates of 0.85-0.9. This analysis reveals that tanker truck safety is relatively high during turning maneuvers when the filling rate is between 0.85 and 0.9 and the steering acceleration is in the range of 0.1-0.4g.
Keywords: Liquefied natural gas, tanker truck, numerical simulation, transportation safety, liquid shaking impact
1. Introduction
In recent years, accelerating socio-economic development has resulted in a significant increase in global demand for liquefied natural gas (LNG) as a clean energy source. Throughout the 20th century, oil and coal served as predominant energy sources, however, escalating prices and associated environmental concerns, such as pollution, climate change, and global warming, have prompted countries to pivot towards more sustainable options. Natural gas has emerged as a clean, environmentally friendly, affordable, and cost-effective energy solution, finding widespread applications across industries, commerce, chemicals, power generation, residential gas, fuel cells, and alternative transportation fuels. LNG is primarily transported via pipelines and long-distance tankers. Although pipelines often incur high costs, their geographical reach is limited, leaving many areas devoid of direct access to natural gas. Consequently, large LNG tankers have become indispensable for road transportation, ensuring natural gas supply and contributing to secure energy provisioning and regional economic growth. This trend has spearheaded the rapid expansion of the LNG road tanker transportation industry [1]. However, the accelerated growth of the LNG road tanker transportation sector necessitates stringent safety measures, given that LNG is a mobile hazard during transit, due to its low-temperature, high-pressure, and combustible properties. These factors have the potential to yield catastrophic accidents, economic losses, and environmental pollution, causing considerable impacts on society and public wellbeing. As such, ensuring the safe and secure transportation of LNG is of utmost importance.
In recent years, coinciding with rapid socio-economic development, the demand for liquefied natural gas (LNG) as a clean energy source has surged substantially across the globe. Accordingly, the short-distance and small-volume road transportation of LNG in tanker trucks has experienced a swift expansion. As a result, an increasing number of researchers, both domestically and internationally, have focused their efforts on investigating the safety aspects of LNG road tanker truck transportation.
Rees [2] elucidates the electrostatic discharge and heat conduction phenomena occurring between the tank medium and the tanker body, postulating that the transportation of flammable and explosive hazardous materials, such as gasoline, may result in fire or combustion explosions driven by static electricity and heat conduction. This analysis lays a foundational framework for further studies on road transportation safety in tank trucks. Beiyou et al. [3] successfully developed a sophisticated HEAT-UP model to predict temporal changes in tank wall temperature, tank medium temperature, and tank pressure for safety valves of varying sizes, tank volumes, and tank medium filling rates that have reached the safety valve opening limit for the first time. Birk [4] constructed a tank car model tailored for the transportation of hazardous materials, such as gas or liquid, and simulated the structural response and transient thermal distribution of the tank body under impact flame conditions. Lloyd et al. [5] devised a scaled-down model of conventional road tank cars at a 1:6 ratio, investigating the influence of the number and design format of baffles inside the tank car on the liquid's longitudinal sloshing behavior. The simulation results demonstrate that among the various baffle configurations tested, perforated baffles exhibit the most optimal outcome, generating the minimal sloshing impact force while enabling lightweight vehicle design. Such results contribute significantly to enhancing transportation efficiency and ensuring safety. Shimanovsky et al. [6] scrutinized the liquid sloshing-induced impact forces exerted on the designed baffles within the tank during road transportation of liquid goods, as well as the stress distribution along the tank walls. Assessing the stress distribution across the tank body and different baffle designs, they determined that a baffle thickness of approximately 3 millimeters resulted in the lowest stress extreme value. To further their research, the investigators employed the ANSYS FLUENT fluid mechanics software to analyze impact phenomena within the tank of liquified natural gas-transporting tank cars, thereby determining impact forces, torque, and other pertinent parameters on the tank wall triggered by liquid sloshing during transit. These findings were instrumental in ensuring road transportation safety for tank cars [7]. Sun and Zhou [8] employed Fluent simulation software to address the multiphase flow problem, simulating the sloshing and impact phenomenon of liquid within a tank caused by emergency braking of a tank car. They investigated pressure changes inside the tank during the impact process, taking into account the filling amount, density, and viscosity of the medium. Kolaei et al. [9] examined the impact force of medium flow within the tank on the body and the steady-state driving performance of road tank cars under partially-loaded conditions. By employing linear sloshing theory, they formulated a solution model and utilized the variational method to verify the initial sloshing frequency and the established model, ultimately resolving transient lateral impact force and torque on the tank body. To improve rollover stability for road tank vehicles when driving under partially-loaded conditions, they proposed a method for diminishing liquid sloshing by lowering the vehicle's center of gravity. Hu et al. [10] analyzed the connection between lateral stability of tank trucks carrying liquid cargo and the liquid sloshing inside the tank during transit, investigating the variations in lateral impact force and torque generated by sloshing under different lateral acceleration and filling rate conditions. Yu [11] explored the driving stability of liquid tank trucks by constructing a liquid impingement simulation test bench within the tank. Employing both experimental and numerical simulation methodologies, Yu was able to safely and intuitively observe the liquid impingement phenomena and related motion dynamics.
Upon reviewing the existing literature on road transportation safety of hazardous materials like liquefied natural gas, it is apparent that the majority of studies conducted by domestic and international scholars have primarily focused on how factors such as personnel, management, environment, and transportation vehicles influence safety. Additionally, research often addresses concerns surrounding natural gas leakage and diffusion following accidents. However, these studies tend to overlook the significance of the physical and chemical properties of liquid hazardous goods, such as liquefied natural gas. Consequently, the effects of changes in vehicle operating states and the consequential liquid sloshing-induced impacts on the tank body, leading to potential rollover accidents of LNG road tankers and potential secondary incidents, are often undervalued. To address this gap, further investigation is required to understand the implications of liquid sloshing in liquefied natural gas tank cars and the subsequent impact on the tank body during transportation, which may result in a series of accidents caused by tank car rollovers. Ultimately, implementing recommendations and proposing measures to mitigate and prevent such accidents will contribute to ensuring the safe transportation of hazardous materials.
2. Impact dynamics equation and mathematical model of tank truck
2.1 Control equation of liquid impact dynamics equation:
The fundamental dynamic equation for liquid impact can theoretically depict the movement and change law of fluid, adhering to the principles of physical conservation laws. These include conservation of mass (continuity equation), conservation of momentum (equations of motion), and conservation of energy (energy equation). In our study, we will not consider temperature variations and energy losses in the fluid flow field; instead, we will focus on the three-dimensional motion state of incompressible viscous fluid within the tank under the influence of a specific acceleration.
In line with the principle of conservation of mass, the continuity equation for fluid in differential form can be expressed as follows:
|
|
(1) |
Among them, represents the velocity of the fluid on the surface of the element, the density, and the time.
In the Cartesian coordinate system, it is:
|
|
(2) |
where and represent the three components of velocity in the and directions. LNG can be regarded as an incompressible viscous fluid, then is a constant, and in a steady flow, , the continuity equations obtained from Eqs. (1) and (2) are:
|
|
(3) |
Represented in Cartesian coordinate system as:
|
|
(4) |
According to the Conservation of momentum, the equation of fluid in differential form is expressed as:
|
|
(5) |
LNG is Newtonian fluid, so in combination with Newton's internal friction law and Newtonian fluid's Constitutive equation:
|
|
(6) |
where represents the fluid pressure, is the dynamic viscosity of the fluid, is the "Kronecker" tensor (when , , when , ), and is the deformation rate tensor of the fluid, and satisfies:
|
|
(7) |
Substituting Eq. (6) into Eq. (5) yields:
|
|
(8) |
For incompressible fluid, according to the continuity equation, , Eq. (8) can be simplified as:
|
|
(9) |
The representation of Eq. (9) in Cartesian coordinate system is:
|
|
(10) |
|
|
(11) |
|
|
(12) |
where , , and are the three unit mass forces along the and axes, respectively, and is the density of the fluid.
2.2 Parameter selection
During the transportation of liquefied natural gas in tank cars, the liquid inside the tank experiences impingement. The tank encompasses an interface between liquid and gas, commonly referred to as a free liquid surface, and a corresponding contact surface exists between the tank wall and the fluid medium.
At the contact surface, the liquid particle velocity is equivalent to the tangential and normal velocities on the tank wall. A no-slip boundary condition can be established between the fluid and the tank wall, and it can be expressed as follows:
|
|
(13) |
where is the velocity of the fluid relative to the tank wall, and is the movement velocity of the tank wall.
During the transportation of liquified natural gas tankers, the free liquid level within the tank undergoes constant changes as a result of external excitations. The boundary conditions of the free liquid level are constrained by the impact velocity and force of the liquid. Additionally, this study does not take into account the effects of temperature changes, liquid surface tension, or the viscous interactions between gas and liquid phases. Consequently, the surface pressure on the free surface remains consistently constant. Thus, the free surface boundary conditions can be defined as follows:
|
|
(14) |
When simulating liquefied natural gas using Fluent software, the dynamic viscosity coefficient for LNG is set at 5.253×10⁻³ kg/(m·s) with a density of 460 kg/m3. The gas phase natural gas has a dynamic viscosity coefficient of 0.9958 × 10⁻⁵ kg/(m·s) and a density of 0.872 kg/m3, disregarding the air proportion. In the simulation, the tank's liquid filling volume is assumed to be 53.6 m3, and the total volume of the tank is 63.0 m3, with an 85% filling rate. The tank wall is considered a rigid body, with the tank's gas and liquid assumed to be in a static state relative to the tank under initial condition. The free surface is parallel to the plane, the wall is set as stationary, and the inner tank wall satisfies the no-slip boundary condition. The computational model employed in the simulation is the pressure solver with the standard VOF multiphase flow model selected as the multiphase flow model, and the PISO algorithm chosen as the numerical algorithm. Specific parameter settings are presented in Table 1.
| Parameters | Options | |
|---|---|---|
| Calculation mode | 3D Single Precision (3D) | |
| Solver Type | Pressure Based Solver | |
| Time type | Transient problem | |
| physical model | Multiphase VOF model | |
| turbulence model | Standard k-epsilon model | |
| Material properties | Liquid natural gas is the main phase, and the second phase is gaseous natural gas | |
| boundary condition | The wall meets the non slip boundary condition | |
| boundary condition | Pressure velocity coupling method PISO | |
| Convection term discretization scheme | second order upwind | |
| Pressure discrete format | Bdoy Force Weighted format | |
| Time Discrete Format | First-order implicit scheme | |
| time step | 0.001s | |
2.3 Mathematical model of tank truck
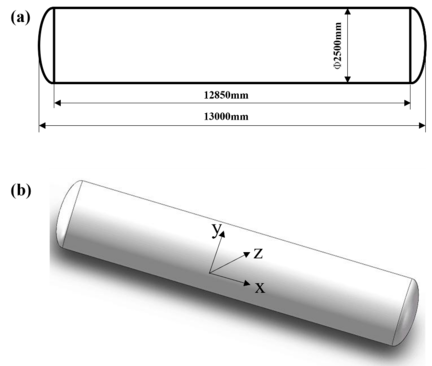
In the research process of this article, a HZZ9400GDY semi-trailer low-temperature liquid transport vehicle was chosen as the research model, with the tank body simplified as consisting of a cylinder and two elliptical heads on either end. The total length of the tank body is 13,000 mm, and the diameter of the cylindrical section is 2,500 mm. A 1:1 scale geometric analysis model of the tank body was created in Gambit software, with the x-axis parallel to the ground and representing the forward driving direction of the tank car. The y-axis is perpendicular to the ground, pointing upwards, while the z-axis points towards the outside of the tank body, adhering to the right-hand rule. The tank body model is presented in Figure 1. Assuming the fluid domain fully occupies the entire tank body, the whole structure is meshed with hexahedral elements, resulting in 1.87 million mesh elements.
|
| Figure 1. Tank model diagram. (a) Geometric dimension diagram of the tank. (b) 3D model diagram of the tank body |
2.4 Tank car turning model
During turns, liquefied natural gas tank cars are subjected to sudden steering acceleration, which is parallel to the ground and perpendicular to the axis. This acceleration causes the liquid within the tank to experience lateral sloshing, exerting force on the tank body. When this force reaches a critical threshold, the tank car may roll over, leading to severe damage and losses. The magnitude of the force generated by the liquid sloshing in the tank when the tank car turns can be represented by components in the x, y, and z directions, with the specific expression given as follows:
|
|
(15) |
|
|
(16) |
|
|
(17) |
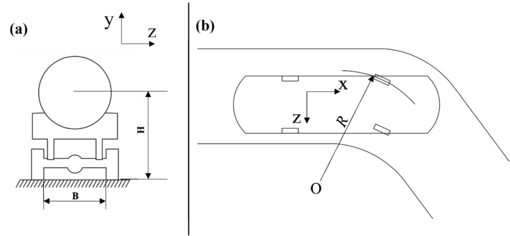
where , , and represent, respectively, the transient forces along the , , and directions that impact the tank body due to the shaking of the liquid inside the tank; denotes the unit pressure generated by the shaking of the liquid in the tank, while refers to the unit area vector. Additionally, , , and represent unit vectors in the , , and directions, respectively. The schematic diagram of the tank car turning structure is illustrated in Figure 2. The coordinate system represents a three-dimensional coordinate system fixed at the center of the tank body, with the tank car moving in the direction and turning in the negative direction. The tank car is assumed to exhibit circular motion around point O.
|
| Figure 2. Tank car turning model diagram. (a) direction diagram. (b) directional diagram |
During the road transportation of liquefied natural gas in tankers, the internal tank volume may expand, and gas pressure may increase due to external temperature fluctuations. To prevent overpressure evaporation and ensure transportation safety, the filling rate of the tank body should not exceed 90%. In actual road transportation scenarios, considering economic factors, the filling rate of the liquid in the tank should not fall below 50%. For this study, filling rates of 0.6, 0.8, 0.85, and 0.9 were chosen for analysis.
The lateral acceleration experienced by a tanker during a rollover event is referred to as the rollover threshold and can be represented as follows:
|
|
(18) |
where: represents the lateral acceleration, is the Gravitational acceleration, denotes the track width between wheels, is the height of the vehicle's center of gravity, and corresponds to the angle of the ramp. The range of rollover thresholds for heavy trucks is shown in Table 2. As the liquefied natural gas tanker in this study is categorized as a heavy-duty truck, its rollover threshold range lies between 0.4g and 0.6g. Consequently, in the subsequent analyses throughout this article, steering accelerations (a) of the tank car during turning maneuvers are considered as 0.1g, 0.2g, 0.3g, 0.4g, and 0.5g for evaluation.
| Vehicle type | Centroid height/cm | Track width/cm | Rollover threshold |
|---|---|---|---|
| Heavy truck | 154-216 | 178-183 | 0.4g-0.6g |
3. Results and Discussion
3.1 Simulation study on the turning process of tank cars
When the tank truck operates at a steady state with a liquefied natural gas filling rate of , the distribution of gas-liquid two-phase flow and pressure inside the tank is depicted in Figure 3. In this figure, the blue area above represents the gas-phase natural gas, while the red area below illustrates the liquid-phase natural gas. Owing to the initial static state of the liquid relative to the tank body, it can be observed from Figure 3(b) that the maximum absolute pressure of the liquid inside the tank amounts to Pa. The design working pressure requirement for the tank body of the chosen tank truck in this study is less than Pa. This observation also preliminarily verifies the accuracy of the established liquefied natural gas tanker tank model and the relevant parameter settings in the simulation calculation process.

|
| Figure 3. Cloud chart of gas-liquid phase distribution and pressure in the tank at the initial time |
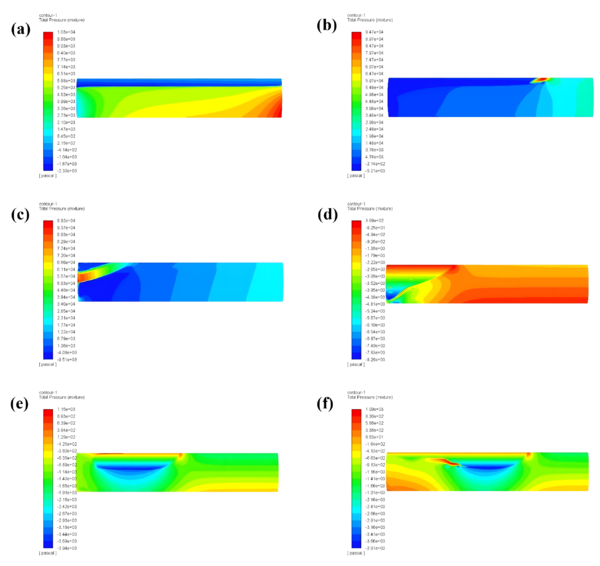
Figure 4 shows the changes in pressure inside the tank during the turning process of a tank car with a steering acceleration of 0.5g at six times: 0.1s, 0.5s, 1s, 2s, 3s, and 4s.
|
| Figure 4. Cloud chart of pressure in the tank at different times. (a) 0.1s. (b) 0.5s. (c) 1 s. (d) 2s. (e) 3s. (f) 4s |
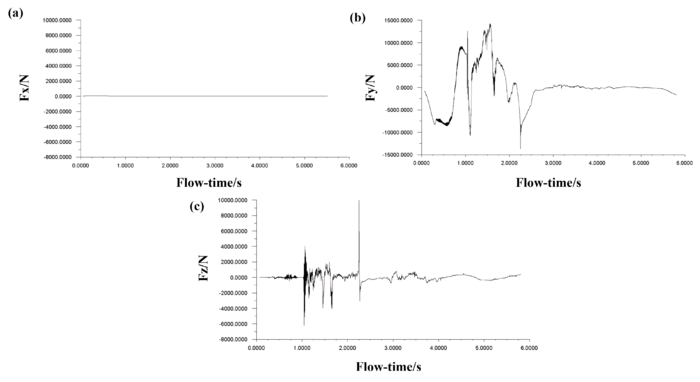
During the tank car's turning process, the sloshing of the medium inside the tank causes impact forces to be exerted on the tank body in three directions: , , and . These impact forces fluctuate over time throughout the turning maneuver. The specific curves illustrating the relationship between impact force and time are presented in Figure 5.
|
| Figure 5. Changes in force on the tank body in different directions. (a) -direction. (b) -direction. (c) -direction |
Figure 5(a) illustrates that the impact force on the tank body in the x-direction is approximately zero, which aligns with the observation that the tank body, in the driving direction of the tank car, is minimally affected by the liquid's impact force during turning. This observation further corroborates the rationality of the tank car model and the accuracy of the simulation calculation. Figure 5(b) demonstrates that during the initial period following the start of the turn, the force on the tank body in the opposite direction gradually increases. After reaching a peak, the force begins to decrease. At the 0.55-second mark, it starts to increase in the positive direction, followed by a gradual decrease. This cycle repeats until the turning time reaches 2.5 seconds, at which point the force gradually fades, nearing zero. This occurs because when the tank car initiates the turn, the liquid inside the tank experiences sloshing due to the inertial forces, generating an impact force on the tank body. The force peaks when the liquid's sloshing is most violent, causing irregular changes in the force exerted on the upper and lower walls of the tank body over time.
Figure 5(c) depicts that the force exerted on the tank body in the z-direction is almost negligible during the first second of turning but undergoes a significant change afterward. It rapidly increases in both positive and negative directions along the z-axis, declines after reaching the first peak, and then gradually increases again, peaking at 9,993.64 N in 2.25 seconds before reducing sharply. After 2.5 seconds, the force virtually disappears, approximating zero. This occurs because when the tank car turns, the liquid within the tank is subjected to the steering acceleration, which causes the liquid to slosh due to centripetal forces, resulting in a lateral impact force on the tank body. When the force is at its maximum, the liquid is sloshing most intensely. The force subsequently decreases on the front wall of the tank body and gradually increases on the rear wall. This is attributed to the liquid's movement, which is initially obstructed by the front wall before shifting direction and surging towards the rear wall, consequently generating an impact force on the latter.
3.2 Simulation study under different steering accelerations
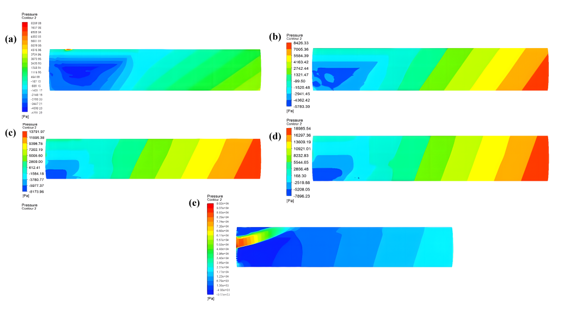
With a filling rate of , the tank car maintains a constant speed prior to turning, initiating the turn at time t=0. The pressure distribution cloud maps representing the maximum pressure inside the tank under five different steering acceleration conditions (0.1g, 0.2g, 0.3g, 0.4g, and 0.5g) are simulated and presented in Figure 6.
|
| Figure 6. Cloud plots of maximum pressure inside the tank at different turning accelerations. (a) g (s); (b) g (s); (c) g (s); (d) g (s); (e) g (s) |
From Figure 6, the following conclusions can be drawn: at g, the maximum pressure occurs at s, amounting to 8,289 Pa; at g, the maximum pressure occurs at s, reaching 8,426 Pa; at g, the maximum pressure occurs at s, with a value of 13,791 Pa; at g, the maximum pressure occurs at t=1s, registering 18,958 Pa; and at g, the maximum pressure occurs at s, totaling 99,200 Pa. Under varying steering accelerations, the liquid's agitation causes the maximum pressure inside the tank to rise in correlation with increasing steering acceleration, with greater acceleration resulting in a shorter time for the pressure to reach its maximum value.
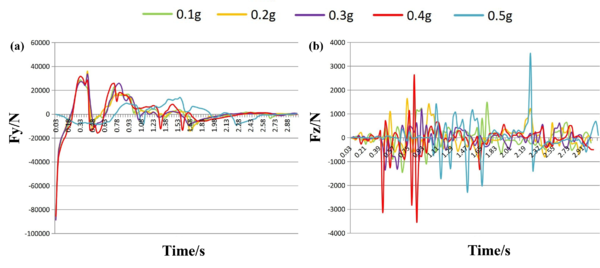
Figure 7(a) and Figure 7(b) display the run charts of the impact force generated by liquid sloshing in the tank on the tank body in the and directions over time, under a filling rate of 0.85 and differing steering accelerations. The figures indicate that the trends of impact force on the tank body in the and directions over time are generally consistent, with both the amplitude and extreme values increasing as steering accelerations rise. This suggests that the greater the steering acceleration during the tank car's turning, the larger the maximum lateral impact force on the tank body. The primary reason for this is the increased inertial and centripetal forces on the tank body during turning, which cause intensified liquid sloshing and an increased maximum force. Moreover, it is observed that when the steering acceleration is 0.5g, the impact force in the -direction on the tank body changes significantly over time compared to accelerations ranging from 0.1g to 0.4g, while in the -direction, the variation is relatively larger. This implies that the overall direction of the impact force on the tank body at 0.5g is more likely to be oriented in the -direction as opposed to accelerations between 0.1g and 0.4g. Hence, when the tank car turns with a steering acceleration of 0.5g, its safety is comparatively lower, and rollover risk is present. This finding aligns with the rollover threshold for heavy-duty liquefied natural gas trucks specified in Table 2.
|
| Figure 7. Changes in force on the tank body in different directions under different steering accelerations. (a) -direction; (b) -direction |
3.3 Simulation study under different filling rates
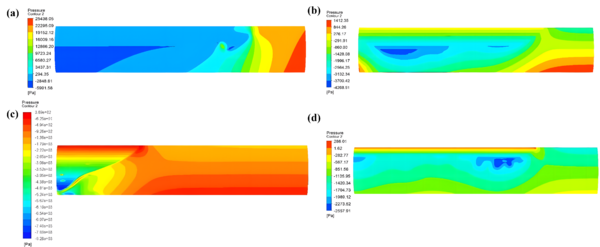
With a steering acceleration of g, the tank car maintains a constant speed prior to turning and commences the turn at time . The pressure distribution cloud maps showcasing the maximum pressure inside the tank under four different filling rate conditions (0.6, 0.8, 0.85, and 0.9) are simulated and depicted in Figure 8.
|
| Figure 8. Cloud chart of the maximum pressure change in the tank under different filling rates. (a) . (b) . (c) . (d) |
Figure 8 reveals that under different filling rates: at , the maximum pressure occurs at t=1s with a value of 25,438 Pa; at , the maximum pressure occurs at t=3s, amounting to 1,412 Pa; at , the maximum pressure occurs at t=4s, totaling 369 Pa; and at , the maximum pressure occurs at t=5s, registering 286 Pa. These results suggest that the maximum pressure inside the tank decreases as the filling rate increases, and it takes longer for the pressure to attain its maximum value. The highest maximum pressure is observed at , signifying the most pronounced liquid sloshing. Conversely, when the filling rates are and 0.9, the maximum pressure values inside the tank are considerably low, indicating minimal liquid sloshing amplitude.
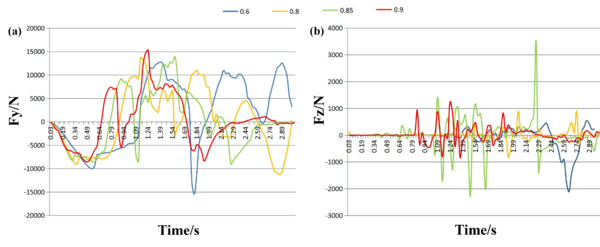
Figures 9(a) and 9(b) present the run charts of the impact force generated by liquid sloshing in the tank on the tank body in the and directions over time, under a steering acceleration of 0.2g and varying filling rates. The figures show that the force on the tank body in the -direction sharply increases during the initial period, then gradually decreases after achieving the first peak, followed by a rapid increase in the positive direction, decrease, and so forth. This occurs because, when the tank car initiates turning, the liquid within the tank oscillates due to the centripetal acceleration. The maximum force on the tank body corresponds to the most violent liquid sloshing. Concurrently, it can be observed that the impact force in the -direction diminishes as the filling rate increases. This is due to the larger available space inside the tank at smaller filling rates, which, when the tank car starts to turn, results in greater liquid sloshing amplitude and thus a larger force on the tank body.
|
| Figure 9. Changes in force on the tank body in different directions under different filling quantities. (a) -direction. (b) -direction |
From Figures 9(b), it is observed that the force on the tank body in the -direction remains minimal in the initial period and subsequently increases gradually, with the force fluctuating in both positive and negative directions of . This is because during the tank car's turning process, the liquid in the tank initially moves primarily in the -direction due to inertia force, causing the force in the -direction to approach zero. As the inertia force dissipates, the liquid in the tank generates an impact force on the tank in the -direction under centripetal force. When the filling rate is less than 0.85, the impact force rises with increasing filling rate, reaching its peak at a 0.85 filling rate. In contrast, for filling rates above 0.85, the impact force on the tank body decreases with increasing filling rate. This indicates that when the liquid filling rate of the tank exceeds 0.85, the tank car exhibits the least liquid sloshing during turning and driving, resulting in the minimal -direction impact force on the tank body.
4. Conclusions
In this study, Fluent software is employed to simulate and analyze the impact force generated by the liquid sloshing inside the tank during the turning of a tank car, with a focus on the comparison and analysis of impact forces produced under different lateral accelerations and filling rates. The primary findings are as follows:
(1) Under a constant tank filling rate, an increase in steering acceleration results in more intense liquid sloshing within the tank. Both the vertical and lateral impact forces on the tank body fluctuate over time, with trends remaining largely consistent. The changing amplitude and extreme values grow as the steering acceleration increases. When the steering acceleration reaches 0.5g, the impact force in the -direction on the tank body undergoes a marked change in comparison to accelerations within the range of 0.1g-0.4g, while in the -direction, it is considerably larger. This finding implies that the overall direction of the impact force on the tank body at 0.5g is more likely to be oriented in the -direction as opposed to accelerations between 0.1g-0.4g. Consequently, the safety of a tank car cornering with a steering acceleration of 0.5g is relatively lower, resulting in a potential rollover risk.
(2) When the tank car turns at a specific turning acceleration, the vertical impact force on the tank body caused by liquid sloshing within the tank decreases as filling rate increases. The lateral impact force on the tank body increases with the rise in filling rate when the rate falls between 0.6 and 0.85; however, it diminishes as the rate increases between 0.85 and 0.9. A filling rate within the range of 0.85-0.9 is most favorable for the secure transportation of tank cars.
References
[1] Xu J.X., Lin W.S., Chen X., Zhang H. Review of unconventional natural gas liquefaction processes. Front Energy Res., 10, 915893, 2022.
[2] Rees W.D. Static hazards during the top loading of road tankers with highly insulating liquids: flow rate limitation proposals to minimize risk. J. Electrostat., 11(1):13-25, 1981.
[3] Beiyou G.V., Cowley L.T., Smalletal M.L. Fire engulfment of LPG tanks: Heatup, a predictive model. J. Hazard Mater., 20(2):227-238, 1988.
[4] Birk A.M. Modelling the effects of a torch-type fire impingement on a rail or highway tanker. Fire Safety J., 15(4):277-296, 1989.
[5] Lloyd N., Vaiciurgis E., Langrish T.A.G. The effect of baffle design on longitudinal liquid movement in road tankers: an experimental. Process Safety and Environmental Protection, 80(4):181-185, 2002.
[6] Shimanovsky A.O., Kuznyatsova M.G., Pleskachevskii Y.M. The strength analysis of the partitions in road tank reservoirs. Procedia Eng., 48:607-612, 2012.
[7] Zakaria M.S., Osman K., Saadun M.N.A., Manaf M.Z.A., Mohd Hanafi M.H. Computational simulation of boil-off gas formation inside liquefied natural gas tank using evaporation model in ansys fluent. Appl. Mech. Materials, 393(5):839-844, 2013.
[8] Sun L.N., Zhou G.F. Numerical simulation for liquid sloshing process of a tank truck. J. Vib. Shock, 2012(22):147-150, 2012.
[9] Kolaei A., Rakheja S., Richard M.J. Effects of tank cross-section on dynamic fluid slosh loads and roll stability of a partly-filled tank truck. Eur. J. Mech. B-Fluid, 46:46-58, 2014.
[10] Hu X.M., Li W.L., Zhao Z.G., Sun L. A study on the lateral sloshing of liquid in the tank body of a liquid tank truck. Chin. J. Appl. Mech., 30(5):641-646, 2013.
[11] Yu D. Research on liquid sloshing non-linear model and driving stability of partially-filled tank trucks. Jilin University, 2016.Document information
Published on 13/11/23
Accepted on 06/09/23
Submitted on 18/07/23
Volume 39, Issue 4, 2023
DOI: 10.23967/j.rimni.2023.09.004
Licence: CC BY-NC-SA license
