Abstract
The energy use in buildings has to be decreased to reach the targets and regulations in the European Union. One way of reducing the energy demand is to use vacuum insulation panels (VIP) in the building envelope. To make sure the declared thermal properties of the VIP are valid for the mounted panels, in situ measurements are needed. The transient plane source (TPS) method allows fast measurement of the thermal properties of a variety of materials. However, the large anisotropy of the VIP makes it hard to interpret the temperature increase in the TPS sensor. This paper presents a comparison between an analytical solution, numerical simulations and TPS measurements of polystyrene and polystyrene with aluminum film. Polystyrene and aluminum were used instead of VIP to increase the number of setups. The numerical simulation model was validated by comparing the simulated temperature increase with an analytical solution for the polystyrene sample. The simulated temperature increase in the polystyrene sample after 40 s was 7.8% higher than the TPS measurements. For the case with polystyrene with aluminum film, the deviation was 5.7%. Losses in the wires of the TPS sensor, uncertainties regarding the material parameters and surface resistances could explain the deviations.
Keywords
Thermal properties ; Transient plane source ; Vacuum insulation panel ; Analytical solution ; Numerical simulation ; Measurement
1. Introduction
There is a large focus on reducing the energy demand for heating of buildings in Europe. The European Parliament has defined the targets as a cut on energy consumption with 20% in 2020 and 50% in 2050. To reach these targets, the existing building stock is in need of energy retrofitting measures. One possible way of reducing the energy demand for heating is to use vacuum insulation panels (VIP) in the building envelope.
VIP consists of a porous core material encapsulated by a metalized multi-layered polymer film. The film is prone to damages and creates thermal bridges around the panels. The pristine thermal conductivity of the panel is 4 mW/(m K) but with regard to aging effects, a thermal conductivity of 7–8 mW/(m K) should be used in design calculations (Simmler et al., 2005 ). In case a panel is punctured the thermal conductivity increases to 20 mW/(m K) for a VIP with fumed silica in the core. Therefore it is important to ensure that panels mounted in the building envelope are undamaged and have the declared thermal conductivity.
In situ measurements of the thermal conductivity on the construction site are complicated with the techniques available today. On the other hand, at the VIP production plant, the thermal conductivity of the finished VIP can be measured by an indirect measurement method which is described by Caps (2004) . The measurement method is integrated in the quality assurance process of the VIP production line. An integrated heat sink in the core material together with a fiber material of known thermal conductivity at different pressures makes it possible to determine the thermal conductivity of the panel. A warm sensor is placed on the surface of the panel, close to the heat sink, during a specified time period. The temperature decrease of the sensor is registered and with the known relation between the temperature decrease and thermal conductivity of the fiber material, the interior pressure of the VIP can be determined (Caps, 2004 ).
It is interesting to study whether the method described by Caps (2004) can be refined and if it is possible to use without the heat sink material for in situ measurements of VIP. In an earlier study Johansson et al. (2011) compared the temperature increase from the transient plane source (TPS) sensor with numerical three-dimensional simulations. The results showed that the TPS method could be modified to be feasible for VIP measurements.
This study aims to explore the TPS method further and investigate the applicability of the TPS method for measurements of thermal properties on VIP. A numerical simulation model in circular coordinates was used together with an analytical solution to calculate the temperature increase in the TPS sensor in two different setups. In the first setup the TPS sensor was clamped between two samples of pure polystyrene and in the second setup a thin aluminum film covered the polystyrene.
The TPS sensor used in the setup had a radius of 6.4 mm and was placed between two samples (70×70×20 mm3 ) of the material. A constant electric power of 0.02 W was conducted through the spiral and the electric resistance was registered and transformed into a temperature increase. The measurements are based on 8 subsequent measurements with 30 min break between.
2. The transient plane source method
Before introducing the measurements and modeling of the TPS method it is good to have knowledge of the measurement technique. The TPS method uses a circular double nickel spiral, 10 μm thick, sandwiched between two layers of Kapton (polyimide film), each 25 μm thick, in contact with the material sample. The spiral serves both as the heat source and as a resistance thermometer. The sensor is clamped between two samples of the same material and a constant electric power is conducted through the spiral. Heat is developed which raises the temperature and thus the resistance of the spiral. The rate of this temperature increase depends on how quickly the heat developed in the spiral is conducted away through the surrounding material. Heating is continued for a period of time, with the voltage across the coil being registered. As the power is held constant, the voltage changes in proportion to changes in the resistance of the coil. With knowledge of the voltage variation with time i.e., variation of temperature with time and the heat flow, it is possible to calculate the thermal conductivity and volumetric heat capacity of the material. The mathematical solution used in the TPS method is described by Gustafsson (1991) .
A number of studies of comparisons between TPS method and steady-state measurement techniques have been described in the literature. Almanza et al. (2004) tested the TPS method on low-density polyethylene foams with different density. The results were compared to steady-state measurements using heat-flow meters. It was found that the results from the TPS method follow the same trends as the steady-state measurements. However, the values obtained with the transient measurements were always 20% higher than the steady-state results. Round robin tests of the steady-state method showed that it has a precision of ±2.5%, while the precision of the TPS method still has to be evaluated. Furthermore, Almanza et al. (2004) discussed the sources of the deviation between steady-state and transient measurements. One of the suggested sources was the initial temperature gap between the heat flow sensor and the surfaces of the sample. By removing the first measurement points from the results, the deviation decreased by 7%. Other possible contributions to the deviation were the stiffness of the sample, differences in the average temperature in the sample and the different size of samples used in the two methods. Almanza et al. (2004) concludes that the TPS method is a powerful tool for comparative studies of thermal properties, but that the interpretation of the absolute values given by the method should be done with care.
Analytical solutions or numerical simulations can be used in the evaluation of thermal properties based on the temperature increase in a sensor during transient conditions. Model (2005) proposed a method for determination of the thermal properties of layered materials from the temperature increase from transient measurements based on an analytical solution using Greens function. The thermal properties for a given temperature increase and experimental setup was found using the Levenberg–Marquardt method. Model and Hammerschmidt (2000) used numerical models to simulate the influence of different boundary conditions when measuring with transient methods. The models showed good agreement with measurements and an open problem was solved using numerical models.
Carbon-filled nylon 6,6 composites were tested with the TPS method and compared to numerical finite-element analysis (Miller et al., 2006 ). The TPS method was evaluated for 5 s with a supplied power of 1 W. The sensor was a 3.5 mm radius Kapton encapsulated nickel sensor clamped between two samples of 63.5 mm diameter composite disks. FEMLAB was used for the numerical evaluation where the heat flux at the interface between the sample and sensor were continuous and all other boundaries were considered adiabatic. Calculations were performed for the first 5 s with 0.025 s resolution. The first time step was subtracted from the following results which made the results agree very well with the numerical calculations.
3. Numerical simulation models
The numerical models of the isotropic case with polystyrene and the case with polystyrene covered by a thin aluminum film are described below. A number of uncertainties concerning the thermal properties and boundary conditions have to be treated in the numerical models.
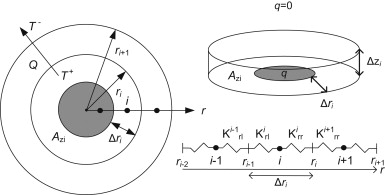
The simulation model is based on a three-dimensional case which was transformed into cylindrical coordinates. The TPS sensor was clamped in the center of two identical material samples. During short calculation periods, when the heat has not reached the boundary of the sample, the setup can be treated as a cylindrical case, see Figure 1 .
|
|
|
Figure 1. Setup of the TPS measurements with the TPS sensor in the center between two samples of the isotropic material. The three-dimensional case was transformed into cylindrical coordinates. |
Table 1 shows the thermal diffusivity, a (m2 /s), and penetration depth, dt (m ), where half the possible temperature change has occurred after 40 s. The thermal properties were based on tabulated data.
| Material | Thermal diffusivity (mm2 /s) | Penetration depth (mm) |
|---|---|---|
| Polystyrene | 0.627 | 5 |
| Aluminum | 91.1 | 60 |
| Fumed silica | 0.027 | 1 |
| VIP film | 0.231 | 3 |
The geometry of the numerical model has to be larger than the penetration depth after 40 s to ensure the heat has not reached the boundaries of the samples.
3.1. Numerical simulation of isotropic material
One of the uncertain parameters in the calculations was the thermal properties of the materials. Polystyrene with a thermal conductivity of 0.032 W/(m K) and a volumetric heat capacity of 0.051 MJ/(m3 K) were used in the simulations. The starting temperature was 0 °C, the time step 10−3 s and the calculation domain 0.02×0.02 m2 . The cells were 0.1 mm in both the radial and vertical direction which created a grid of 200×200 cells. The simulations were performed for the first 40 s with a constant power supply of 0.02 W supplied in a TPS sensor of 6.4 mm radius.
The numerical simulations were performed in Matlab (MathWorks, 2009 ) using a numerical finite difference calculation procedure with circular coordinates where the center of each computational cell is connected with a thermal conductance (Hagentoft, 2001 ). The principle calculation procedure is presented in Figure 2 .
|
|
|
Figure 2. Principle calculation procedure where nodes in the center of each computational cell are connected with a thermal conductance. |
The heat is supplied in the TPS sensor located in the center of the setup and all other boundaries are adiabatic, i.e., no heat flow through the boundary. The heat capacity and thickness of the sensor are disregarded in the model.
3.2. Numerical simulation of isotropic material covered by a high-conductive film
The numerical model needed some modification to be applicable on the case with the isotropic material covered by the high-conductive film. The required size of the computational cells decreased with the thin film which leads to a longer computational time. In this model, the cell size was increasing with the distance from the thin film with a 2.3% increase for each cell, starting with 5 μm which was half the film thickness. The first two cells were located in the film and the first cell in the polystyrene had the same thickness. The numerical model was based on the model for the isotropic material with an added high-conductive film closest to the sensor as shown in Figure 3 .
|
|
|
Figure 3. Setup of the TPS measurements with the TPS sensor in the center between two samples of the isotropic material covered by a high-conductive film. The three-dimensional case was transformed into cylindrical coordinates. |
The high-conductive film was a pure aluminum film, 10 μm thick, with a thermal conductivity of 226 W/(m K) and a volumetric heat capacity of 2.5 MJ/(m3 K). The number of computational cells was 200×600 with an increasing size in the vertical direction and constantly 0.1 mm in the radial direction. The time step was 5×10⁻⁵ s and the calculations were performed for the first 40 s with a constant power supply of 0.02 W supplied in a TPS sensor of 6.4 mm radius.
4. Analytical solutions
The analytical solutions for the heat supply over a part of a circular surface have been developed previously (Carslaw and Jaeger, 1959 ). To validate the results of the numerical model in Section 3.1 the results were compared to the analytical solutions for the steady-state and transient temperature for the same setup.
4.1. Steady-state temperature caused by the heat supply over part of a circular surface
Consider the steady-state temperature in an infinite or semi-infinite medium caused by a constant heat supply in a circular area of the material boundary. The analytical solution for this problem was derived from (Carslaw and Jaeger, 1959 ):
|
|
( 1) |
where T (°C) is the temperature increase due to a heat supply over a circular area A (m2 ) in the region z >0 with constant heat flux q (W/m2 ) over the circular area with radius r <R (m) and zero flux over r >R in a material with thermal conductivity λ (W/(m K)). J1 and J0 are the Bessel functions of the zeroth and first order of the first kind.
The simplified solution for the average temperature over a circular surface at z =0 was also derived from ( Carslaw and Jaeger, 1959 ):
|
|
( 2) |
where Tav (°C) is the average temperature over the circle with radius 0<r <R with the supplied heat flux q over the radius R in a material with thermal conductivity λ .
4.2. Transient temperature increase caused by the heat supply over part of a circular surface
When considering the transient temperature increase in an isotropic material due to a constant heat supply, the solution gets more complicated. Carslaw and Jaeger (1959) derived the solution for the point (r , z ) at time t (s ):
|
|
( 3) |
|
|
( 4) |
|
|
( 5) |
where q is the supplied heat over the circular area with radius R and z =0 in the material with thermal conductivity λ .
A generalized equation for the temperature at point (0 , 0 , z ) is ( Carslaw and Jaeger, 1959 ):
|
|
( 6) |
|
|
( 7) |
where q , R and λ are defined as above and a is the thermal diffusivity of the material.
5. Results
The numerical model was validated by comparing the simulation results with the results of the analytical solutions. The simulated temperature increases in the center of the sensor and in the average of the sensor area were compared with the temperature increases calculated with the analytical solutions. The simulated temperature increases were then compared to the TPS measurements.
The spread of the eight consecutive TPS measurements can be expressed as the coefficient of variation, i.e. the standard deviation divided with the mean value of each measurement. The case with polystyrene had a coefficient of variation of 0.14% after 40 s while the polystyrene covered by aluminum had a coefficient of variation of 1.34% after 40 s. Thus repetitive measurements with the TPS sensor give results with small variations.
5.1. Validation of the numerical model using the analytical solutions for the polystyrene setup
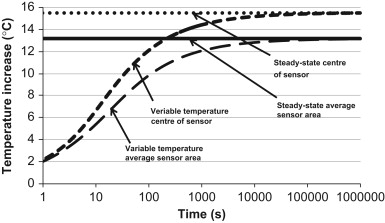
Four analytical solutions were used, two steady-state and two with transient conditions. Figure 4 shows how the transient solutions approach the steady-state solutions after some time, i.e., some hours.
|
|
|
Figure 4. Comparison of the analytical solutions for steady-state and transient conditions in the center of the sensor and in the average of the sensor area. |
The two transient analytical solutions reach the temperature of the steady-state solutions after some time. The transient analytical solutions can therefore be used to validate the numerical model until it reaches steady-state .
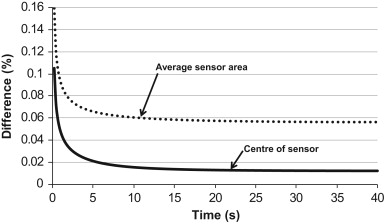
There was a small deviation between the analytical and numerical simulations for the polystyrene setup which is presented in Figure 5 .
|
|
|
Figure 5. Difference between the analytical solutions and numerical model for the polystyrene setup. The differences have been divided by the temperature increase in the numerical simulation after 40 s. |
The deviation was larger for the average temperature in the sensor area than in the point located in the center of the sensor. This could partly be explained by the fineness of the distribution in the computational grid and the boundary conditions in the numerical model.
5.2. Comparison between numerical model and TPS measurements of polystyrene
The measured temperature increase in the TPS sensor was compared with the simulated temperature increase in the polystyrene setup. In Table 2 the temperature increase after 40 s from the analytical solution, numerical simulations and measurements presented.
| Model | Center of sensor (°C) | Average in sensor area (°C) |
|---|---|---|
| Analytical | 10.29 | 8.22 |
| Numerical | 10.29 | 8.23 |
| Measurement | – | 7.59 |
The results were very well corresponding for the analytical and numerical solutions. Compared to the measurements the numerically simulated temperature increase was around 7.8% to high after 40 s.
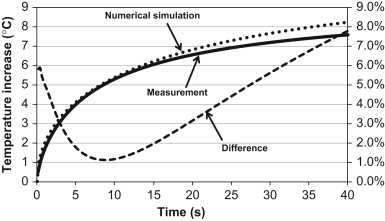
The first 40 s of measured and numerically simulated temperature increase of the polystyrene setup are shown in Figure 6 .
|
|
|
Figure 6. Numerically simulated temperature increase compared to the measured temperature increase with the TPS sensor in the polystyrene setup. The difference is expressed as the difference divided with the temperature increase in the numerical simulation after 40 s. |
There was a deviation between the simulated and measured temperature increase which decreased from 5.9% at the start of the measurements to around 1.1% after 8–9 s. The difference increased again and reached a maximum of 7.8% after 40 s. One cause of the deviation in the beginning of the measurement could be the heat capacity of the sensor which delays the measured temperature increase. In the rest of the measurement period the deviation could be caused by the losses in the wire between the TPS sensor and TPS unit which could influence the resistance of the wire and thus the temperature increase.
5.3. Comparison between numerical model and TPS measurements of polystyrene with aluminum film
The results for the setup with the polystyrene covered by aluminum film are presented in Table 3 .
| Model | Center of sensor (°C) | Average in sensor area (°C) |
|---|---|---|
| Numerical | 1.26 | 1.10 |
| Measurement | – | 1.04 |
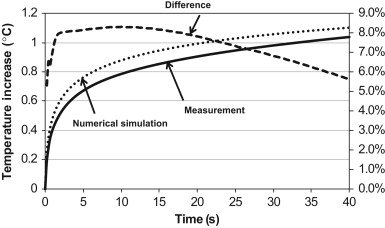
The simulated temperature increase after 40 s was 5.7% higher than the measured temperature increase. One possible cause for this, except for the losses in the wire, could be that the properties of the film deviate from the tabulated properties found in the literature.
Figure 7 shows the temperature increase during the first 40 s of numerical simulation and measurement on the polystyrene covered by aluminum film.
|
|
|
Figure 7. Numerically simulated temperature increase compared to the measured temperature increase with the TPS sensor for the polystyrene sample covered by aluminum. The difference is expressed as the difference divided with the temperature increase in the numerical simulation after 40 s. |
The difference between the simulated and measured temperature increase peaked at around 8.3% after 2 s. Then the difference was approximately constant until around 18 s had passed and the difference decreased to a minimum of 5.7% after 40 s.
The measured temperature increase in the sensor clamped between polystyrene covered by aluminum was 1.04 °C after 40 s. This could be compared to the setup with only polystyrene where the temperature increased by 7.59 °C after 40 s. This was 7.3 times higher temperature increase than for the case with the polystyrene covered by aluminum film which shows the importance of the heat transfer through the 10 μm thick aluminum film.
6. Conclusions
The aim of this study was to investigate the applicability of using a TPS sensor for determination of the thermal properties of layered materials with a low conductive core covered by a high-conductive thin film. Numerical simulations and analytical solutions were used to model the temperature increase in the TPS sensor on pure polystyrene samples.
The temperature increase in the analytical solutions and numerical model for the isotropic polystyrene setup were in very good agreement with only a small deviation.
When comparing the temperature increase in the numerical simulation of the setup with polystyrene with the TPS measurements the difference after 40 s was quite large.
For the case with polystyrene covered by aluminum the deviation of the temperature increases was smaller after 40 s compared to the setup with polystyrene.
The temperature increased much more in the setup with polystyrene than in the polystyrene covered by aluminum. This shows the importance of the heat transfer through the film.
The thermal properties and other uncertainties such as surface contact heat resistances and the losses in the wire between the TPS sensor and TPS unit, may have contributed to the differences between simulated and measured temperature increases.
An analytical solution will be developed within this project which will make it possible to derive the thermal properties from the measured temperature increase in the TPS sensor. The aim is to be able to measure the thermal properties of layered materials with very large anisotropy. The measurement method could in the future be modified for in situ measurements of VIP.
Acknowledgements
This paper was presented at the 5th International Building Physics Conference in Kyoto, Japan, 28–31 May, 2012.
References
- Almanza et al., 2004 O. Almanza, M.A. Rodríguez-Pérez, J.A. De Saja; Applicability of the transient plane source method to measure the thermal conductivity of low-density polyethylene foams; Journal of Polymer Science Part B: Polymer Physics, 42 (7) (2004), pp. 1226–1234
- Caps, 2004 Caps, R., 2004. Determination of the gas pressure in an evacuated thermal insulating board (vacuum panel) by using a heat sink and test layer that are integrated therin. International Patent 03085369.
- Carslaw and Jaeger, 1959 H.S. Carslaw, J.C. Jaeger; Conduction of Heat in Solids; (second ed.)Oxford/Clarendon Press, New York (1959)
- Gustafsson, 1991 S.E. Gustafsson; Transient plane source techniques for thermal conductivity and thermal diffusivity measurements of solid materials; The Review of Scientific Instruments, 62 (3) (1991), pp. 797–804
- Hagentoft, 2001 C.-E. Hagentoft; Introduction to Building Physics; Studentlitteratur, Lund, Sweden (2001)
- Johansson et al., 2011 Johansson, P., Adl-Zarrabi, B., Hagentoft, C.-E., 2011. Measurements of thermal properties of vacuum insulation panels by using transient plane source sensor. In: Proceedings of the 10th International Vacuum Insulation Symposium, September 15–16 , 2011, Ottawa, Canada, pp. 18–21 .
- MathWorks, 2009 MathWorks, 2009. MATLAB (Version 7.9.0, R2009b). The MathWorks, Inc, Natick, MA, USA.
- Miller et al., 2006 M.G. Miller, J.M. Keith, J.A. King, R.A. Hauser, A.M. Moran; Comparison of the guarded-heat-flow and transient-plane-source methods for carbon-filled nylon 6,6 composites: experiments and modeling; Journal of Applied Polymer Science, 99 (5) (2006), pp. 2144–2151
- Model, 2005 R. Model; Thermal transport properties of layered materials: identification by a new numerical algorithm for transient measurements; International Journal of Thermophysics, 26 (1) (2005), pp. 165–178
- Model and Hammerschmidt, 2000 R. Model, U. Hammerschmidt; Numerical methods for the determination of thermal properties by means of transient measurements; B. Suden, C.A. Brebbia (Eds.), Advanced Computational Methods in Heat Transfer VI, WIT Press, Southampton, Boston (2000) pp. 407–416
- Simmler et al., 2005 Simmler, H., Brunner, S., Heinemann, U., Schwab, H., Kumaran, K., Mukhopadhyaya, P., Quénard, D., Sallée, H., Noller, K., Kücükpinar-Niarchos, E., Stramm, C., Tenpierik, M.J., Cauberg, J.J.M., Erb, M., 2005. Vacuum insulation panels. Study on VIP-components and panels for service life prediction of VIP in building applications (Subtask A): IEA/ECBCS Annex 39 High Performance Thermal Insulation (HiPTI).
Document information
Published on 12/05/17
Submitted on 12/05/17
Licence: Other
Share this document
Keywords
claim authorship
Are you one of the authors of this document?
