1 Introduction
Sustainable development is the ability to meet our needs without compromising the ability of future generations to meet their own needs. Meaning that the rate of use of non-renewable resources must not be greater than the rate at which renewable resources can be substituted from them [1]. The demand for polymeric foams by rapidly growing industries (e.g. aerospace, car, wind-energy and marine industries) raises a concern about environmental sustainability.
Vegetable materials such as cork due to their fast regrow are potential sustainable substitutes of polymeric foams in specific applications.
Cork is the bark of the oak, a popular tree in Mediterranean countries such as Portugal, Spain, Italy, and France. This is a cellular material with polygonal structure (heptagonal, hexagonal, pentagonal) made from thin walls analogous to the honeycomb with lateral cell walls running parallel to the radial direction of the tree. Cork is transversally isotropic therefore; its mechanical properties perpendicular to the radial direction (axial and tangential) are analogous [2]. In the axial and tangential direction, cork has a cellular structure similar than a brick wall. Cork cells are closed and hollow containing air inside.
It is harvest from the tree every 9-12 years and boiled in order to reduce the corrugation of the walls and to open its cells, increasing its volume and making it smoother. After dried cork is punched in order to produce stoppers for wine bottles. Agglomerated cork is produced from the remaining cork material used in the production of wine bottle stoppers and other applications. This material is triturated and mixed with polymeric binders (polyurethane) and cured under heat and pressure in a mould.
Among the properties of agglomerated cork are hyper-elasticity, low permeability, low thermal conductivity, chemical stability, good energy absorption, and vibration damping properties. [2 3]. Previous research [4, 5] show that agglomerated cork maintain its energy absorption capabilities after multiple impacts giving this material advantage over synthetic foams.
The compressive behaviour of cellular materials is characterized by three regions in the stress-strain curve:
1. Elastic region: At low relative density, open-cell foams have a linear elastic region governed by cell wall bending. For closed-cell foams, the cell edges both bend and stretch/contract due to the presence of face membranes that also stretch increasing the axial stiffness.
2. Plateau region: The plateau region is governed by the collapse of the cells caused by elastic buckling (elastomeric materials) or by the formation of plastic hinges (plastic materials) where the strain is no longer recoverable. In compression, the stress-strain curve shows a collapse stress (plateau) with almost constant stress in the case of open-cell foams. For closed-cell foams, there is a progressive increment in the stiffness produced by the compression of the gas inside the cells and the stretching of the face membranes
3. Densification region: The densification region is characterized by a rapid increment of stress. In this region, the opposite collapsed cells touch each other and further stress compresses the solid.
The dependency of cellular materials with strain rate is variable among materials. For example, in semi-rigid foams, both the stiffness and strength increase with the strain rate whilst for rigid foams increments in the strain-rate does not affect their stiffness but slightly increases their strength [6]. This variability is explained since at ambient temperature some cellular materials show a viscoelastic behaviour that increases their dependency on strain rate. On the other hand, the plastic collapse strength is proportional to the yield strength of the solid of which is made. As a result, increasing strain rate causes a higher yield strength.
In addition, at very high strain rates inertial effects create a dynamic crushing effect that increases the compression strength even further. The physical mechanisms are summarized below:
1. Localization: Cells are more tightly compressed along a thin layer adjacent to the loading face creating a change in the cell shape leading to local strain rates that are much larger than the apparent strain rate.
2. Micro-inertia: Micro inertia suppresses the cell-wall buckling increasing the crushing stress.
3. Densification: When cells come into contact in the localization region, they cause a shock that rises the stress.
Strain rate dependency is also caused by the fluid contained inside closed cell foams. The deformation of a closed cell changes the pressure of the contained fluid affecting the modulus and the collapse strength of the material. This effect is particularly important in elastomeric foams.
The compression of agglomerated cork of different densities has been previously studied by [7, 8, 9,10] at quasi-static and dynamic regime using Split Hopkinson Pressure Bar (SHPB) at strain rates in the range of 90 to 600 s-1. However, there is still a lack of available data for dynamic compression at lower strain rates.
The aim of this work is to address the quasi-static and dynamic compression testing of two types of agglomerated cork of different densities, using a servo-hydraulic testing machine and drop weight tower giving special emphasis to strain rates below 90 s-1.
2 Experimental set-up
Compression testing is carried out over two different types of agglomerated cork NL-10 (ρ=170 Kg/m3) and NL-20 (ρ=215 Kg/m3) manufactured by the company Amarim Cork Composites under the commercial name of CORKCORE.
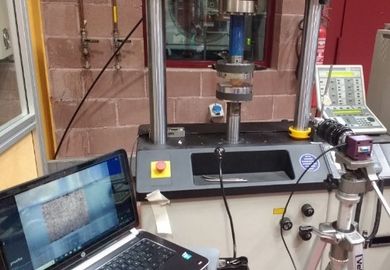
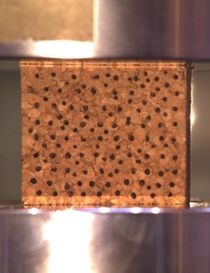
Quasi-static testing is carried out to evaluate the behaviour of NL-10 and NL-20 agglomerated cork. Test specimens of 40x40x35mm are tested at deformation velocities from 1mm/min to 5mm/min (strain rate: 4.76x10⁻⁴ to 2.38x10⁻³) using an INSTRON 8516 universal testing machine with a load cell of 5KN. A digital camera is used to record the testing at 10fps. Each test specimens is marked with black dots in order to provide suitable tracking points for DIC (Digital Image Correlation) recognition algorithms. The experimental setup can be seen in Figure 1.
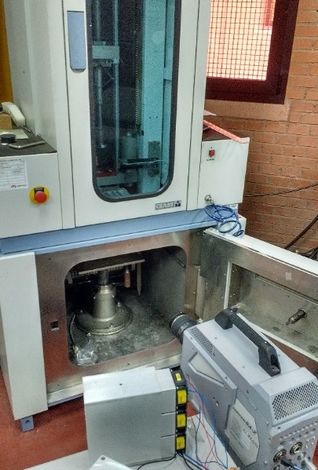
Low-velocity impact testing is carried out to evaluate the behaviour of NL-10 and NL-20 agglomerated cork under dynamic compression. Test specimens of 40x40x35 mm are tested at impact energies ranging from 10 J to 89 J using a Ceast-Fractovis 6785 drop-weight testing machine. Impact velocitiy range from 2 m/s to 4.3 m/s reaching strain rates up to 122 s-1.
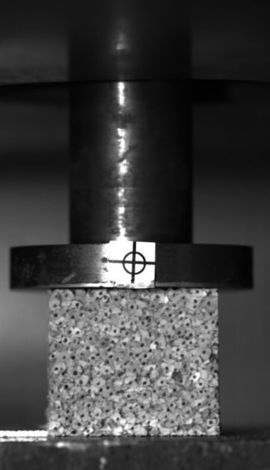
A PHOTRON FASTCAM SA-Z high-speed camera is used to record the testing at 2000 fps. Test specimens are marked with black dots in order to provide suitable tracking points for DIC recognition algorithms. The experimental setup can be seen in Figure 2
The impact force is measured through an instrumented impactor recording data with a sample time of 9 μs. The real impact velocity is measured using two laser position detectors located before the impact takes place. A build-in data acquisition system estimates the acceleration, velocity and position applying numerical integration. In addition, the velocities before and after the impact are also measured using automated image tracking in order to verify the sensor measurements and to estimate the remaining kinetic energy after impact.
2D DIC correlation is used to measure strains during the testing. This method provides accurate identification of changes among the video frames taken in the test. These changes are correlated at the pixel level in order to identify the corresponding strain. The correlated solutions Vic2D software is used under the following parameters: sub-set size=33, step-size=4 pixels, filter size=15.
3 Results
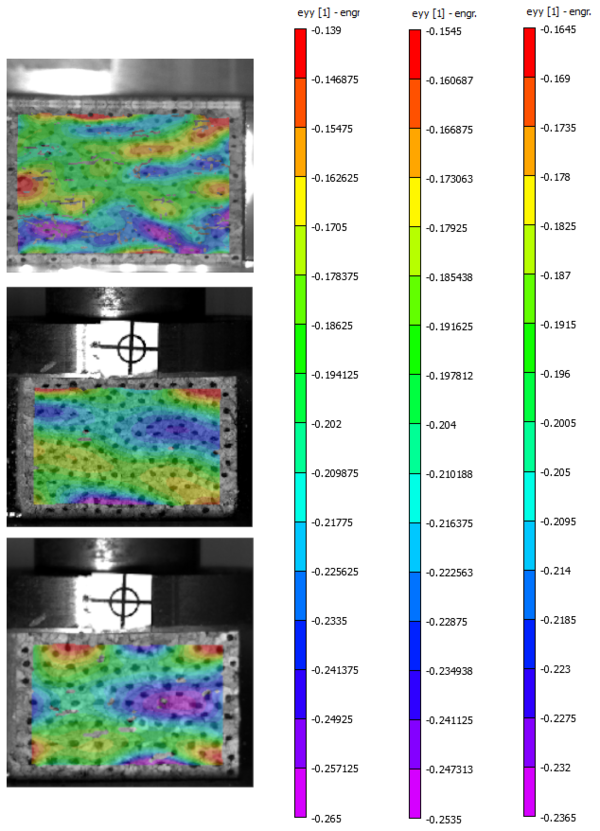
Figure 3 shows the variation in the local strain at different points in specimens of NL-20 for quasi-static compression and for dynamic compression at 40J, and 70J. It can be noticed that there is a considerable variability in the local strain at different points in the specimen what clearly shows the anisotropy of agglomerated cork at small scale. This anisotropy is caused by the random allocation of cork granulates, the orthotropic behaviour of the pure cork and the influence of void and regions with higher amount of binder.
The local strain along the test specimens for 7 different mean strains is depicted in Figure 4. It is clear that the variability in the local strain is proportional to the applied mean strain.
From Figure 5 it can be noticed that both materials show the characteristic stress-strain curve of cellular material with closed cells. There is a considerable difference in the plateau region for the quasi-static and dynamic compression. For example, at 30% strain, the plateau stress for NL-10 is 0.625 MPa for the quasi-static case and 1.096 MPa for dynamic compression. Similar relations are found in the NL-20 where the plateau stresses are 0.897 MPa and 1.499 MPa for quasi-static and dynamic compression respectively. From the same figure, it is also clear that the stiffness of the NL-20 is higher than NL-10 in both quasi-static and dynamic compression due to the associated difference in density of both materials.
Figure 6 shows the maximum contact force at different impact energies for both agglomerated corks. This figure shows that there is not any significant variation in the maximum contact force for both materials in the studied impact energy range.
The strain energy is determined through the numerical integration of the Force vs Displacement curve obtained by the data acquisition system. Due to the possible numerical errors associated with numerical integration an alternative method was used to validate the obtained data. The energy absorbed is also calculated using the final kinetic energy of the impactor measured with the image tracking and applying the principle of conservation of energy. Details of the energy dissipated are shown in Figure 8. It is found that the ratio of the dissipated energy to impact energy increases at higher values of impact energies. This phenomenon can be explained due to the further cell collapse taking place at higher deformations. Additionally, it can be concluded that the numerical integration and DIC method present similar results and are suitable methods for estimating the kinetic energy after impact.
4 Conclusions
The two analyzed agglomerated corks show the stress-strain curve characteristic of cellular materials with closed cells. The stiffness of the NL-20 is higher than NL-10 for both quasi-static and dynamic compression. However, there is a small variation on the peak force during low-velocity impact.
Dynamic compression tests show that both agglomerated corks can dissipate from 80% to 99% of the initial impact energy. Although there is certain variability about experiments, NL-10 has slightly superior energy dissipation capabilities than NL-20 due to a higher deformation. DIC analysis shows that agglomerated cork is highly anisotropic at small scale level.
Acknowledgements
This work has been done thanks to funding from the Ministry of Economy and Finance of Spain within the framework of the project DPI2017-86324-R.
References
[1] M. F. Ashby, “Materials and the enviroment,” Mater. Environ., pp. i–iii, 2012.
[2] M. Da Silva, M. Oleskovicz, and D. V. Coury, “Cork: properties, capabilities and applications,” Int. Mater. Rev., vol. 50, no. 6, pp. 345–358, 2005.
[3] J. M. Silva, P. V Gamboa, C. Nunes, L. Paulo, and N. Franco, “Cork: Is It a Good Material for Aerospace Structures?”
[4] F. A. O. Fernandes, R. T. Jardin, A. B. Pereira, and R. J. Alves De Sousa, “Comparing the mechanical performance of synthetic and natural cellular materials,” Mater. Des., vol. 82, pp. 335–341, 2015.
[5] S. Sanchez-Saez, E. Barbero, S. K. Garcia-Castillo, I. Ivañez, and J. Cirne, “Experimental response of agglomerated cork under multi-impact loads,” Mater. Lett., vol. 160, pp. 327–330, 2015.
[6] L. J. Gibson and M. F. Ashby, Cellular solids, 2nd ed. Cambridge University press, 1997.
[7] C. P. Gameiro, “Numerical and experimental study of the dynamic behaviour of cork,” Des. use Light Weight Mater., pp. 65–84, 2005.
[8] F. A. O. Fernandes, R. J. S. Pascoal, and R. J. Alves De Sousa, “Modelling impact response of agglomerated cork,” 2014.
[9] F. Sarasini et al., “Static and dynamic characterization of agglomerated cork and related sandwich structures,” Compos. Struct., vol. 212, pp. 439–451, Mar. 2019.
[10] M. Sasso, E. Mancini, G. Chiappini, F. Sarasini, and J. Tirillò, “Application of DIC to Static and Dynamic Testing of Agglomerated Cork Material,” Exp. Mech., vol. 58, no. 7, pp. 1017–1033, 2018.
Document information
Published on 09/05/22
Accepted on 09/05/22
Submitted on 09/05/22
Volume 03 - Comunicaciones Matcomp17 (2019), Issue Núm. 4 - País invitado: Colombia. Materiales Multifuncionales. Reciclaje y Sostenibilidad, 2022
DOI: 10.23967/r.matcomp.2022.05.017
Licence: Other
Share this document
Keywords
claim authorship
Are you one of the authors of this document?
