Abstract: In order to study the characteristics of spatial variability of soil infiltration in the aeolian sandy land improvement and utilization area, this paper conducted a study on the six different land use types in the aeolian sandy land in northwest Liaoning by means of average and random distribution. With bare land as the control group, the physical parameters of the soil in the test area were analyzed and processed through traditional statistical analysis and geostatistical analysis, and the spatial distribution of various physical parameters was studied using ordinary Kriging interpolation. The results show that the bulk density of different land use types in the aeolian sandy land improvement and utilization area in northwestern Liaoning has been reduced, and the total porosity, capillary porosity, water content and the ratio of clay particles have increased to varying degrees. Soil infiltration has a negative correlation with moisture content and clay particles, and a positive correlation with the ratio of total porosity. In addition, among all types of improved utilization, other forest land has the largest infiltration and the research land has the smallest one.
Keywords: Aeolian sandy land; land use type; Kriging interpolation; infiltration; spatial variability
1. Introduction
Soil infiltration is directly related to processes such as surface runoff and soil erosion, and plays an important part in the eco-hydrological process. Soils are characterized by a high degree of spatial variability because of the combined effects of physical, chemical, and biological processes that operate with different intensities and at different scales [1]. Variation of textural parameters in soils is an important issue that must be characterized because it is an important way to understand and quantify soil structure, dynamics and physical processes [2, 3]. Soil physical and hydraulic properties can change drastically over space [4] and time [5], and the relationship between them is of great importance. The hydraulic characterization of soil has been the focus of intensive research for many decades [6]. S. R. Vieira et al [7]studied spatial variability of 1,280 field-measured infiltration rates on Yolo loam using geostatistical concepts, and proposed a suggestion on how to use autocorrelograms in sampling schemes. Sharma ML et al [8] carried out twenty-six infiltration tests on a 9.6-ha watershed, and they demonstrated that the variability of infiltration in the watershed could be expressed in terms of the parameters S and A. Merz Bruno et al [9] investigated the effects of spatial variability of the initial soil moisture and soil hydraulic properties on the runoff, and they found that organization in spatial patterns of soil moisture and soil properties may have a dominant influence on the catchment runoff. Sisson et al [10] used three ringsizes along five parallel transects to measure steady-state infiltration rates in a field plot, and they found that infiltration rates are lognormally distributed for all ringsizes and autocorrelated for the 5-cm ringsize. In addition, they determined the autocorrelation functions and computed the power spectrums. Peck AJ et al [11] simulated the spatial variation of soil water characteristics in an area from average properties and the assumption of scale heterogeneity, and they found the spatial variability of soil water conditions had only a small effect on evapotranspiration in the test area. Zhao Ying et al [12] studied the effects of the grazing intensity on soil physical and mechanical properties and their interactions in a Leymus chinensis steppe of the Xilin River Basin, Inner Mongolia, China. The study showed that soil compaction induced by sheep trampling, especially in the heavily grazed site, inclined to a homogenous spatial distribution of soil properties, which will possibly enhance soil vulnerability to water and nutrient loss, and consequently reduce the plant available water and thus grassland productivity. Woods et al [13] studied the spatial variability of soil hydrophobicity after wildfires in Montana and Colorado, and they found that both the burned and unburned 225 m2 plots contained 10–23 hydrophobic soil patches in which hydrophobicity was strongest at the surface and declined rapidly with depth. Herbst [14] simulated the temporal and spatial variability of soil moisture in the micro-scale Berrensiefen catchment with SWMS_3D and a loosely coupled model for the atmospheric boundary conditions. Monte Carlo simulation was used to study the effects of random distribution of soil properties on distribution of ponding time, composite areal rate, and bias due to variability in space [15]. Awal [16] quantified the spatial variability of some selected soil physical properties using classical and geostatistical methods, and they found that the spatial distribution of the soil properties based on kriging shows a high level of variability even though the sampled field is relatively small. Fractal features of particle size distribution of soil samples and were studied and the spatial variability of fractal and soil textural parameters was characterized. And it was found that the fractal parameters had powerful spatial structure and could better describe the spatial variability of soil texture [17]. The relationships between soil physical and hydraulic properties and wheat yield at the field scale were investigated and the BEST-procedure for the spatialization of soil hydraulic properties was tested [18]. A method is presented for characterizing the spatial variability of water infiltration and soil hydraulic properties at the transect and field scales. The spatial variability of water infiltration and hydraulic parameters as well as its characteristic scale were determined [19]. Liu Zhipeng et al [20] concluded that the soil organic matter and bulk density are more important in the smaller-scale farmland, while the soil water content and water temperature are more important in the larger woodland and shrubland.
Although a large number of researchers have done a lot of research on the spatial variability of infiltration in different regions, different terrains, and different soil types, there are relatively few studies on soil infiltration in the improved use of sandy land. This paper takes the experimental base of the Research Institute of Sandy Land Utilization and Improvement in Liaoning Province as the research object, and studies the spatial variability of soil infiltration of sand land from different land use types. This study has certain guiding significance for the improvement of soil infiltration in sandy land.
2 Overview of study area
The study area is located in the Zhanggutai Test Station of the Institute of Aeolian Land Improvement and Utilization of Liaoning Province, Zhanggutai Town, Zhangwu County, Fuxin City, Liaoning Province. The average altitude is 345 m, the annual average temperature is 6.82 ℃, the lowest temperature is -33.4 ℃, and the highest temperature is 43.2 ℃. The average air humidity is 60.4%, the average annual precipitation is about 450 mm, the average annual evaporation is 1590 mm, the average annual wind speed is 3.33 m/s, the average number of days with wind speed greater than 3 m/s is 160 d, and 10 m/s is 10 d. The frost-free period is 145-150 days, which is a typical sandy and semi-arid area in the north. The soil is aeolian sandy soil, and the vegetation is dominated by sand plants with strong drought resistance.
This study is based on a comprehensive investigation of the topography, vegetation coverage, and distribution of vegetation types at Zhanggutai Experimental Station of the Liaoning Institute of Sand Land Management and Utilization, combined with the existing land use types and crop planting distribution in the study area. Six land types including scientific research land, other grassland, other forest land, arbor forest land, orchard, and irrigated land were set research objects in accordance with the criteria of "Classification of Land Use Status" (GBT21010-2017), and added a control group.
3 Research methods
3.1 Sampling point layout
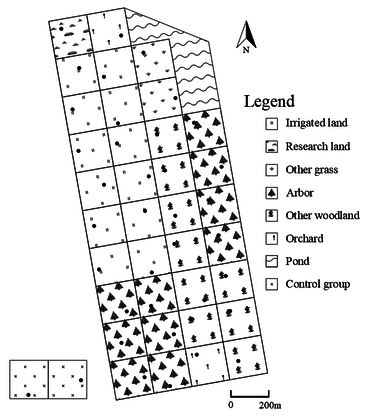
Based on the land use types and crop planting divisions of the experimental area, points were selected from the sample plots according to the principle of uniform distribution and random placement. The grid spacing is about 200 m, and a total of 36 sampling points are arranged. Among them, there are 12 irrigated lands, 10 arbor forest lands, 9 other forest lands, 2 other grasslands, 2 orchards, and 1 scientific research land. The specific layout is shown in Figure 1. Take the soil surface layer of 0-20 cm for measurement. Choose 3 points around each sampling point were chosen, and the average of the 3 points was taken as the final data for that point. And two bare plots near the test area were selected as the control group.
3.2 Soil infiltration test
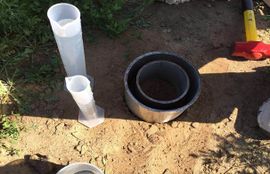
The determination method of soil infiltration test adopts double-ring knife water infiltration method. Drive a double ring knife with an inner ring of 11 cm, an outer ring of 16 cm, and a height of 20 cm into the ground 10 cm vertically, and add water to the inner and outer rings at the same time, and make the height of the water 5cm. After the timer starts, keep adding water to the outer ring to keep the water head constant. During the infiltration process, the infiltration water volume is recorded in a time-sharing and segmented manner. Based on the general situation of the soil infiltration test, observations were made every 1 minute within 10 minutes of infiltration, every 2 minutes of 10-30 minutes, and every 10 minutes of 30-60 minutes. Under normal circumstances, soil infiltration has basically reached a stable state after 60 minutes. The field test is shown in Figure 2.
3.3 Soil physical properties test
The methods for measuring soil physical properties are as follows:
Soil bulk density and porosity, soil field water content, capillary water holding capacity and saturated water content were all measured by ring knife method; soil natural moisture content was measured by drying method; soil mechanical composition was measured by LA-300 laser particle size analyzer.
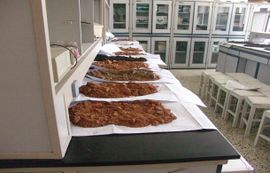
The test site and instruments are shown in Figures 3-5.
|
Figure 2. Field double ring infiltration Figure 3. Soil sample pretreatment
|
Figure 4. Soil sample drying Figure 5. LA-300 laser particle size analyzer
4 Results and analysis
4.1 Traditional statistical analysis of soil physical properties
The traditional statistical analysis of soil bulk density, porosity, moisture content and mechanical composition of the sampling points is shown in Table 1.
It can be seen from Table 1 that all physical parameters in the selected sampling points of the experiment are normally distributed. The standard deviation is 0.10-5.39, where the value of bulk density is the smallest and the value of sand is the largest. The coefficient of variation is 0.07-0.69, and the coefficient of variation of bulk density, total porosity and sand is less than 10%, which is weak variability; capillary porosity, non-capillary porosity, moisture content, silt and clay are moderately variable, and the variation coefficient of clay is the largest. The skewness of bulk density and sand is negative, and the skewness of other parameters is positive. The kurtosis of sand and silt is positive, and the kurtosis of other parameters is negative. Soil bulk density is the degree to which the soil is arranged tightly per unit volume, which can reflect the size of soil firmness and porosity, and has a greater impact on soil permeability, infiltration performance, water holding capacity, solute migration characteristics and soil erosion resistance. The soil bulk density in the study area is between 1.25-1.66 g/cm3, and the overall difference is not obvious. The coefficient of variation of soil bulk density is 0.07, which is a weak variation with a normal distribution and small dispersion. The soil moisture content is between 2.26%-11.14%, with an average value of 6.08%, and a variation coefficient of 0.36, showing a moderate variation and an approximate normal distribution. The mechanical composition of the soil is generally determined by the ratio of its sand (0.02-2 mm), silt (0.002-0.02 mm) and clay (<0.002 mm). The clay content is between 0.25%-3.48%, the silt content is between 0.22%-16.54%, and the sand content is between 76.03%-99.78%. The variation coefficient of sand, silt and clay are 0.06, 0.63, and 0.69 respectively, corresponding to weak or medium variability. Soil porosity consists of non-capillary porosity and capillary porosity. The non-capillary porosity reflects the water infiltration of the soil, and the capillary porosity reflects the water retention capacity of the soil. The total porosity is between 39.51%-52.63%, the average value is 45.11%, and the variation coefficient of the total porosity is 0.07, which is a weak variation with a normal distribution
| Item | Bulk density
(g·cm-3) |
Total porosity
(%) |
Capillary porosity
(%) |
Non-capillary porosity
(%) |
Moisture content
(%) |
Sand content
(%) |
Silt content
(%) |
Clay content
(%) |
| Average value | 1.48 | 45.11 | 34.82 | 10.30 | 6.08 | 92.05 | 6.52 | 1.4 |
| Median | 1.49 | 44.89 | 34.19 | 9.50 | 5.96 | 93.52 | 5.48 | 1.11 |
| Maximum | 1.65 | 52.63 | 44.42 | 18.45 | 11.14 | 99.78 | 16.54 | 3.48 |
| Minimum | 1.25 | 39.51 | 29.37 | 2.75 | 2.26 | 76.03 | 0.22 | 0.25 |
| Standard deviation | 0.10 | 3.22 | 3.72 | 4.08 | 2.20 | 5.39 | 4.10 | 0.96 |
| Coefficient of Variation | 0.07 | 0.07 | 0.11 | 0.40 | 0.36 | 0.06 | 0.63 | 0.69 |
| Kurtosis | -0.34 | -0.24 | -0.03 | -0.51 | -0.69 | 0.10 | 0.08 | -0.33 |
| Skewness | -0.52 | 0.47 | 0.72 | 0.37 | 0.24 | -0.13 | 0.85 | 0.93 |
| Distribution type | Normal | Normal | Normal | Normal | Normal | Normal | Normal | Normal |
It can be seen from Table 1 that all physical parameters in the selected sampling points of the experiment are normally distributed. The standard deviation is 0.10-5.39, where the value of bulk density is the smallest and the value of sand is the largest. The coefficient of variation is 0.07-0.69, and the coefficient of variation of bulk density, total porosity and sand is less than 10%, which is weak variability; capillary porosity, non-capillary porosity, moisture content, silt and clay are moderately variable, and the variation coefficient of clay is the largest. The skewness of bulk density and sand is negative, and the skewness of other parameters is positive. The kurtosis of sand and silt is positive, and the kurtosis of other parameters is negative. Soil bulk density is the degree to which the soil is arranged tightly per unit volume, which can reflect the size of soil firmness and porosity, and has a greater impact on soil permeability, infiltration performance, water holding capacity, solute migration characteristics and soil erosion resistance. The soil bulk density in the study area is between 1.25-1.66 g/cm3, and the overall difference is not obvious. The coefficient of variation of soil bulk density is 0.07, which is a weak variation with a normal distribution and small dispersion. The soil moisture content is between 2.26%-11.14%, with an average value of 6.08%, and a variation coefficient of 0.36, showing a moderate variation and an approximate normal distribution. The mechanical composition of the soil is generally determined by the ratio of its sand (0.02-2 mm), silt (0.002-0.02 mm) and clay (<0.002 mm). The clay content is between 0.25%-3.48%, the silt content is between 0.22%-16.54%, and the sand content is between 76.03%-99.78%. The variation coefficient of sand, silt and clay are 0.06, 0.63, and 0.69 respectively, corresponding to weak or medium variability. Soil porosity consists of non-capillary porosity and capillary porosity. The non-capillary porosity reflects the water infiltration of the soil, and the capillary porosity reflects the water retention capacity of the soil. The total porosity is between 39.51%-52.63%, the average value is 45.11%, and the variation coefficient of the total porosity is 0.07, which is a weak variation with a normal distribution.
4.2 Spatial structure and distribution characteristics of soil physical properties
4.2.1 Spatial structure characteristics of soil physical properties
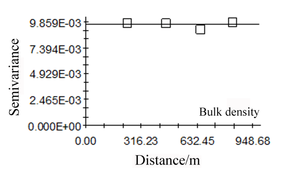
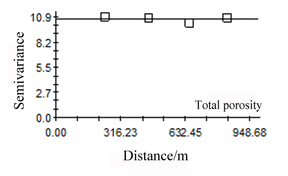
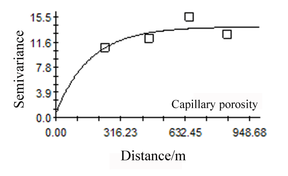
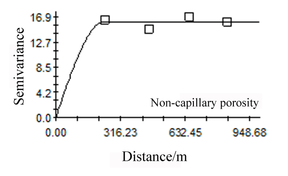
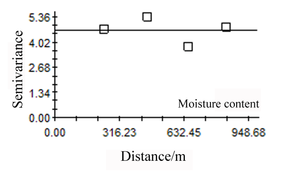
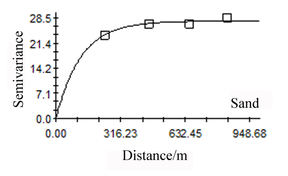
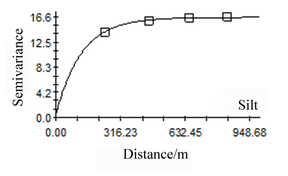
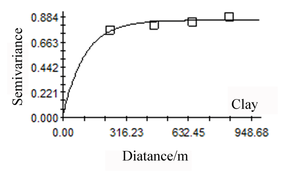
The semivariance function can accurately describe the randomness and structural characteristics of the spatial distribution pattern of various physical parameters in the soil. The corresponding parameters of the semivariance function of various physical properties of the soil in the experimental area are shown in Table 2. The semivariance function figure of each parameter is shown in Figure 6.
| Item | Type | Nugget value
Co |
Partial sill value
C |
Abutment value
Co+C |
Co/(Co+C)
(%) |
Variation
distance (m) |
R2 | RSS |
| Bulk density | Linear | 0.0096 | 0.00 | 0.0096 | 100 | 838.85 | 0.090 | 3.33e-7 |
| Total porosity | Linear | 10.6870 | 0.00 | 10.6876 | 100 | 838.85 | 0.135 | 0.0304 |
| Capillary porosity | Exponential | 0.6900 | 13.32 | 14.0100 | 4.925 | 372.00 | 0.551 | 0.0522 |
| Non-capillary porosity | Exponential | 0.2700 | 15.78 | 16.0500 | 1.682 | 318.00 | 0.180 | 0.0983 |
| Moisture content | Linear | 4.6780 | 0.00 | 4.6780 | 100 | 838.85 | 0.066 | 0.0124 |
| Sand | Exponential | 0.0100 | 27.63 | 27.6400 | 0.036 | 375.00 | 0.878 | 0.0460 |
| Silt | Gaussian | 0.5100 | 16.05 | 16.56 | 3.079 | 327.00 | 0.992 | 0.0347 |
| Clay | Exponential | 0.0270 | 0.83 | 0.855 | 3.158 | 336.00 | 0.784 | 0.0016 |
From Table 2 and Figure 6, it can be seen that the bulk density, total porosity and water content conform to the linear model; the capillary porosity, non-capillary porosity, sand and clay conform to the exponential model; and the silt conforms to the Gaussian model. The range of nugget value is 0.0.96-10.6876, and the range of partial abutment value is 0-27.63. The coefficient of determination of each parameter is 0.09-0.992, and the residual error range is 3.33e-7-0.0983.
Spatial variation is mainly composed of structural variation and random variation. The nugget value reflects the degree of internal randomness of the regionalized variables, and the partial sill value represents the structural variation caused by factors such as climate and terrain. It can be seen from Table 2 that the nugget value of the total porosity is the largest, 10.6876, while the nugget value of the sand grain is the smallest, only 0.0100, but its partial abutment value is the largest.
4.2.2 Spatial distribution characteristics of soil physical parameters
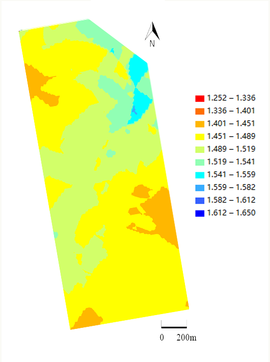
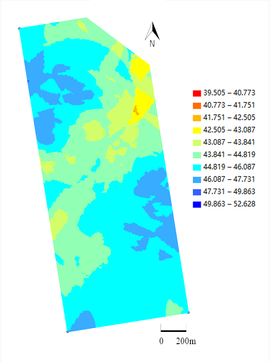
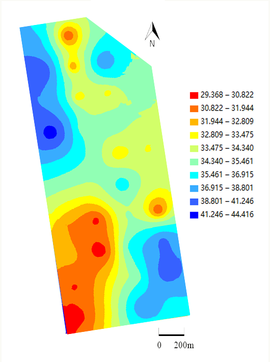
According to the best fitting model of the semivariance function and its corresponding parameters, the Ordinary Kriging interpolation is performed on each parameter to generate the spatial distribution diagram of each physical parameter, as shown in Figures 7-14.
It can be seen from Figure 7 that the spatial distribution of the test area's bulk density has not changed much, only a small increase in the northeast corner, and a small decrease in the west and east. It can be seen from Figure 8 that the total porosity is smaller in the middle of the test area, and larger in the northwest and southeast corners. The spatial distribution of total porosity is similar to bulk density, but the change trend is opposite.
Figure 7. Spatial distribution of bulk density Figure 8. Spatial distribution of total porosity
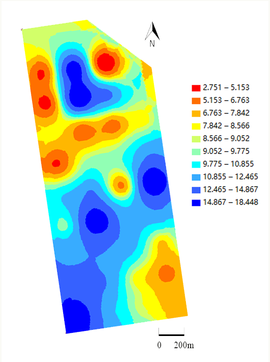
It can be seen from Figures 9-10 that both capillary porosity and non-capillary porosity have the characteristics of zoning, which can be roughly divided into three categories according to their proportions. The capillary porosity is smaller in the southwest corner, and larger in the northwest and southeast corners. The non-capillary porosity ratio is larger in the central part of the test area, and smaller in the northwest and southeast corners. The spatial distribution of capillary porosity and non-capillary porosity presents opposite trends, which is completely consistent with the real situation.
Figure 11. Spatial distribution of water content Figure 12. Spatial distribution of sand
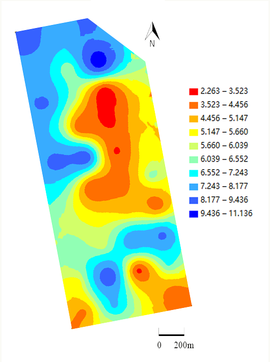
Figure 11 shows the spatial distribution of moisture content. It can be seen from the figure that the water content value is lower in the middle, southwest and southeast corners, but increases in other areas.
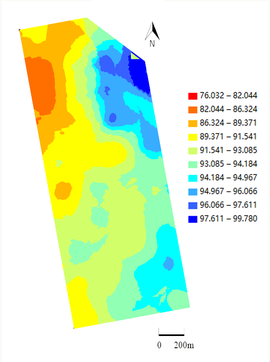
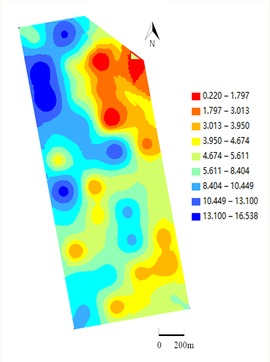
Figures 12-14 show the spatial distribution of soil organic composition. It can be seen from the figure that the distribution morphology of silt particles and clay particles is basically opposite to the distribution of sand particles.
4.3 Spatial structure and distribution characteristics of soil infiltration
4.3.1 Traditional statistical analysis of soil infiltration
The infiltration of water in the soil is a gradual decline process, that is, the infiltration rate gradually decreases with time until it reaches a stable infiltration rate. The soil infiltration is usually evaluated by the initial infiltration rate (IIR) and the stable infiltration rate (SIR).
| Item | Mean
(mm·min-1) |
Median
(mm·min-1) |
Maximum
(mm·min-1) |
Minimum
(mm·min-1) |
Standard deviation | Coefficient of Variation | Kurtosis | Skewness | Distribution type |
| IIR | 6.98 | 5.72 | 22.60 | 2.95 | 3.9461 | 0.5655 | 0.8267 | 0.2127 | Normal |
| SIR | 1.94 | 1.49 | 5.55 | 0.48 | 1.3415 | 0.6905 | 0.4237 | 0.1445 | Normal |
It can be seen from Table 3 that both the initial infiltration and the stable infiltration conform to the normal distribution. Among them, the initial infiltration varies from 2.95 mm/min to 22.60 mm/min, and the stable infiltration is between 0.48 mm/min to 5.55 mm/min. The coefficients of variation of the two are 0.5655 and 0.6905 respectively, which are both moderate variations.
The infiltration of different land use types is different, and the infiltration statistics of each plot are shown in Table 4.
| Land use type | Research land | Other grass | Arbor | Other woodland | orchard | Irrigated land |
| IIR (mm·min-1) | 4.31 | 6.89 | 7.01 | 8.55 | 5.58 | 6.24 |
| SIR (mm·min-1) | 1.02 | 1.65 | 1.61 | 2.75 | 1.68 | 1.79 |
It can be seen from Table 4 that the initial infiltration values of different land use types are between 4.31 mm/min and 8.55 mm/min, and the stable infiltration values are between 1.02 mm/min and 2.75 mm/min. Among them, for the initial infiltration, the maximum value is 8.55 mm/min for other forest land, and the minimum value is 4.31 mm/min for scientific research land. As for stable infiltration, the maximum and minimum values are also other forest land and scientific research land, and the average values are 2.75 mm/min and 1.02 mm/min.
4.3.2 Spatial structure characteristics of soil infiltration
| Item | Types | Nugget value
Co |
Partial sill value
C |
Abutment value
Co+C |
Co/(Co+C)
(%) |
Variation distance
(m) |
R2 | RSS |
| IIR | Spherical | 0.010 | 20.190 | 20.200 | 0.00050 | 663.0 | 0.882 | 0.0903 |
| SIR | Spherical | 0.042 | 1.769 | 1.811 | 0.02374 | 315.0 | 0.259 | 0.0474 |
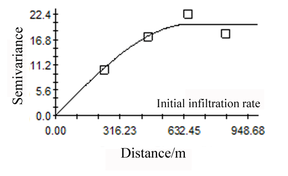
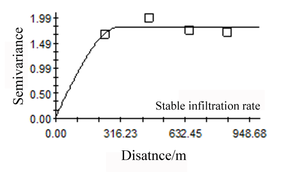
The semi-variance function of soil infiltration is analyzed and fitted. The related parameters and semi-variance function curves are shown in Table 5 and Figure 15.
It can be seen from Table 5 that both the initial infiltration and the stable infiltration conform to the spherical model, and both have strong spatial autocorrelation. As the partial abutment value of initial infiltration increases, its spatial variability is mainly caused by structural factors.
4.3.3 Spatial distribution characteristics of soil infiltration
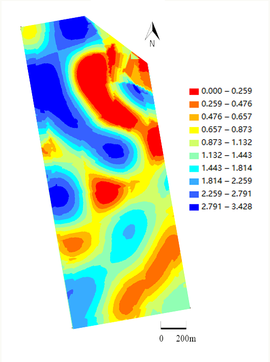
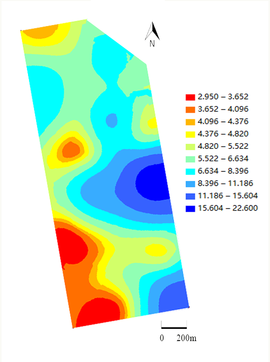
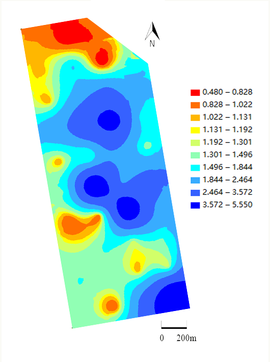
The spatial distribution of soil infiltration is shown in Figures 16-17. In the middle and southeast corners of the test area, the initial infiltration is larger and the southwest corner is smaller. The stable infiltration rate is larger in the middle and southeast corner of the test area, and smaller in the northwest corner.
Figure 16. Spatial distribution of initial infiltration rate Figure 17. Spatial distribution of stable infiltration rate
4.4 Spatial distribution relationship analysis of soil infiltration characteristics and of physical properties
There are many factors affecting soil infiltration. This study considered soil bulk density, porosity, moisture content and mechanical composition. In the case of multiple variables, the correlation between variables is very complicated. Under the condition of controlling the influence of other variables, the method to measure the degree of linear correlation between two variables among multiple variables is partial correlation analysis. Therefore, the multivariate correlation analysis needs to calculate the partial correlation analysis, and its measurement index is the partial correlation coefficient.
This experiment mainly studies the relationship between soil infiltration characteristics and different physical parameters, and the partial correlation coefficient is shown in Table 6.
| Bulk density | Total porosity | Capillary porosity | Non-capillary porosity | Water content | Sand | Silt | Clay | |
| SIR | -0.067 | 0.068* | 0.014 | 0.041 | -0.598** | 0.166 | -0.156 | -0.170* |
*means P<0.05;**means P<0.01
It can be seen from Table 6 that the bulk density, moisture content, silt and clay have a negative correlation with the stable infiltration rate, while the total porosity, capillary porosity, non-capillary porosity and sand particles have a positive correlation with stable infiltration rate. However, since only clay particles and water content are significant at P<0.05 or P<0.01, only the relationship between these two indicators and the stable infiltration rate is analyzed. It can be seen that the partial correlation coefficient between the moisture content and the stable infiltration rate is -0.598, indicating that as the moisture content and the stable infiltration rate are negatively correlated; that is, as the soil moisture content increases, the stable infiltration rate will drop significantly. The partial correlation coefficient between clay particles and stable infiltration rate is -0.170, indicating that there is a negative correlation between clay particles and stable infiltration rate; that is, as the content of soil clay particles increases, the stable infiltration rate of soil will decrease slightly.
4.5 Analysis
The nature of soil bulk density is an indirect reflection of the compactness of soil particles and the gas phase ratio. The bulk density of different land use types will vary. The test area's bulk density is of weak variability, indicating that the bulk density changes more steadily in a larger scale. From the semivariance function of the bulk density, the autocorrelation of the bulk density space is very weak. Porosity is the percentage of soil pores per unit volume, which affects the ability of soil to permeate water and air. In this study, total porosity has weak variability, and capillary porosity and non-capillary porosity are moderate variability. The spatial autocorrelation of total porosity is very weak, but the Co/(Co+C) values of capillary porosity and non-capillary porosity are 4.925% and 1.68% respectively, which has a strong spatial autocorrelation and its randomness factor accounts for small. The mechanical composition of the soil refers to the relative proportion or mass fraction of the minerals of each particle size in the soil, reflecting the size and quantity of the mineral particles. The coefficient of variation of sand in this study is 0.06, which is weak variability, while both silt and clay have moderate variation. All three parameters have strong spatial autocorrelation. Soil moisture content refers to the absolute moisture content in the soil. The coefficient of variation of soil moisture content is 36%, which is a medium variation. Its nugget value is 4.68, with moderate spatial autocorrelation, and its spatial variation is mainly determined by random factors. Soil infiltration is one of the important indexes describing the speed of soil infiltration. The better the soil infiltration, the less surface runoff and soil loss. It determines how much precipitation or irrigation water enters the soil, determines the amount of water supplied to crops and the amount of deep water storage. In this study, the coefficients of variation of initial infiltration and stable infiltration were 0.5655 and 0.6905 respectively, both of which were moderate. Both the initial infiltration and the stable infiltration have strong spatial autocorrelation, and structural factors are the main factors for their spatial variability. There are many factors affecting soil infiltration, such as vegetation type, soil structure, soil type and rainfall intensity. The main soil physical parameters studied in this experiment include bulk density, porosity, function ratio and mechanical composition. Among these factors, soil infiltration is negatively correlated with bulk density, moisture content, silt and clay particles, and positively correlated with total porosity, capillary porosity, non-capillary porosity, and sand particles. However, among these physical parameters, only the total porosity, moisture content and clay particles have significant relationships with infiltration rate. The partial correlation coefficient shows that as the total porosity increases, the infiltration of the soil will increase; and as the moisture content and the proportion of clay particles increase, the infiltration of the soil will decrease. In this experimental area, the soil physical parameters with the strongest correlation with soil infiltration are total porosity, moisture content and clay particles. If the infiltration of the soil in the test area needs to be improved, these three parameters need to be considered. Although the relationship between soil infiltration and other soil physical parameters is not significant, it also reflects a certain trend. For example, soil bulk density has a negative correlation with infiltration; that is, as the bulk density increases, the soil infiltration will decrease.
5 Conclusions
In order to study the spatial variability of soil infiltration in the improvement and utilization area of aeolian sandy land, this paper conducted experiments on the aeolian sandy land in northwestern Liaoning. Through statistics and analysis, the following conclusions are mainly obtained.
The average values of initial infiltration and stable infiltration of the soil in the study area are 6.9783 mm/min and 1.9428 mm/min, both of which are moderately variable. Combined with the semivariance function, it can be seen that the spatial distribution characteristics of initial infiltration and stable infiltration are more affected by structural factors.
In terms of spatial distribution, the soil infiltration is higher in the middle and lower in the north and south. The corresponding land use types are forest land and scientific research land.
The infiltration of the soil in the study area is positively correlated with total porosity, and negatively correlated with moisture content and clay particles. The infiltration of the soil can be improved by changing the total porosity, moisture content and the ratio of clay particles of the soil.
Conflict of interest
Authors declare that there is no conflict of interest.
Acknowledgements
This work was supported by the National Natural Science Foundation of China (grant number 41501548)
References
[1] Goovaerts P. Geostatistical tools for characterizing the spatial variability of microbiological and physico-chemical soil properties [J]. Biology and Fertility of soils, 1998, 27(4): 315-334. doi:10.1007/s003740050439
[2] Salako F K, Babalola O, Hauser S, et al. Soil macroaggregate stability under different fallow management systems and cropping intensities in southwestern Nigeria [J]. Geoderma, 1999, 91(1-2): 103-123. doi:10.1016/s0016-7061(99)00006-3
[3] Peng G, Xiang N, Lv S, et al. Fractal characterization of soil particle-size distribution under different land-use patterns in the Yellow River Delta Wetland in China [J]. Journal of Soils and Sediments, 2014, 14(6): 1116-1122. doi:10.1007/s11368-014-0876-6
[4] Bagarello V, Baiamonte G, Castellini M, et al. A comparison between the single ring pressure infiltrometer and simplified falling head techniques [J]. Hydrological Processes, 2014, 28(18): 4843-4853. doi:10.1002/hyp.9980
[5] Alletto L, Coquet Y. Temporal and spatial variability of soil bulk density and near-saturated hydraulic conductivity under two contrasted tillage management systems [J]. Geoderma, 2009, 152(1-2): 85-94. doi:10.1016/j.geoderma.2009.05.023
[6] Angulo-Jaramillo R, Bagarello V, Iovino M, et al. Infiltration measurements for soil hydraulic characterization [M]. Berlin, Germany: Springer, 2016. doi:10.1007/978-3-319-31788-5
[7] Vieira S R, Nielsen D R, Biggar J W. Spatial variability of field‐measured infiltration rate [J]. Soil Science Society of America Journal, 1981, 45(6): 1040-1048. doi:10.2136/sssaj1981.03615995004500060007
[8] Sharma M L, Gander G A, Hunt C G. Spatial variability of infiltration in a watershed [J]. Journal of Hydrology, 1980, 45(1-2): 101-122. doi:10.1016/0022-1694(80)90008-6
[9] Merz B, Plate E J. An analysis of the effects of spatial variability of soil and soil moisture on runoff [J]. Water Resources Research, 1997, 33(12): 2909-2922. doi:10.1029/97wr02204
[10] Sisson J B, Wierenga P J. Spatial variability of steady‐state infiltration rates as a stochastic process [J]. Soil Science Society of America Journal, 1981, 45(4): 699-704. doi:10.2136/sssaj1981.03615995004500040005x
[11] Peck A J, Luxmoore R J, Stolzy J L. Effects of spatial variability of soil hydraulic properties in water budget modeling [J]. Water Resources Research, 1977, 13(2): 348-354. doi:10.1029/wr013i002p00348
[12] Zhao Y, Peth S, Krümmelbein J, et al. Spatial variability of soil properties affected by grazing intensity in Inner Mongolia grassland [J]. Ecological modelling, 2007, 205(1-2): 241-254. doi:10.1016/j.ecolmodel.2007.02.019
[13] Woods S W, Birkas A, Ahl R. Spatial variability of soil hydrophobicity after wildfires in Montana and Colorado [J]. Geomorphology, 2007, 86(3-4): 465-479. doi:10.1016/j.geomorph.2006.09.015
[14] Herbst M, Diekkrüger B. Modelling the spatial variability of soil moisture in a micro-scale catchment and comparison with field data using geostatistics [J]. Physics and Chemistry of the Earth, Parts A/B/C, 2003, 28(6-7): 239-245. doi:10.1016/s1474-7065(03)00033-0
[15] Smith R E, Hebbert R H B. A Monte Carlo analysis of the hydrologic effects of spatial variability of infiltration [J]. Water Resources Research, 1979, 15(2): 419-429. doi:10.1029/wr015i002p00419
[16] Awal R, Safeeq M, Abbas F, et al. Soil physical properties spatial variability under long-term no-tillage corn [J]. Agronomy, 2019, 9(11): 750. doi:10.3390/agronomy9110750
[17] Mohammadi M, Shabanpour M, Mohammadi M H, et al. Characterizing spatial variability of soil textural fractions and fractal parameters derived from particle size distributions [J]. Pedosphere, 2019, 29(2): 224-234. doi: 10.1016/S1002-0160(17)60425-9
[18] Castellini M, Stellacci A M, Tomaiuolo M, et al. Spatial Variability of Soil Physical and Hydraulic Properties in a Durum Wheat Field: An Assessment by the BEST-Procedure [J]. Water, 2019, 11(7): 1434. doi:10.3390/w11071434
[19] Lassabatere L, Di Prima S, Angulo-Jaramillo R, et al. Beerkan multi-runs for characterizing water infiltration and spatial variability of soil hydraulic properties across scales [J]. Hydrological sciences journal, 2019, 64(2): 165-178. doi:10.1080/02626667.2018.1560448
[20] Liu Z, Ma D, Hu W, et al. Land use dependent variation of soil water infiltration characteristics and their scale-specific controls [J]. Soil and Tillage Research, 2018, 178: 139-149. doi:10.1016/j.still.2018.01.001
Document information
Published on 27/09/20
Submitted on 19/09/20
Licence: CC BY-NC-SA license
Share this document
Keywords
claim authorship
Are you one of the authors of this document?
