Abstract
The need for visual landscape assessment in large-scale projects for the evaluation of the effects of a particular project on the surrounding landscape has grown in recent years. Augmented reality (AR) has been considered for use as a landscape simulation system in which a landscape assessment object created by 3D models is included in the present surroundings. With the use of this system, the time and the cost needed to perform a 3DCG modeling of present surroundings, which is a major issue in virtual reality, are drastically reduced. This research presents the development of a 3D map-oriented handheld AR system that achieves geometric consistency using a 3D map to obtain position data instead of GPS, which has low position information accuracy, particularly in urban areas. The new system also features a gyroscope sensor to obtain posture data and a video camera to capture live video of the present surroundings. All these components are mounted in a smartphone and can be used for urban landscape assessment. Registration accuracy is evaluated to simulate an urban landscape from a short- to a long-range scale. The latter involves a distance of approximately 2000 m. The developed AR system enables users to simulate a landscape from multiple and long-distance viewpoints simultaneously and to walk around the viewpoint fields using only a smartphone. This result is the tolerance level of landscape assessment. In conclusion, the proposed method is evaluated as feasible and effective.
Keywords
Landscape simulation ; Augmented reality ; Handheld device ; Registration accuracy ; Assessment
1. Introduction
Increasing environmental awareness requires the development of methods that assist in the assessment and evaluation of environmental change, including visual impacts on the landscape (Lange, 1994 ). Preserving good visual landscape is important in enhancing our quality of life. The need for visual landscape assessment in large-scale projects for the evaluation of the effects of a particular project on the surrounding landscape has grown in recent years. Landscape assessment is the process in which a project executor evaluates and modifies his project plan based on some of the opinions of policymakers, experts, neighborhood residents, and so on. These stakeholders help create a good landscape through their involvement in each project phase, including the planning, design, construction, and maintenance phases. A landscape comprises a number of elements, such as artificial objects and natural objects. Hence, imagining concretely a 3D object that has yet to exist is difficult for stakeholders, such as project executors, academic experts, and residents. Sheppard (1989) defined visual simulation as images of a proposed project shown in perspective view in the context of the actual site. Based on this definition, a landscape simulation method using visualization systems, such as computer graphics (CG) and virtual reality (VR), has been developed and applied (Lee et al ., 2001 ; Ishii et al ., 2002 ). Lange (1994) highlighted the importance and advantage of dynamic simulations, in which the observer is not limited to certain predetermined viewpoints. In this regard, 3DCG perspective drawing or pre-rendered animation is limited in terms of reviewing an object immediately from the viewpoint that the reviewer wants. To check the visibility of some portions of high structures behind locations of interest from multiple viewpoints in the landscape assessment process, 3D models must be made using 3DCAD, CG, or VR software to represent the geography, existing structures, and natural objects. However, creating such 3D models usually requires a large amount of time and great costs. Moreover, a landscape study for landscape assessment is performed in an outdoor planned construction site as well as in an indoor site. Given that consistency with real space is not achieved when using VR in a planned construction site, the reviewer fails to obtain an immersive experience.
In the present work, we focus on augmented reality (AR), which can super-impose a present surrounding landscape acquired with a video camera and 3DCG (Milgram and Kishino, 1994 ; Azuma, 1997 ). The use of AR involves the inclusion of a landscape assessment object in the present surroundings. In this case, a landscape preservation study can be performed. A number of outdoor ARs have been used for environmental assessment and for the pre-evaluation of the visual impact of large-scale constructions on landscape (Rokita, 1998 ; Reitmayr and Drummond, 2006 ; Ghadirian and Bishop, 2008 ; Wither et al ., 2009 ; Yabuki et al ., 2012 ). With the use of the proposed system, the time and cost needed to perform a 3DCG modeling of present surroundings are drastically reduced. In AR, the realization of registration accuracy with a live video image of an actual landscape and 3DCG is still an important feature (Charles et al ., 2010 ; Ming and Ming, 2010 ; Schall et al ., 2011 ). AR registration methods are roughly categorized as follows: 1) use of physical sensors such as the global positioning system (GPS) and gyroscope sensors, 2) use of an artificial marker, and 3) feature point detection method (Neumann and You, 1999 ). The first method generally requires expensive hardware to realize highly precise and accurate registration (Feiner et al ., 1997 ; Thomas et al ., 1998 ; Behzadan et al ., 2008 ; Leon et al ., 2009 ; Schall et al ., 2009 ; Watanabe, 2011 ). The use of this method is thus problematic because the required equipment may not always be available for the users. The second method achieves registration accuracy using an inexpensive artificial marker (Kato and Billinghurst, 1999 ). However, an artificial marker must always be visible to the AR camera. This condition limits user mobility. Moreover, a large artificial marker is needed to realize high precision (Yabuki et al., 2011 ). The third method involves the extraction of feature points and has gained momentum in the field of research, including in the topic of registration for outdoor AR (Klein and Murray, ; Ventura, 2012 ). However, the proposed system was verified on the assumption that the distance between the AR camera and the target of landscape simulation is less than 100 m (Ventura and Höllerer, 2012 ). This distance is treated as a near view area in the aspect of landscape study. In the present work, we consider an AR system that allows a distant view area. Hence, the distance between the AR camera and the target of landscape simulation is considered and set to 2000 m.
Smartphones or tablet computers are widely available as handheld devices. Several studies on handheld AR systems have been reported for indoor and short-range outdoor use (Wagner and Schmalstieg, 2003 ; Damala et al ., ; Schall et al ., 2008 ; Mulloni et al ., 2011 ). One product of these studies is the sensor-oriented mobile AR (SOAR) system, which realizes registration accuracy using GPS, a gyroscope sensor, and a video camera that are mounted in a handheld smartphone (Fukuda et al., 2012 ; see Chapter 2). The SOAR system can easily be used in landscape simulation. However, the position information obtained by GPS, particularly in urban areas, is relatively low. Therefore, the present study develops a 3D map-oriented handheld AR system (hereinafter referred to as 3DMAP-AR) to obtain highly precise position information using a simple operation.
To obtain position data, the proposed system achieves geometric consistency using a 3D map instead of GPS. The system also comprises a gyroscope sensor to obtain posture data and a video camera to capture live video. All these components are mounted in a smartphone. Registration accuracy is evaluated to simulate an urban landscape from a short- to a long-range scale. The latter involves a distance of approximately 2000 m. An inexpensive AR system with high accuracy and flexibility is realized through this research.
2. Developed SOAR and 3DMAP-AR
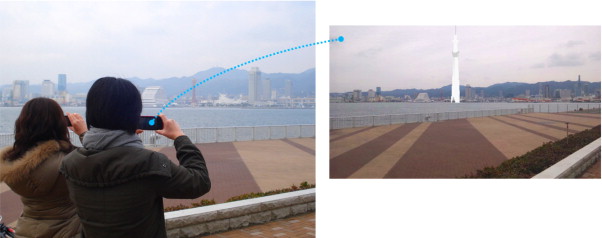
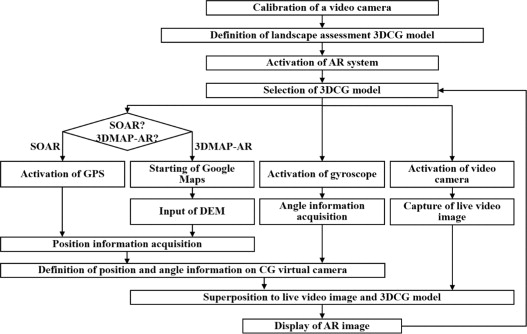
The developed SOAR and 3DMAP-AR for urban landscape simulation run on a smartphone with standard specifications, including an Android 2.2 operating system and Open GL-ES 2.0. For the 3DMAP-AR, the applied 3D map includes Google Maps API and a digital evaluation model (DEM). Google Maps API allows switching between the normal map mode and the aerial photo mode. The DEM allows switching between the digital terrain model (DTM), which can represent ground surfaces without objects such as plants and buildings, and the digital surface model (DSM), which can represent the earth׳s surface and all objects on it. The conceptual diagram and AR screenshots of SOAR and 3DMAP-AR are shown in Figure 1 . The flow of the developed system is illustrated in Figure 2 and described as follows:
- A live video recording is set up. While the 3DCG model realizes ideal rendering by the perspective drawing method, video camera rendering produces distortion. Therefore, the video camera must be calibrated. The calibration is performed with an Android NDK-OpenCV.
- A 3DCG model, which is the target of landscape simulation, is created. First, the geometry (.obj file format), material (.mtl file format), and unit of the 3DCG model are defined in the 3DCG model. Second, the name, file name, position data (longitude, latitude and altitude), degree of posture, and zone number of the rectangular plane of the 3DCG model are defined in the 3DCG model allocation file. Finally, the allocation list file, the number of 3DCG model allocation information files, and each name in the 3DCG model arrangement information file are defined in the 3DCG model.
- An AR user selects a 3DCG model that creates a landscape assessment object using the GUI of the smartphone.
- After the 3DCG model is selected, user posture data (yaw, pitch and roll) are acquired using the gyroscope sensor of the smartphone. A live video image of the present surroundings is also acquired with a live video camera.
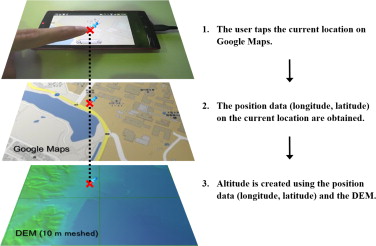
- For the SOAR system, user position data (latitude, longitude and altitude) are acquired with the GPS feature of the smartphone. For the 3DMAP-AR, the user can tap the current position on Google Maps. Then, the current position data (longitude and latitude) are obtained and converted into the coordinates (x , y ) of a rectangular plane. Meanwhile, altitude is obtained using the position data (longitude and latitude) and the DEM. The altitudes between the mesh vertices are linearly interpolated (Figure 3 ). The yaw value acquired by the gyroscope sensor points out magnetic north. In an AR system, the use of a true north value requires the acquisition and correction of magnetic declination. The position and posture data on a CG virtual camera, which renders 3DCG, are defined through these procedures.
|
|
|
Figure 3. Obtaining of position data using 3DMAP-AR. |
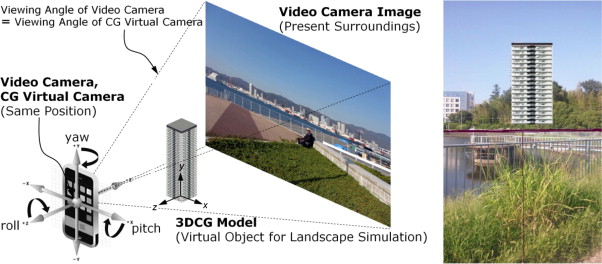
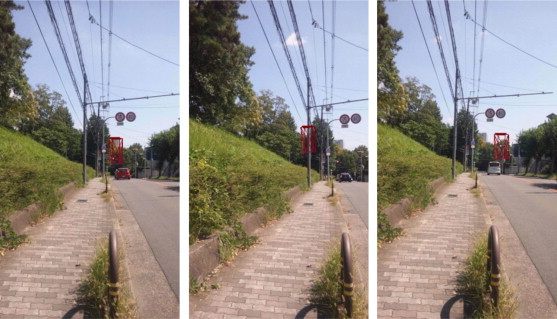
- A 3DCG model is created to be superimposed on the live video image obtained by the video camera (Figure 4 ).
|
|
|
Figure 4. Landscape simulation using 3DMAP-AR. |
|
|
|
Figure 1. Conceptual diagram of handheld AR (left) and AR screenshot (right). |
|
|
|
Figure 2. 3DMAP-AR and SOAR system flow. |
3. Registration accuracy of a video image and 3DCG
3.1. Experimental methodology
The parameters for realizing registration accuracy were the position information (latitude, longitude and ellipsoidal height) acquired by GPS for SOAR or by 3D map for the 3DMAP-AR and posture information (yaw, pitch, roll) acquired with the gyroscope sensor on the smartphone. In this experiment, DTM data with a mesh size of 10 m were used as DEM data in the 3DMAP-AR. The registration accuracy was determined by combining the residual error of these parameters. First, the type of detection characteristic showed by each parameter was identified. Therefore, a landscape viewpoint location with known position information and posture information was set up. In one experiment, only one parameter was acquired from a device; the remaining parameters were used to set a known value as a fixed value. A 3DCG model was rendered by wire-frame representation based on an existing building. This model was superimposed on the live video image, and the residual error was measured using the AR screenshots.
Nine experiments were conducted in this research (Table 1 ). In experiment 1, all the data on the latitude, longitude, ellipsoidal height, yaw, pitch, and roll of the CG virtual camera were represented by fixed values. In experiment 2, all the data on the latitude, longitude, ellipsoidal height, yaw, pitch, and roll of the CG virtual camera were represented by dynamic values acquired from the GPS and gyroscope slope in the SOAR system. In experiments 3–8, the dynamic values acquired from the GPS and gyroscope sensor were used for only one parameter chosen among the latitude, longitude, ellipsoidal height, yaw, pitch, and roll of the CG virtual camera. The remaining parameters were used with known fixed values. In experiment 9, all the data on the latitude, longitude, ellipsoidal height, yaw, pitch, and roll of the CG virtual camera were represented by dynamic values acquired from the 3D map and the gyroscope sensor using the 3DMAP-AR.
| Position data of CG virtual camera | Posture data of CG virtual camera | |||||
|---|---|---|---|---|---|---|
| Latitude | Longitude | Altitude | Yaw | Pitch | Roll | |
| No. 1 | F | F | F | F | F | F |
| No. 2 (SOAR) | D (GPS) | D (GPS) | D (GPS) | D | D | D |
| No. 3 | D (GPS) | F | F | F | F | F |
| No. 4 | F | D (GPS) | F | F | F | F |
| No. 5 | F | F | D (GPS) | F | F | F |
| No. 6 | F | F | F | D | F | F |
| No. 7 | F | F | F | F | D | F |
| No. 8 | F | F | F | F | F | D |
| No. 9 (3DMAP-AR) | D (3D map) | D (3D map) | D (3D map) | D | D | D |
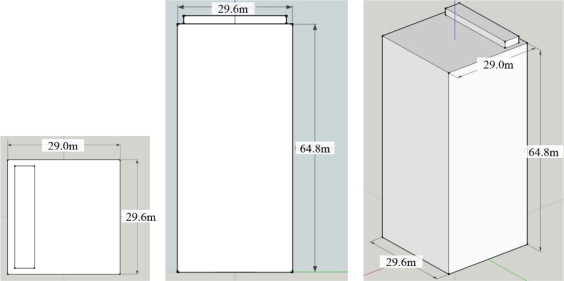
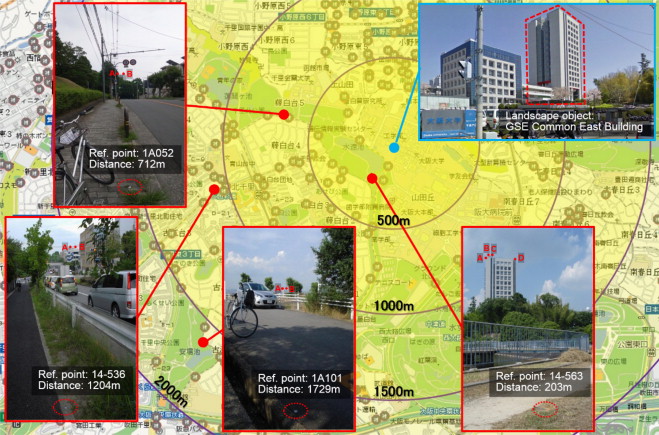
The GSE Common East Building of Osaka University (W: 29.6 m, D: 29.0 m, H: 67.0 m) was targeted as a landscape assessment object. A simple 3DCG model of this building was generated based on the design drawing (Figure 5 ). As landscape assessment viewpoint locations, the following locations in Suita City, Osaka, Japan, where the GSE Common East Building stands, were used: no. 14-563 reference point (latitude, longitude, altitude)=(34.821457, 135.519612, 53.03), No. 1A052 reference point=(34.824712, 135.513246, 69.76), No. 14-536 reference point=(34.820285, 135.508021, 53.86), and No. 1A101 reference point=(34.812214, 135.507148, 83.87). The distances from the reference point to the center of the GSE Common East Building were 203, 712, 1204, and 1729 m (Table 2 ). The developed AR system was installed with a tripod at a level height of 1.5 m from the ground. A map presenting the landscape object and reference points is shown in Figure 6 .
|
|
|
Figure 5. 3D model of GSE common east building (left: plan view, middle: elevation view, right: isometric view). |
| Reference points | Latitude (deg.) | Longitude (deg.) | Altitude (m) | Distance to GSE Common East Bldg. (m) | Dimension per pixel on AR display (m) |
|---|---|---|---|---|---|
| GSE Common East Bldg. | 34.823027 | 135.520751 | 60.15 | ||
| 14-563 | 34.821457 | 135.519612 | 53.03 | 202.98 | 0.12 |
| 1A052 | 34.824712 | 135.513246 | 69.76 | 711.61 | 0.453 |
| 14-536 | 34.820285 | 135.508021 | 53.86 | 1203.73 | 0.712 |
| 1A101 | 34.812214 | 135.507148 | 83.87 | 1728.56 | 1.046 |
|
|
|
Figure 6. Landscape object and reference points. |
The experiment was conducted on a fine weather on September 2011. The AR image was captured eight times in an experiment on a reference point (in total, 9 experiments×4 reference points×8 captures=288 AR screenshots). The resolution of an AR screen shot was 1920×1080 pixels.
3.2. Calculation of residual error
The calculation of residual error at the measuring point is detailed below.
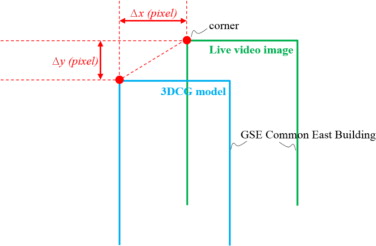
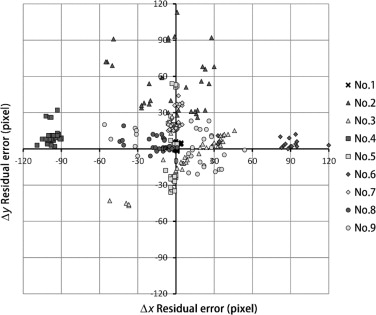
- Two or four corners of the building on each reference point were set to the measuring points of residual error A, B, C, and D (see Figure 6 ). Each difference between the horizontal and vertical directions of those points and the 3DCG model were measured in terms of the number of pixels (Δx , Δy ). This difference is called a pixel error (see Figure 7 ).
|
|
|
Figure 7. Calculation of pixel error using AR screenshot. |
- From the acquired value (Δx , Δy ), each difference in the horizontal and vertical directions was computed as a meter unit by formulas 1 and 2 (ΔX , ΔY ). This difference is called a distance error.
|
|
( 1) |
|
|
( 2) |
W : actual width of an object (m), H : actual height of an object (m), x : width of 3DCG model on AR image (px), y : height of 3DCG model on AR image (px)
3.3. Consideration of allowable error
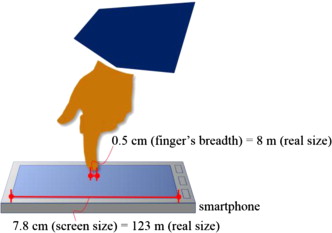
The residual error of the position data (longitude, latitude) is attributable to the gap between the position the user taps on Google Maps and the real present position. When the scale size of the digital map is maximized on Google Maps, the distance in the real space of the map is 123 m given a screen size of 7.8 cm. That is, 1 cm on a screen is about 16 m in real space.
As the map is tapped using the finger of the user, a residual error may also be generated by the width of the finger. In this study, a finger width of 5 mm was considered. Therefore, if the scale size of a digital map and the error of finger width are taken into account, an error can be set to less than 8 m when directing latitude and longitude (Figure 8 ). With regard to the residual error of altitude, the DEM with 10 m mesh cannot respond to the change in the altitude starting from model generation. A difference with reality may emerge because the altitude between the mesh vertices is linearly interpolated.
|
|
|
Figure 8. Allowable error when directing latitude and longitude on Google Maps. |
3.4. Results and discussion
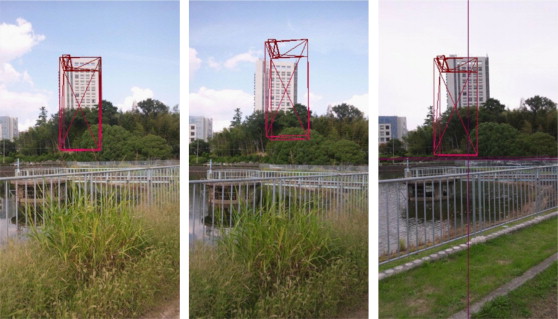
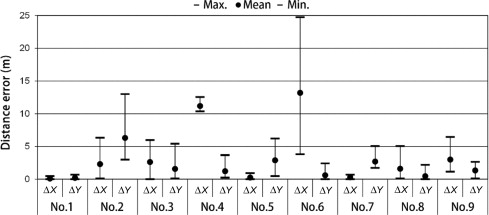
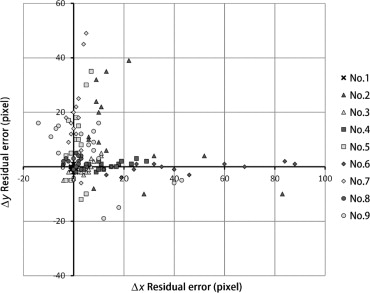
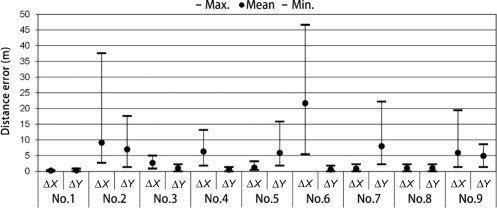
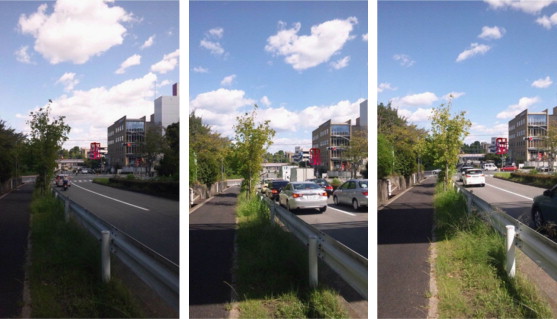
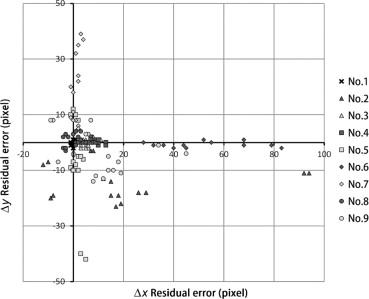
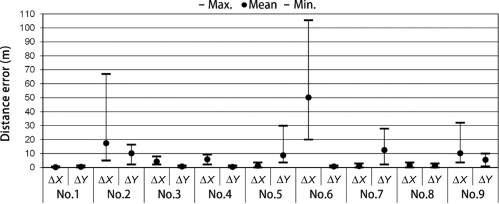
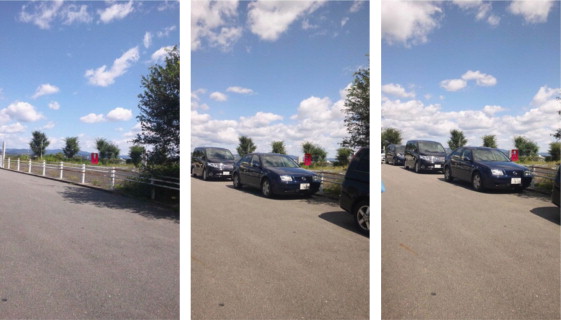
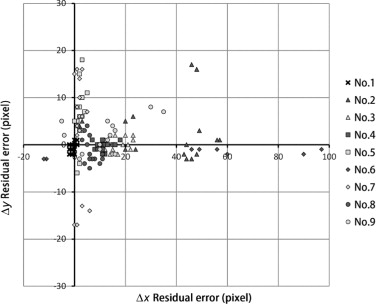
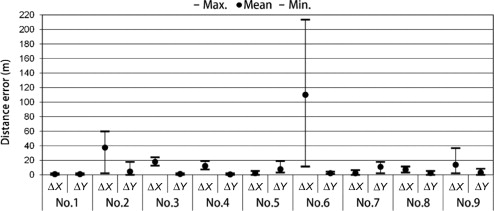
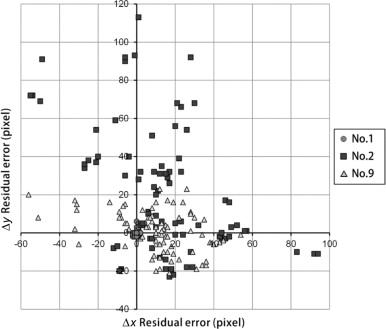
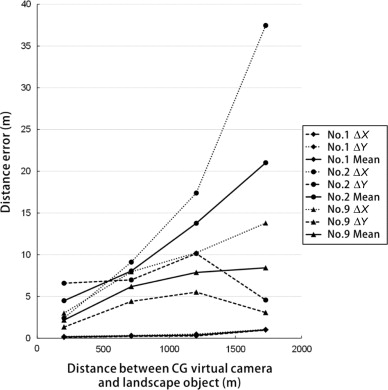
The AR screenshots of each experiment are shown in Figure 9 , Figure 10 , Figure 11 , Figure 12 , Figure 13 , Figure 14 , Figure 15 , Figure 16 , Figure 17 , Figure 18 , Figure 19 ; Figure 20 . The pixel errors of nos. 1, 2, and 9 at all reference points are shown in Figure 21 , and distance errors are shown in Figure 22 . In experiment 1, the pixel error was less than or equal to 1 pixel, and the mean distance error was less than 0.5 m. These results verify the high accuracy of the AR rendering and suggest that an object 2000 m away can be fully evaluated when a known fixed value is used.
|
|
|
Figure 9. AR screenshots at 14–563 (left: no. 1, middle: no. 2, right: no. 9). |
|
|
|
Figure 10. Pixel errors at 14–563. |
|
|
|
Figure 11. Distance errors at 14–563. |
|
|
|
Figure 12. AR screenshots at 1A052 (left: no. 1, middle: no. 2, right: no. 9). |
|
|
|
Figure 13. Pixel errors at 1A052. |
|
|
|
Figure 14. Distance errors at 1A052. |
|
|
|
Figure 15. AR screenshots at 14–536 (left: no. 1, middle: no. 2, right: no. 9). |
|
|
|
Figure 16. Pixel errors at 14–536. |
|
|
|
Figure 17. Distance errors at 14–536. |
|
|
|
Figure 18. AR screenshots at 1A101 (left: no. 1, middle: no. 2, right: no. 9). |
|
|
|
Figure 19. Pixel errors at 1A101. |
|
|
|
Figure 20. Distance errors at 1A101. |
|
|
|
Figure 21. Pixel errors of nos. 1, 2, and 9 at all reference points. |
|
|
|
Figure 22. Distance errors of nos. 1, 2, and 9 at all reference points. |
The characteristics of latitude, longitude, and altitude, which affect errors in the SOAR system, and those of yaw, pitch and roll, which affect errors in both the SOAR and 3DMAP-AR, were considered. First, when the distance between the CG virtual camera and the landscape assessment object increased, the number of errors also increased. This phenomenon is attributable to the fact that when the distance between a CG virtual camera and a landscape assessment object increases, the dimension per pixel also increases (Table 2 ). That is, a few pixel errors on an AR screen can greatly affect distance error. Second, when horizontal errors were considered, the mean distance errors of yaw (no. 6), latitude (no. 3), longitude (no. 4), and roll (no. 8) ranged from 13.2 m to 110.1 m, 2.6 m to 17.9 m, 5.8 m to 12.2 m, and 1 to 7.3 m, respectively. The largest error among all reference points was that of yaw. Third, when vertical errors were considered, the mean distance errors of altitude (no. 5) and pitch (no. 7) ranged from 2.9 m to 8.7 m and from 2.7 m to 12.5 m. Although reducing both horizontal and vertical errors is desirable, high-precision vertical registration is necessary in many cases when simulating factors such as height zoning, which is a municipal restriction on the maximum height of any building or structure. The accuracy of yaw, pitch, and roll can be improved by stabilizing the posture using a tripod. Meanwhile, the accuracy of latitude, longitude, and altitude acquired by GPS must also be considered. Although the tendency of locating errors can be approximately determined based on the value of the dilution of precision (Dilution of Precision, 2013) computed by QZ radar, which can detect the position of GPS satellites (Japan Aerospace Exploration Agency, 2013 ), an exact distance error cannot be established.
The accuracy of the 3DMAP-AR, which was developed to improve the uncertain distance errors of GPS, was considered in this study. When the accuracy of SOAR (no. 2) was compared with that of 3DMAP-AR (no. 9), the distance error of the 3DMAP-AR in both the horizontal and vertical directions is smaller than that of SOAR. That is, compared with that of SOAR, the rendering performance of the 3DMAP-AR is high. Given that the 3DMAP-AR uses 3D map information, its vertical error is smaller than that of SOAR from 1.5 m to 5.2 m. The vertical errors of GPS are known to be larger than the horizontal errors. Therefore, the 3DMAP-AR effectively addresses the shortcomings of the SOAR system. In the experiment, the average error of the 3DMAP-AR was always less than 6 m within a 2000 m distance between the 3DCG virtual camera and the landscape assessment object. Hence, this error is comparable to that in a previous research that used a large artificial marker for landscape simulation (Yabuki et al., 2011 ).
4. Conclusion
AR has been used as a landscape simulation system that provides immersive experience because 3D landscape assessment objects are superimposed on the present surroundings. Meanwhile, an issue in VR is the considerable amount of time and cost needed to create a 3D model of the present terrain and buildings. Therefore, this study developed a 3DMAP-AR system that realizes geometric registration using a 3D map instead of GPS in obtaining position data, a gyroscope sensor in obtaining posture data, and a video camera in capturing live video of present surroundings. These applications were all mounted in a smartphone for urban landscape assessment. Registration accuracy was evaluated to simulate an urban landscape from a short- to a long-range scale, with the latter involving a distance of approximately 2000 m. The contributions of this research are as follows:
- The developed 3DMAP-AR system enables users to simulate a landscape from multiple and long-distance viewpoints simultaneously. Users can also walk around the viewpoint fields by simply using a smartphone without installing other special devices.
- The developed AR system was validated to ensure that a landscape assessment object at a distance of 2000 m from an important viewpoint can be fully evaluated when a known fixed value is set. The mean distance error was less than 0.5 m, which is the tolerance level of landscape assessment.
- The distance error of the 3DMAP-AR ranged from 4 m to 9 m, and its vertical error ranged from 1.5 m to 5.2 m. When the distance between the 3DCG virtual camera and the landscape assessment object increased, the error also increased. This error is comparable to that in a previous research that used a large artificial marker system for landscape simulation. The proposed method was evaluated as feasible and effective.
A future work should attempt to improve the optical integrity and occlusion problem of the 3DMAP-AR system for urban landscape simulation.
References
- Azuma, 1997 R.T. Azuma; A survey of augmented reality; Presence-Teleoperators Virtual Environ., 6 (4) (1997), pp. 355–385
- Behzadan et al., 2008 A.H. Behzadan, B.W. Timm, V.R. Kamat; General-purpose modular hardware and software framework for mobile outdoor augmented reality applications in engineering; Adv. Eng. Inform., 22 (2008), pp. 90–105
- Charles et al., 2010 Charles, W., Mika, H., Otto, K., Tuomas, K., Miika, A., Kari, R., Kalle, K. 2010. Mixed reality for mobile construction site visualization and communication. In: Proceedings of the 10th International Conference on Construction Applications of Virtual Reality (conVR2010), 35–44.
- Damala et al., Damala, A., Cubaud, P., Bationo, A., Houlier, P., Marchal, I. 2008. Bridging the gap between the digital and the physical: design and evaluation of a mobile augmented reality guide for the museum visit. In: proceedings of the 3rd International Conference on Digital Interactive Media in Entertainment and Arts (DIMEA 2008), 120–127.
- Feiner et al., 1997 S. Feiner, B. MacIntyre, T. Hollerer; A touring machine: prototype 3D mobile augmented reality system for exploring the urban environment; ISWC97, 1 (4) (1997), pp. 208–217
- Fukuda et al., 2012 Fukuda, T., Zhang, T., Shimizu, A., Taguchi, M., Sun, L., Yabuki, N. 2012. SOAR: Sensor oriented Mobile Augmented Reality for urban landscape assessment. In: Proceedings of the 17th International Conference on Computer Aided Architectural Design Research in Asia (CAADRIA2012), 387–396.
- Ghadirian and Bishop, 2008 P. Ghadirian, I.D. Bishop; Integration of augmented reality and GIS: a new approach to realistic landscape visualisation; Landsc. Urban Plan., 86 (2008), pp. 226–232
- Ishii et al., 2002 Ishii, H., Joseph, E.B., Underkoffler, J., Yeung, Y., Chak, D., Kanji, Z., Piper, B. 2002. Augmented urban planning workbench: overlaying drawings, physical models and digital simulation. In: Proceedings of the International Symposium on Mixed and Augmented Reality (ISMAR׳02), 1–9.
- Japan Aerospace Exploration Agency, 2013 Japan Aerospace Exploration Agency. 2013. QZ-radar, 〈http://qz-vision.jaxa.jp/USE/en/index〉 (accessed 26.12.13).
- Kato and Billinghurst, 1999 Kato, H., Billinghurst, M.1999. Marker tracking and HMD calibration for a video-based augmented reality conferencing system. In: Proceedings of the 2nd International Workshop on Augmented Reality, San Francisco, CA, USA.
- Klein and Murray, Klein, G. and Murray, D. 2007. Parallel tracking and mapping for small AR workspaces, ISMAR ‘07. In: Proceedings of the 2007 6th IEEE and ACM International Symposium on Mixed and Augmented Reality, 225–234.
- Lange, 1994 E. Lange; Integration of computerized visual simulation and visual assessment in environmental planning; Landsc. Urban Plan., 30 (1994), pp. 99–112
- Lee et al., 2001 E.J. Lee, S.H. Woo, T. Sasada; The evaluation system for design alternatives in collaborative design; Autom. Constr., 10 (2001), pp. 295–301
- Leon et al., 2009 Leon, B., Kristian, A.H. and Wytze, H. 2009. C2B: augmented reality on the construction site. In: Proceedings of the 9th International Conference on Construction Applications of Virtual Reality (conVR2009), 295–304.
- Milgram and Kishino, 1994 P. Milgram, F. Kishino; A taxonomy of mixed reality visual displays; IEICE Trans. Inform. Syst. E77-D, 12 (1994), pp. 1321–1329
- Ming and Ming, 2010 Ming, F.S., Ming, L. 2010. Bored pile construction visualization by enhanced production-line chart and augmented-reality photos. In: Proceedings of the 10th International Conference on Construction Applications of Virtual Reality (conVR2010), 165–174.
- Mulloni et al., 2011 Mulloni, A., Seichter, H., Schmalstieg, D.2011. Handheld augmented reality indoor navigation with activity-based instructions. In: Proceedings of the 13th international conference on human computer interaction with mobile devices and services, 211–220.
- Neumann and You, 1999 U. Neumann, S. You; Natural feature tracking for augmented reality; IEEE Trans. Multimed., 1 (1) (1999), pp. 53–64
- Reitmayr and Drummond, 2006 Reitmayr, G., Drummond, T.W. 2006. Going out: robust model-based tracking for outdoor augmented reality. In: Proceedings of the IEEE International Symposium on Mixed and Augmented Reality, 109–118.
- Rokita, 1998 P. Rokita; Compositing computer graphics and real world video sequences; Comput. Netw. ISDN Syst., 30 (1998), pp. 2047–2057
- Schall et al., 2008 G. Schall, E. Mendez, E. Kruijff, E. Veas, S. Junghanns, B. Reitinger, D. Schmalstieg; Handheld augmented reality for underground infrastructure visualization; J. Personal Ubiquitous Comput. (2008), pp. 281–291
- Schall et al., 2011 G. Schall, J. Schöning, V. Paelke, G. Gartner; A survey on augmented maps and environments: Approaches, interactions and applications; Adv. Web-based GIS, Mapp. Serv. Appl. (2011), pp. 207–225
- Schall et al., 2009 Schall, G., Wagner, D., Reitmayr, G., Taichmann, E., Wieser, M., Schmalstieg, D., and Hofmann-Wellenhof, B. 2009. Global pose estimation using multi-sensor fusion for outdoor augmented reality. In: Proceedings of the IEEE International Symposium on Mixed and Augmented Reality, 153–162.
- Sheppard, 1989 S.R.J. Sheppard; Visual Simulation, a Users Guide for Architects, Engineers, and Planners; Van Nostrand Reinhold, New York (1989)
- Thomas et al., 1998 Thomas, B., Demezuk, V., Piekarski, W., Hepworth, D., Bunther, B.1998. A wearable computer system with augmented reality to support terrestrial navigation. In: Proceedings of the 2nd International Symposium on Wearable Computers, 166–167.
- Ventura, 2012 J. Ventura; Wide-Area Visual Modeling and Tracking for Mobile Augmented Reality, Computer Science; (Ph.D.) University of California, Santa Barbara, CA (2012)
- Ventura and Höllerer, 2012 Ventura, J., Höllerer, T. 2012. Wide-area scene mapping for mobile visual tracking. In: Proceedings of the IEEE International Symposium on Mixed and Augmented Reality, 3–12.
- Wagner and Schmalstieg, 2003 Wagner, D. and Schmalstieg, D.2003. First steps towards handheld augmented reality. In: Proceedings of the Seventh IEEE International Symposium on Wearable Computers (ISWC׳03), 127–135.
- Watanabe, 2011 S. Watanabe; Simulating 3D architecture and urban landscapes in real space; Comput. Aided Architect. Des. Res. Asia (2011), pp. 261–270
- Wither et al., 2009 J. Wither, S. DiVerdi, T. Höllerer; Annotation in outdoor augmented reality; Comput. Graph., 33 (2009), pp. 679–689
- Yabuki et al., 2012 Yabuki, N., Hamada, Y., Fukuda, T. 2012. Development of an accurate registration technique for outdoor augmented reality using point cloud data. In: Proceedings of the 14th International Conference on Computing in Civil and Building Engineering.
- Yabuki et al., 2011 N. Yabuki, K. Miyashita, T. Fukuda; An invisible height evaluation system for building height regulation to preserve good landscapes using augmented reality; Autom. Const., 20 (3) (2011), pp. 228–235
Document information
Published on 12/05/17
Submitted on 12/05/17
Licence: Other
Share this document
Keywords
claim authorship
Are you one of the authors of this document?
