Abstract
Daily maximum temperatures from 753 stations across China and the heat wave indicators are used to study the temporal and spatial characteristics of heat wave intensity, frequency and heat wave days in China over the period of 1961–2010. The results show that high frequency, long duration and strong intensity of heat waves occurred in the Jianghuai area, Jiangnan area, and eastern Sichuan Basin. The highest frequency and the longest duration are located in northern Jiangxi and northern Zhejiang provinces, and the highest intensity in northern Zhejiang province is even more prominent. The frequency, heat wave days and intensity showed a general increasing trend in the past 50 years, while decadal characteristics are also observed with a decreasing trend from the 1960s to the early 1980s and increasing trend from the end of the 1980s to 2010. The regional variations demonstrate a significant increasing trend in the northern and western parts of North China, central-northern part of Northwest China, the central part of South China, the Yangtze River Delta and the southern Sichuan Basin, with an obvious decreasing trend in the southern Huanghuai area, northern Jianghuai area and Hanjiang River Basin.
Keywords
heat wave ; intensity ; frequency ; duration
1. Introduction
The IPCC Forth Assessment Report concluded that the global surface temperature had risen by 0.74°C in 1906–2005 (IPCC, 2007 ). The linear warming rate over the last 50 years (0.13°C per decade) is nearly double of the last 100 years’, and 11 of the last 12 years (1995–2006) rank among the 12 warmest years in the instrumental record of global surface temperature (since 1850) (Qin et al., 2007 ). Under global warming, heat wave hazards occurred more and more frequently (e.g., a series of heat waves happened in the summer of 2003 over the world, in 2010 summer in Russia and the 2012 summer in the U.S.) (Tobias et al., 2010 ). The heat waves have harmful effects on people’s health, national economy and social security. Therefore, they have captured attention from governments and meteorologists.
In the past few years, scientists in China focused on the study of heat waves (Shi et al ., 2008 ; Tan et al ., 2008 ; Wu et al ., 2010 ; Luo and Liu, 2005 ; Wu and Du, 2011 ). However the scopes of these studies were mainly limited to local regions. Few made a nationwide analysis and discussed the adverse impact of heat waves on human health, especially on local residents’ mortality. Further and fewer used the heat wave indicator considering the different geographic and climatic backgrounds which lead to the diversity of people’s tolerance to high temperature in different areas. Some scholars are subjective in the daily maximum temperature 95th or 99th percentile as high temperature threshold (Ding et al ., 2010 ; He et al ., 2010 ; Kuglitsch et al ., 2010 ). Although some studies have also explored the relationship between the heat wave and the mortality (Chen et al., 2009 ; Pei and Li, 2010), the definition of the heat wave and the duration are not objectively enough.
Proverbially, people have different ability of bearing high temperature in different regions or climate zones because of people’s long-term adaptability to the local climate. Heat wave standard should be based on the impacts or damages of high temperature on human health in order to reflect the actual impacts of the local heat wave effects. The heat wave indicators developed by Ye et al. (2012) based on the significant mortality increase are used here to study the temporal and spatial distribution of heat wave intensity, frequency, and duration in China from 1961 to 2010 to further understand their occurrence, development and evolution, which will be significantly helpful for relevant departments to monitor and forecast heat waves and to mitigate the damage.
2. Data and methods
This study made use of a set of homogenized daily maximum (June–August) temperature data from 753 in-situ stations across China from 1961 to 2010. The preliminary research indicates that daily high temperature has a significant impact on the mortality of local residents in summer and its threshold is close to the 97th percentile of the daily maximum temperature in summer in 1971–2000. Thus, a heat wave event is defined as daily maximum temperature greater than the 97th percentile of 1971–2000 summer (excluded the cold regions where the thresholds are below 29°C), which lasts at least 6 days. In addition, the linear trend and significance test are employed in this paper. To be significant at the level 0.1, 0.05, and 0.01, the absolute values of the regression coefficient must be greater than 0.2330, 0.3577 and 0.4476, respectively.
According to the heat wave definition, the heat wave intensity for one station in a given year is calculated as
|
|
( 1) |
where Ti is the maximum temperature on the i th day, T97 is the threshold for the station, and n is the number of days of all heat wave events.
3. Results and discussion
3.1. The characteristics of heat wave frequency
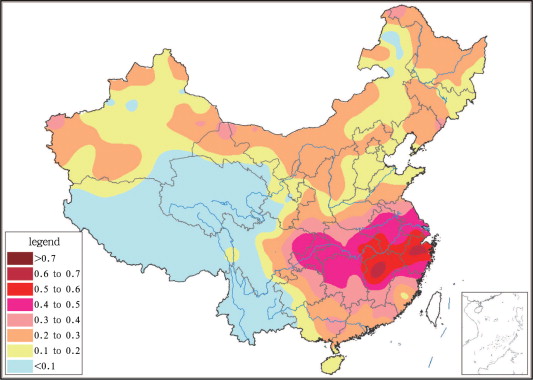
The heat wave frequency refers to as the number of heat wave events occurring in one year at one station. However in most areas, heat wave does not occur every year. Figure 1 shows that the average annual frequency of heat waves in northern China is 0.1–0.3, which suggests heat wave occurs once every 3–5 years and even once every 5–10 years in local regions. The average annual frequencies in the Jianghuai area, Jiangnan area and eastern Sichuan Basin are generally more than 0.4, and the higher frequencies (0.5–0.7) are found in northern Jiangxi, eastern Hubei and northern Zhejiang, which indicates heat waves usually appear once in 2–3 years. Only few areas are attacked by heat waves every year.
|
|
|
Figure 1. The distribution of annual heat wave frequency in China (1961–2010 means) |
It is also found that from 1961 to 2010 heat waves occured in most areas of China except the Qinghai-Tibet Plateau, Yunnan province, western Sichuan provinces, northeastern Inner Mongolia, and the Tianshan Mountains. The annual heat waves are ≥ 2 at most in Sichuan Basin, the Jianghan area, Jianghuai area, Jiangnan area, South China, central Inner Mongolia, western Shandong, Liaoning, and central Heilongjiang provinces. Particularly, the annual frequencies are 3–4 in northern Jiangxi and northern Zhejiang provinces.
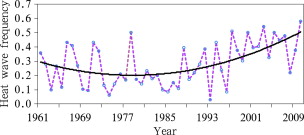
Figure 2 demonstrates the change of the national mean heat wave frequency from 1961 to 2010. It is clear that from the 1960s to the early 1990s, the national mean heat wave frequency generally fluctuated in the range of 0.1–0.4, reaching the peak of 0.5 in 1977. After the mid-1990s, a significant increasing trend is observed and the frequency reached more than 0.5 in 1998, 2000, 2003, 2005 and 2010. In particular, it rose up to 0.6 in 2010.
|
|
|
Figure 2. The national mean annual heat wave frequency over China from 1961 to 2010 |
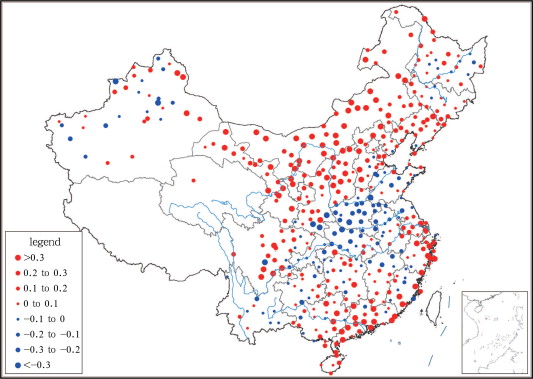
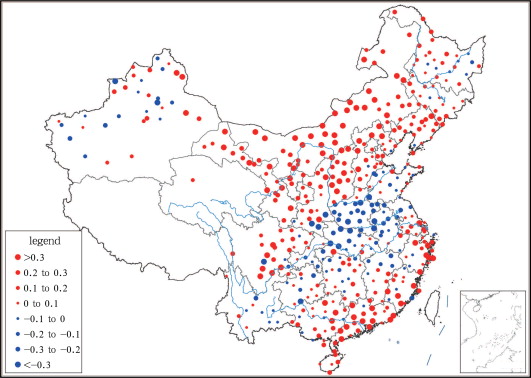
In the past 50 years, the change of heat wave frequency shows an obvious regional characteristic (Fig. 3 ). In the northern and western North China, northern and central Northwest China, central and southern South China, southern Sichuan Basin, most parts of Inner Mongolia and the Yangtze River Delta, the heat wave frequency shows significant increasing trends; while in the Jianghan area and western Huanghuai area, it shows decreasing trends. In the left areas of the country, the variations are insignificant.
|
|
|
Figure 3. The linear trends of heat wave frequency in China from 1961 to 2010 (unit: times per decade) |
3.2. The characteristics of heat wave days
Here the annual heat wave days are defined as the total number of days of all heat wave events. In particular, throughout the summer one station may have one or more heat wave events, or may have none. Figure 4 shows the distribution of average heat wave days of in-situ stations over China of 1961–2010 means. Heat waves mainly occurred in southeastern China including the Jianghuai area, most parts of the Jiangnan area and eastern Sichuan Basin with 3–5 d in average. The maximum values of 5–6 d are found in northern Zhejiang and Jiangxi provinces.
|
|
|
Figure 4. Spatial distribution of annual heat wave days over China (1961–2010 means, unit: d) |
In fact, the inter-annual variation of annual heat wave days is very large, and the influences are more harmful with more heat wave days. The annual heat wave days in China are generally at most more than 10 d, and in the Jianghuai area, Jiangnan area, eastern South China and Sichuan Basin, there are more than 20 d. In Fujian, Zhejiang and Jiangxi provinces, the annual heat wave days can reach up to more than 30 d, which indicates the areas are attacked by heat waves during more than 30% of their summer days.
The longest duration of one heat wave event is an important indicator of the heat wave intensity. From 1961 to 2000, the longest duration of one heat wave event is 16–20 d in the Jianghuai area, Jiangnan area, northern Fujian and Sichuan Basin. The maximum values (35 d) are found in Nanping, Fujian province. In the other areas of China mainland (except the areas that did not have heat waves) the longest heat wave duration is 6–15 d.
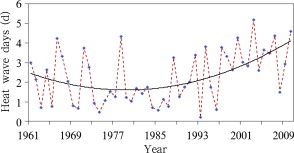
In the past 50 years, the national mean annual heat wave days over China shows a U-shape pattern (Fig. 5 ). In particular, it declined from 1961 to 1987, but a significant increasing trend is found from 1988 to 2010. It suggests that the heat wave days in summer have been more frequently seen since the end of the 1980s. More hot days occured in 1994, 1997, 2000, 2003, 2007 and 2010. Among them, three were in the last decade. Moreover, the national annual mean heat wave days in 2003 recorded the highest for the past 50 years. The increase is regarded as a shift of the statistical distribution towards warmer temperatures (Schär et al., 2004 ), which make heat waves becoming more intense, more frequent, and longer lasting in China in the past few years.
|
|
|
Figure 5. National mean annual heat wave days over China from 1961 to 2010 |
The linear trends of annual heat wave days at in-situ station in the past 50 years are shown in Figure 6 . In the northern and western areas of North China, the northeastern part of Northwest China, central South China, central and western Inner Mongolia, southern Sichuan Basin and the southeast coastal areas, the annual heat wave days has increasing trends with the most significant increase in central South China, northern North China, central Inner Mongolia. While in the western Huanghuai area and the Hanjiang River Valley, it shows a decreasing trend. The area with increasing trend is significantly larger than that with decreasing trend. In other words, the areas affected by heat waves are growing in China.
|
|
|
Figure 6. The linear trends of annual heat wave days in China from 1961 to 2010 (unit: d per decade) |
3.3. The characteristics of heat wave intensity
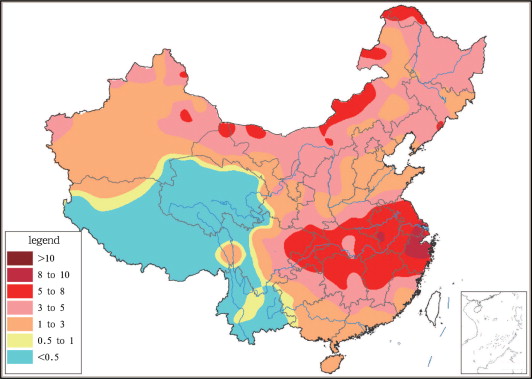
Figure 7 shows the spatial distribution of the 1961–2010 mean heat wave intensity in China. It is clear that strong heat wave with intensity of 510°C d is observed in the middle and lower reaches of the Yangtze River and the eastern Sichuan Basin. Northern Zhejiang province recorded the highest of 8–10°C d. The intensities in Inner Mongolia and Northeast China are relatively low (3–8°C d). Weak intensity (≤ 3°C d) mainly occurs in South China, eastern North China, western China including Xinjiang, Gansu, Yunnan and the Qinghai-Tibet Plateau.
|
|
|
Figure 7. The spatial distribution of heat wave intensity (1961–2010 mean, unit: °C d) |
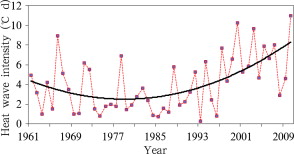
Figure 8 shows the temporal variations of national mean heat wave intensity from 1961 to 2010. The national mean heat wave intensity showed a decreasing trend from the early 1960s to the mid-1980s, then a significant increasing trend was found from the early 1990s to 2010. In the past 50 years, the three years with strongest heat wave intensity all occurred in the 21st century, e.g., 2010, 2000 and 2003.
|
|
|
Figure 8. National mean heat wave intensity over China from 1961 to 2010 |
The maximum heat wave intensities in the past 50 years (Figure obmitted) are relatively high in the Jianghuai area, Jiangnan area, Sichuan Basin, Heilongjiang province and Inner Mongolia. Especially, the maximum heat wave intensities of Zhejiang province, northern Fujian province, central Jiangsu province, central Anhui province, western Chongqing municipality, north-central Inner Mongolia and northern Heilongjiang province are even high, generally 40–50°C d, even up to 50–70°C d in some areas. The maximum heat wave intensity in most parts of South China is significantly lower than that in the Jiangnan area and eastern North China and eastern Northwest China. Although there are lower values of heat wave frequency and annual heat wave days in northern China, the maximum heat wave intensity is close to that of the Jianghuai area, Jiangnan area, eastern Sichuan Basin where there are more heat waves.
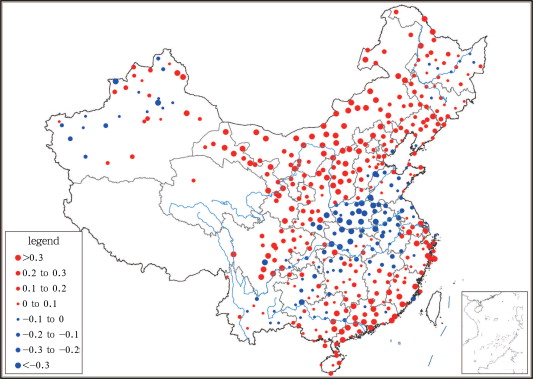
In the past 50 years, the heat wave intensity showed a significant increasing trend in the northern part of Northwest China, northern and western parts of North China, central and eastern parts of South China, central and western parts of Inner Mongolia, central part of Liaoning province, the Yangtze River Delta and southern Sichuan Basin, while the heat wave intensity in the south part of the Huanghuai area, north part of the Jianghuai area and the Hanjiang River Valley had decreasing trends (Fig. 9 ).
|
|
|
Figure 9. The linear trends of heat wave intensity from 1961 to 2010 (unit: °C d per decade) |
4. Conclusions and disscussion
By using the daily maximum surface air temperature from 753 in-situ stations in China from 1961 to 2010, we have analyzed the temporal and spatial characteristics of heat wave frequency, days, and intensity. In summary, 4 key results can be obtained as follows:
(1) The high-value zones of heat wave frequency, days, and intensity in 1961–2010 were basically concentrated in the middle and lower reaches of the Yangtze River and the eastern Sichuan Basin. The strongest heat waves are found in northern Zhejiang province and northern Jiangxi province with the most frequency.
(2) The heat wave frequency, days, and intensity illustrate large inter-annual variations. In particular, the highest frequency is more than 4 in one year, the longest duration is more than 30 d, and the strongest intensity is 50–70°C d.
(3) The inter-decadal variation of heat wave frequency, days, and intensity are similar. Decreasing trends were all found from 1960s to mid-1980s, and significant increasing trends were observed from the end of the 1980s to 2010. The three years with the highest heat wave intensity and maximum heat wave days all appeared in the last decade, indicating that the heat wave intensity, duration and frequency are increasing.
(4) In the past 50 years, in the northern area of North China, the northern region of Northwest China, the central and eastern parts of South China, the Yangtze River Delta region and the Sichuan Basin, the heat wave frequency, days, and intensity were obviously increasing as a response to the global warming. While decreasing trends are found in the southern Huanghuai area, northern Jianghuai area and the Hanjiang River. The decreasing trends are similar as the summer temperature (Liu et al., 2010 ). Overall, the area which increasing of heat wave frequency and intensity is greater than that with decreasing trend. In the context of global warming, the area affected by heat waves is becoming larger and larger, and the heat wave frequency is becoming higher and higher, and the heat wave duration is becoming longer in China.
(5) Since the 1990s, in particular since the beginning of the 21st century, the heat wave intensity and heat wave days have shown a significant increasing trend. First, this is mainly related to global warming. Secondly, with the acceleration of urbanization, the reduction of vegetation, the urban expansion, and the increase of population density, the urban heat island effect becomes even more obvious (Ji et al., 2006 ). This no doubt increases the temperature in cities in summer.
Acknowledgements
The research was funded by China National Key Technology R&D Program Fund (No. 2007BAC29B05-01), and the National Basic Research Program of China (No. 2012CB955903).
References
- Chen et al., 2009 H. Chen, L.-P. Li, Y.-N. Chen; Heat wave and daily mortality of residents in a coastal city in China; Journal of Environment and Health (in Chinese), 26 (11) (2009), pp. 988–990
- Ding et al., 2010 T. Ding, W.-H. Qian, Z.-W. Yan; Changes in hot days and heat waves in China during 1961–2007; International Journal of Climatology, 30 (2010), pp. 1452–1462
- He et al., 2010 S.-F. He, E.-F. Dai, Q.S. Ge, et al.; Preestimation of spatiotemporal pattern of extreme heat hazard in China; Journal of Natural Disasters (in Chinese), 19 (2) (2010), pp. 91–97
- IPCC, 2007 IPCC; Climate Change 2007: The Physical Science Basis; Cambridge University Press, Cambridge (2007)
- Ji et al., 2006 C.-P. Ji, W.-D. Liu, C.-Y. Xuan; Impact of urban growth on the heat island in Beijing; Chinese Journal of Geophysics (in Chinese), 49 (1) (2006), pp. 69–77
- Kuglitsch et al., 2010 F.G. Kuglitsch, A. Toreti, E.X. Oplaki, et al.; Heat wave changes in the eastern Mediterranean since 1960; Geophysical Research Letters, 37 (2010) http://dx.doi.org/10.1029/2009GL041841 L04802
- Liu et al., 2010 K.-Q. Liu, H.-J. Wang, K. Wang; Variation trend analysis of the annual and seasonal average temperature in central China; Resources and Environment in the Yangtze Basin (in Chinese), 19 (S1) (2010), pp. 62–66
- Luo and Liu, 2005 M.-J. Luo, W.-Y. Liu; The climatic analysis for the scorching weather and heat wave in Nanchang city; Journal of Guangxi Meteorology (in Chinese), 26 (2) (2005), pp. 18–20
- Pei and Li, 2011 D.-S. Pei, L.-P. Li; Threshold of ambient temperature in five cities based on population daily mortality; Chinese Journal of Disease Control and Prevention (in Chinese), 15 (5) (2011), pp. 372–376
- Qin et al., 2007 D.-H. Qin, Z.-L. Chen, Y. Luo; Updated understanding of climate change sciences; Advances in Climate Change Research (in Chinese), 3 (2) (2007), pp. 63–73
- Schär et al., 2004 C. Schär, P.L. Vidale, D. Lüthi, et al.; The role of increasing temperature variability in European summer heat waves; Nature, 427 (2004), pp. 332–336
- Shi et al., 2008 J. Shi, Y.-H. Ding, L.-L. Cui; Climatic characteristics and their changing law during summer high-temperature times in east China; Acta Geographica Sinica (in Chinese), 63 (3) (2008), pp. 237–246
- Tan et al., 2008 J.-G. Tan, Y.-F. Zheng, L. Peng, et al.; Effect of urban heat island of heat waves in summer of Shanghai; Plateau Meteorology (in Chinese), 27 (S12) (2008), pp. 144–149
- Tobías et al., 2010 A. Tobías, P.G. de Olalla, C. Linares, et al.; Short-term effects of extreme hot summer temperatures on total daily mortality in Barcelona, Spain; International Journal of Biometeorology (54) (2010), pp. 115–117
- Wu and Du, 2011 H.-Y. Wu, Y.-D. Du; Climatic characteristics and change laws of high temperature in Guangdong during the last 49 years; Journal of Tropical Meteorology (in Chinese), 27 (3) (2011), pp. 427–432
- Wu et al., 2010 R.-J. Wu, Y.-F. Zheng, J.-J. Liu, et al.; Trend analysis of high temperature disaster in large cities of Yangtze River delta; Journal of Natural Disasters (in Chinese), 19 (5) (2010), pp. 57–63
- Ye et al., 2012 D.-X. Ye, J.-F. Yin, Z.-H. Chen; Effects of heat waves on human health and the determination of its indices; L.-C. Song (Ed.), The Theory and Practice of Meteorological Disasters and Risk Assessment (in Chinese), China Meteorological Press, Beijing (2012), pp. 64–74
