1 Introduction
The increasing use of composite materials in the aerospace industry implies a growing interest in composite manufacturing process simulation with a strong requirement on predictive accuracy. Among the industrial processes used in the production phase, resin infusion appears more and more as an economical alternative to manufacture large parts with an important fiber fraction (wind turbine blade, aircraft wing…). However, the lack of control on the final properties of the part, implying long and expensive process tuning, significantly reduces its potential for mass production. In this context, ESI Group enhanced its ESI PAM-COMPOSITES software introducing fluid-solid coupled approach in PAM-RTM module in order to simulate more accurately Vacuum Assisted Resin Infusion (VARI) process with the objective to facilitate infusion like process development in the composite industry. The model presented is an industrial implementation of the approach developed in partnership between ESI Group and academics [1-2].
2 Vacuum Assisted Resin Infusion (VARI) process
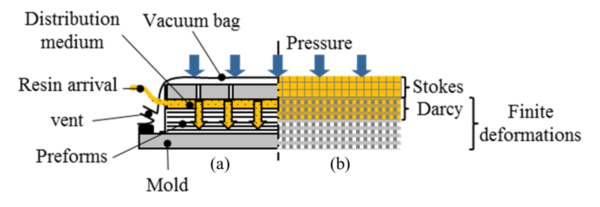
Vacuum Assisted Resin Infusion (VARI) consists in creating a liquid film of resin on the top of a dry preform thanks to a very permeable material, the distribution medium. Then, the pressure differential between the vent (0 bar) and the injection line (atmospheric pressure) induces the infusion of the resin across the thickness direction (¡Error! No se encuentra el origen de la referencia.). Finally, a pressure and temperature cycle is applied to the system to bring the resin into a solid state.
The flexibility of the vacuum bag does not allow maintaining a constant thickness during the whole process, while good control of part thickness is mandatory to ensure geometrical and mechanical properties of the final part.
3 Modeling of VARI process
3.1 Resin flow – Darcy’s law
As described in section 2, the resin flows first in a distribution medium and then in the preform. Both materials are considered as porous medium and therefore the flow is governed by Darcy’s law:
|
|
(1) |
where is the Darcy velocity or the relative average resin velocity with respect to the fabrics, is the permeability tensor and is the interstitial pressure. In addition, resin can be considered as an incompressible fluid leading to:
|
|
(2) |
Combining (1) and (2), we get Richard’s equation:
| (3) | (3) |
PAM-RTM solver implements a non-conforming finite element approach to solve (3)[4].
3.2 Preform behavior – Solid Mechanic
During the injection phase due to competition between atmospheric pressure (external) and resin pressure (internal), preform undergoes deformation. Indeed, when vacuuming the system the preform is submitted to a compression load (surface strength), then, when inlet is open the resin flow induces a volume strength (resin hydrostatic pressure) balancing the compression load. Stresses and strains thus induced are the source of permeability and volume variations to consider during the filling phase in order to accurately anticipate the amount of injected resin and infusion times. Neglecting the effects of inertia, we can write the momentum conservation of the solid phase (preform or fibre bed) as follows:
| (4) | (4) |
where is the Cauchy stress tensor, is the displacement and the volumes forces. In addition, the preform is represented by an equivalent orthotropic homogeneous medium composed of rigid fibers, so that each macroscopic strain is reflected by fiber rearrangements at the microscopic scale (¡Error! No se encuentra el origen de la referencia.). Therefore, we can directly compute porosity (or fibre fraction) from solid mechanics strains [2], with no need to use semi-empirical laws expressing porosity as a function of interstitial pressure. Thus, porosity is updated according to the following equation:
|
|
(5) |
where is the Jacobian of the transformation and is the porosity of the equivalent homogeneous medium.
On numerical side, this model is implemented through a static implicit approach within ESI Group solid mechanics solver.
3.3 Fluid-Solid Coupling
The behavior of the preform is coupled to fluid mechanics through the Terzaghi’s law (6) [5] and the explicit calculation of permeability through the fiber volume fraction (analytic model or experimental curves), which is one of the major features of the coupled approach presented here.
| (6) | (6) |
with the overall stress applied to the system, the effective stress in the preforms and the unit tensor.
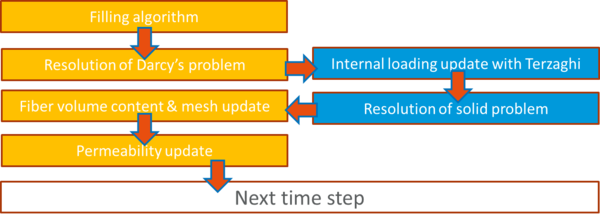
The fluid problem (Darcy) is solved on a fixed grid, i.e. for rigid preforms. Pressure field is then transferred to solid mechanics solver and the non-linear solid problem is solved for an equivalent behavior in the sense of Terzaghi. Finally, solid mechanics displacements are transferred to fluid mechanics solver allowing the geometry and permeability to be updated for the next time step [2-3]. The above described coupling algorithm is graphically presented on ¡Error! No se encuentra el origen de la referencia..
4 Experimental validation and industrial application
4.1 Experimental validation: infusion of a plate
This innovative model has been validated through a comparison to an infusion experiment made by P. Wang [6]. The test involved a 335x335mm² plate made of 24 plies [906, 06]S of quasi-unidirectional fabrics (G1157, Hexcel Reinforcements) for a total thickness before compression of 9.8 mm and 40% of fiber content. The permeability is considered as isotropic and and driven by Carman-Kozeny’s law as follows:
|
|
(7) |
with the fiber content. The resin is the RTM6 also provided by Hexcel Reinforcement. The experiment was monitored through a fringe pattern projection method coupled with three in-situ thermocouples located between ply number 21 and 22. The fringe pattern projection method permits to follow the change in the thickness during the whole infusion process. Table 1 and figure 4 shows the results that are in very good agreement with experiment.
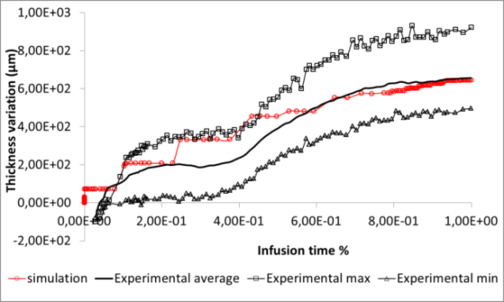
Figure 5 permits to compare the evolution of the thickness simulated with the one observed during the experiment. This comparison validates the model used to simulate the evolution of the thickness over time. In fact, the curve corresponding to the simulation lies in the tendency of the experimental curves. However, the three stages (impregnation without swelling, sudden swelling and moderated swelling) observed experimentally are not clearly identifiable on the simulation.
This can be explained by several reasons. Firstly, we can notice that the simulated thickness variation evolves by steps, that seems unrealistic. These numerical artifacts could come from the filling algorithm that advance element-by-element. On the other hand, the conditions of the experimental infusion did not correspond to standard conditions used for the simulation. Indeed, to use the fringe pattern projection, the oven was opened during the experiment resulting in a non constant and non controlled temperature. This had an influence on the viscosity of the resin, which has directly impacted its flow and therefore has probably influence the mode of impregnation of the preform.
Even if work remains to achieve optimal experimental validation (monitoring thickness and flow front while controlling infusion parameters), these results demonstrate the interest and the relevance of the approach presented in this work.
4.2 Industrial application: Panel reinforced by a stiffening «T»
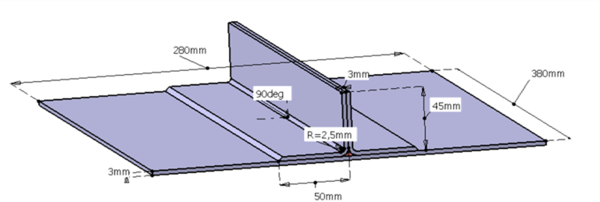
To demonstrate the capability of the code developed in this work on industrial applications, we propose to simulate the full infusion of a plate reinforced by a “T” stringer, which geometry has been proposed by Daher-Socata within the european INFUCOMP project. This part consists of a plate 380x280x3 mm3 stiffened by a «T», itself made up of two “L” preforms 3 mm thick, as described in figure 6.
Conditions of infusion are presented in figure 7. A distribution medium is placed under the part in contact with the mold and a second one is positioned above the “T”. Resin injection is
located in the center of the plate under the mold while the vent is located in the center of the second distribution medium above the "T".
The preforms used are made of carbon fabrics provided by Hexcel Reinforcements (reference 48302 made of T700 12 k carbon fibers). The orthotropic permeability of the reinforcement measured by Hexcel is:
|
|
(8) |
with the fiber volume fraction. The resin used for the infusion is RTM6. Due to the symmetry of the problem, we simulate only one quarter of the geometry as described in figure 8. The mesh used is composed of 8,100 triangles and 1,884 nodes. The distribution medium at the bottom of the preform is represented by a pure resin flow (Stokes area) and is 1 mm thick. It is considered non-deformable. The preform is considered as an equivalent porous homogeneous medium (Darcy area), whose constitutive law has not been studied.
Here, for the example we will assume that it obeys to the same behavior as the one measured by P. Wang [6]. However, we are aware that the behavior of a stack of quasi-unidirectional fabrics not preformed is much more flexible than a classic industrial preform held in shape by an epoxy powder. Injection is represented by a boundary condition in pressure of 1 bar and the vent by a pressure boundary condition of 0 bar.
Finally, the other boundary conditions are impervious wall ( ) . The boundary conditions are summarized in figures 8.
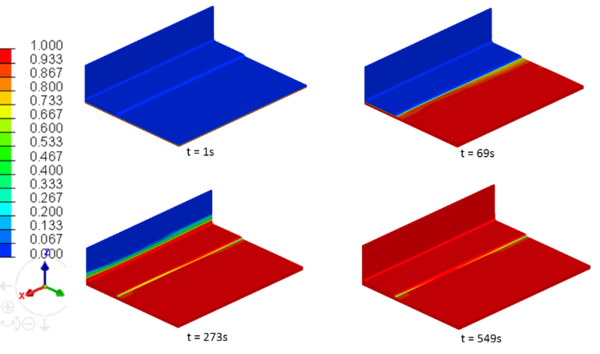
Figures 9 and 10 show the filling ratio at times t = 1 s, t = 69 s, t = 273 s and t = 550 s. The results reflect a quick filling of the distribution medium (1 s), then a transverse infusion of the plate. When the resin starts to infuse the plate, beginning of the swelling can be identified (see figure 11). After about one minute, the plate is completely filled, the pressure is balanced in its extremities and the preform swells back to its initial thickness (see figure 10 at t = 69 s). Then, the resin begins to migrate in the base of the T, first in the transverse direction, and then, when it reaches the curvature, in the plan of the plies (see figure 9 at t = 273 s). Finally, resin finishes impregnating the upper part of the “T” and the filling ends after 549 seconds. One can notice a bad impregnation at the base of the “T” (see figure 9 at t = 549 s). This result has been observed on certain infusions made during the project INFUCOMP.
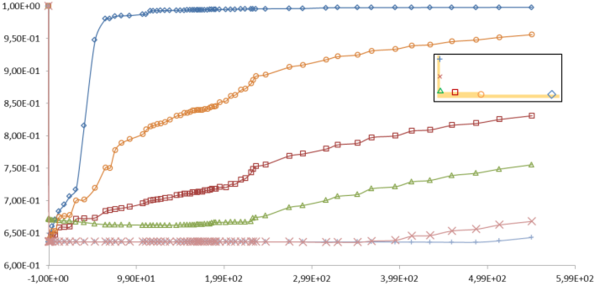
Figure 11 shows the variation of the thickness during the infusion. It may be noted that the areas of the part that have been impregnated in the in-plane direction (curvature and upper part of the T) presents a linear swelling along time, while the plate and the base of the T, which have been impregnated transversely, have three distinct phases. Indeed, one can
observe a first phase of filling with a small swelling. Then when resin reaches the vacuum bag, a sharp increase of thickness occurs. Finally, it continues to swell linearly during the end of the infusion.
5 Conclusion
We have presented an innovative model for the simulation of composite parts processing by resin infusion. The originality of the proposed method is that it remains robust and accurate even for real severe physical parameters such as low permeability values, thin pure fluid layer, large deformations and complex geometries which are often discarded in recent publications but more relevant with respect to industrial applications. To do that, we coupled Stokes and Darcy equation with finite strain solid mechanics. The specific coupling conditions allowing taking into account actual physical parameters have been presented and validated on an experimental test cases. Finally, an application on a complex case in three dimensions demonstrated the ability of this approach to deal with industrial infusion cases.
However, to fully meet the industrial needs, improvements must be developed. Thus, Thermo-chemical coupling must be introduced to simulate non isothermal processes. Mechanisms governing the formation and the transport of micro porosities should be studied, in order, to take it into account in our simulations.
6 References
[1] Celle, P., Drapier, S., Bergheau, J-M. “Numerical Modeling of liquid infusion into fibrous media undergoing compaction.” European Journal of Mechanics – A/Solids 27(4) (2008): 647-661.
[2] Dereims, A., Drapier, S., Bergheau, J-M., de Luca, P. “3D robust iterative coupling of Stokes, Darcy and solid mechanics for low permeability media undergoing finite strains”. Finite Elements in Analysis and Design 94(1) (2015):1-15.
[3] Marquette, P., Dereims, A., Ogawa, T., Kobayashi, M., “Numerical methods for 3D compressive RTM solutions.” 17th European Conference on Composite Materials (ECCM17). Munich, 2016.
[4] Trochu, F.; Gauvin, R.; Boudreault, J-F. “RTMFLOT - An Integrated Software Environment for the Computer Simulation of the Resin Transfer Molding Process” Journal of Reinforced Plastics and Composite 13(3) (1994): 262-270.
[5] Terzaghi, K., Peck, R.B., Mesri, G. Soil Mechanics in Engineering Practice, Wiley- IEEE, 1956
[6] P. Wang, S. Drapier, J. Molimard, A. Vautrin, and J-C. Minni. Characterization of Liquid Resin Infusion (LRI) filling by fringe pattern projection and in situ thermocouples, Composites Part A: Applied Science and Manufacturing, Vol 41, No 1, pp 36-44, 2010
Document information
Published on 31/03/22
Accepted on 31/03/22
Submitted on 30/03/22
Volume 03 - Comunicaciones Matcomp17 (2019), Issue Núm. 3 - Procesos de Fabricación II y Materiales Avanzados, 2022
DOI: 10.23967/r.matcomp.2022.03.008
Licence: Other
Share this document
Keywords
claim authorship
Are you one of the authors of this document?


