Affiliation:
1,2,3,4Cagayan State University, Carig Campus, College of Engineering and Architecture, Civil Engineering Department, Tuguegarao City, Philippines
ORCID:
4* ![]()
Licensed under:
![]()
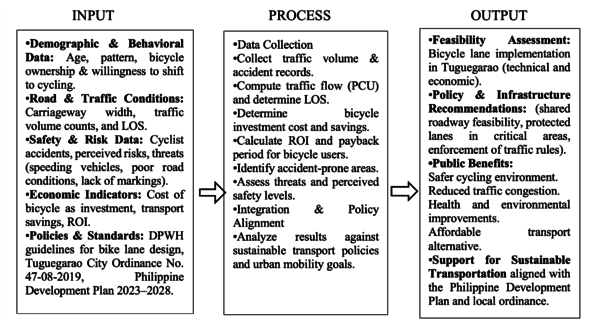
1. Introduction
1.1 Background
Cycling has increasingly emerged as a sustainable and efficient mode of transportation in many developing urban cities, offering clear economic and environmental benefits (Rodrigue, 2024). In the Philippines, however, the increasing reliance on motorized transport—currently at 11.7 million registered units as of 2024—has worsened traffic congestion and contributed to growing environmental issues (Land Transportation Office, 2024). Such concerns call for the urgent adoption of alternative and more environmentally friendly transportation systems.
The COVID-19 pandemic further reshaped patterns of urban mobility. A survey revealed that 42% of Filipinos experienced greater difficulty commuting compared to pre-pandemic conditions (Social Weather Stations [SWS], 2020). During this period, bicycles gained renewed relevance as a practical option, supported by the fact that 87% of Filipino households own at least one bicycle (SWS, 2023). These figures highlight cycling’s strong yet underutilized potential in addressing the needs for short-distance travel.
Globally, cycling is strongly advocated as a healthy and environmentally friendly mode of active transport (World Health Organization, 2023). At the national level, the Philippine Development Plan (2023–2028) emphasizes the need for increased intermodal transport systems and prioritizing active mobility infrastructure (Department of Transportation [DOTr], 2023). At the same time, government programs and advocacy groups insist on the need for pedestrian- and cyclist-friendly road designs (Department of Health [DOH] & SWS, 2020). Despite these efforts, the adoption of cycling remains limited, primarily due to safety concerns. Research in Metro Manila has shown that cycling crashes are often attributed to inadequate infrastructure and hazardous driving practices (Morrison et al., 2019; Relation & Shi, 2023).
These issues are not limited to the capital. Tuguegarao City, for instance, also experiences similar mobility and safety concerns, which led to the promulgation of Ordinance No. 47-08-2019, authorizing the construction of bike lanes and protecting cyclists (City Government of Tuguegarao, 2019).
With this background, both national and local interests exist to explore the technical and economic viability of implementing bike lanes in Tuguegarao City. This research aims to contribute to sustainable transport planning by assessing the driving forces, infrastructural readiness, safety concerns, and economic potential of cycling as a people-moving alternative.
1.2 Statement of the Problem
While bicycles offer an environmentally friendly, affordable, and health-promoting form of mobility, their inclusion into the transport system of Tuguegarao City is limited by several factors. Travelers acknowledge the individual, financial, and environmental advantages of cycling (World Health Organization, 2023; SWS, 2023). Nonetheless, inadequate road conditions, lack of safe lanes, and frequent road accidents involving cyclists deter more extensive use (Morrison et al., 2019; Relation & Shi, 2023).
Such challenges are most salient in key corridors, such as the Maharlika Highway, where elevated traffic volumes of motorized units pose significant risks to cyclists' safety (DPWH, 2013; DPWH, 2022). Local accident records, as reported by the Philippine National Police, attest that these areas continue to be unsafe for vulnerable road users, such as cyclists (Philippine National Police – Carig Station, 2020–2024). Although the City Government of Tuguegarao passed Ordinance No. 47-08-2019 to encourage cycling and provide safety measures, enforcement has been undermined by inadequate enforcement and low levels of infrastructure investment.
Despite worldwide recognition of cycling as a sustainable form of active transportation and national policies in favor of promoting active mobility, there remains a scarcity of localized studies that explore the technical and economic viability of bike lane construction in secondary cities, such as Tuguegarao. The majority of current research focuses on Metro Manila and other large metropolitan areas, with a notable knowledge gap for smaller but rapidly growing urban areas. The void needs to be filled in order to facilitate local governments in making informed decisions while planning safe and affordable cycling infrastructure.
Therefore, through this research, an attempt is made to assess the driving forces, infrastructure preparedness, safety issues, and economic feasibility of cycling in Tuguegarao City, thus offering evidence-based support for sustainable transport planning and policy enforcement at both the national and local levels.
1.3 Objective of the Study
1.3.1 General Objective
The primary objective of this study was to evaluate the technical and economic aspects of implementing bike lanes in Tuguegarao City, with the goal of promoting sustainable transportation and urban mobility.
1.3.2 Specific Objectives
This research would seek to analyze the economic and technical viability of the implementation of bike lanes within Tuguegarao City through the following goals:
- 1. Determine the determinants of cycling adoption – in order to identify both the driving forces (e.g., health and ecological advantages) and the inhibiting forces (e.g., safety and infrastructure) that would influence residents' propensity to cycle.
- 2. Assess road and traffic conditions – to determine the existing conditions of Maharlika Highway in terms of surface quality, carriageway width, and Level of Service (LOS) to determine the technical feasibility of implementing bike lanes.
- 3. Assess commuting patterns and multi-modal usage – to determine how current residents commute and utilize multiple transport modes, and investigate how bicycles can be used as a complementary and convenient mode.
- 4. Road safety risk assessment and infrastructure sufficiency – to check records of accidents and self-identified threats experienced by cyclists, and to assess if the current infrastructure is adequate to provide them with safety.
- 5. Establish the cost-effectiveness of cycling – to estimate costs of investment, monthly transportation costs savings, and ROI, and also consider residents' willingness to buy bicycles and protective gear if safe lanes are provided.
1.4 Research Questions
The following research questions frame this study:
- 1. What promotes or discourages the use of cycling in Tuguegarao City, specifically regarding health advantages, environmental benefits, safety, and the presence of infrastructure?
- 2. What are the existing road and traffic conditions along Maharlika Highway—particularly surface condition, carriageway width, and Level of Service (LOS)—and how do these affect the technical viability of having bike lanes?
- 3. In what way do commuting patterns and multi-modal transportation of residents influence the scope for integrating bicycles as a complementary mode of transport?
- 4. What do cyclists encounter the road safety hazards in Tuguegarao City on both recorded and perceived grounds, and to what extent does the current infrastructure adequately protect them?
- 5. What is the economic feasibility of cycling in Tuguegarao City based on investment costs in bicycles, cost savings in transport, and return on investment (ROI), and how willing are the residents to invest in bicycles and protective gear if safer lanes are constructed?
1.5 Conceptual Framework
The Technical and Economic Analysis of Bike Lane Implementation for Sustainable Transportation in Tuguegarao City shall be beneficial to the following:
Cyclist: This study examines the feasibility of implementing bike lanes by assessing their technical and economic viability for safer and more accessible routes.
Commuters and Residents: The implementation of a bike lane would encourage more people to use bicycles in the city; frequent bicycle use would also improve overall health.
Urban Planners and Local Government Authorities: This research provides valuable insights into the respondents' understanding of the implementation of bike lanes in Tuguegarao City, supporting City Ordinance No. 47-08-2019.
Researchers and Academics: This study serves as a related literature for future researchers interested in transportation studies.
1.7 Scope of the Study
This study examines the technical and economic feasibility of implementing bike lanes for sustainable transportation in Tuguegarao City, with a specific focus on the Maharlika Highway. This addresses safety concerns and challenges in implementing bike lanes along Maharlika Highway in Tuguegarao City. This study determines the level of service of the road along Cagayan State University Carig intersection, and Rotunda to Carig Road, Tuguegarao City. The methodology of this study also includes surveys with the residents of barangays along Maharlika Highway.
2. Materials and Methods
2.1 Introduction
This research evaluated the potential of implementing bike lanes in Tuguegarao City to promote biking as a sustainable mode of transportation. Surveys, policy reviews, and traffic counts were conducted in the selected area to gather residents’ insights and experiences and assess the level of service of the existing road on Maharlika Highway.
2.2 Study Area
The study area for this survey is located in Tuguegarao City, specifically on Maharlika Highway. The study's traffic count areas include Cagayan State University, the Carig intersection, and the Rotunda Tanza to Carig Roads.

2.3 Research Design
The research employed a mixed-methods design, combining both qualitative and quantitative methods to provide a comprehensive view of cycling and bike lane applications in Tuguegarao City. The qualitative aspect aimed to gather in-depth views from cyclists, commuters, and residents to understand their experiences and insights regarding bike lanes and sustainable urban transport. The quantitative aspect, on the other hand, produced measurable information on commuting patterns, use of multi-modal transport, and the frequency of bicycle trips.
A standardized survey questionnaire was the main instrument used to gather qualitative and quantitative data. It aimed at capturing participants' perceptions about the impact of bike lanes on traffic flow, safety, and city sustainability. Traffic volume counts were also conducted to assess road performance and identify the Level of Service (LOS) at specific intersections and road segments.
The data collected were analyzed using descriptive statistics, with an emphasis on prominent themes such as determinants of cycling adoption, prevailing road and traffic conditions, compatibility with other transport modes, safety hazards and accident histories, and the financial viability of cycling as a transport alternative.
The research adhered to ethical principles. Participants were informed about the research goal and provided their consent voluntarily prior to participation. Their confidentiality and anonymity were ensured in the final report. The research spanned six months, from October 30, 2024, to May 9, 2025.
2.4 Sample population
This study collected data from two key sources: (1) Survey data from residents of barangays along Maharlika Highway. (2) Traffic flow metrics: level of service on selected road intersections: CSU Carig intersection and Rotunda Tanza to Carig Road.
2.5 Sampling Technique and Sample Size
The study used stratified random sampling to ensure the various subgroups, such as cyclists, pedestrians, and vehicle users (public or private use) of the population, are adequately represented. A random sample was drawn to ensure diversity and capture a broad range of perspectives on transportation habits, bicycle use, and support for implementing bike lanes. The target sample size was 204 respondents. The sample size was calculated using the Proportional Allocation Formula.
| Barangay | Barangay Sample Size | Barangay Population/Total Population | Total Sample Size |
| Carig Norte | 1618 | 13.43012 | 13 |
| Carig Sur | 2385 | 19.79656 | 19 |
| Pengue Ruyu | 3213 | 26.66933 | 27 |
| Tanza | 3147 | 26.12150 | 26 |
| Caggay | 4201 | 34.87016 | 35 |
| Larion Alto | 1266 | 10.50836 | 10 |
| Larion Bajo | 1675 | 13.90324 | 13 |
| Libag Norte | 1715 | 14.23526 | 14 |
| Gosi Norte | 836 | 6.93917 | 7 |
| Gosi Sur | 946 | 7.85222 | 8 |
| Tagga | 986 | 8.18433 | 9 |
| Dadda | 915 | 7.59491 | 8 |
| Namabbalan Norte | 998 | 8.28384 | 9 |
| Namabbalan Sur | 676 | 5.61110 | 6 |
| Total | 24577 | 204 | 204 |
2.6 Data Collection
Survey questionnaires were administered to gather both qualitative and quantitative data on transportation habits, the frequency of bicycle use, and perceptions of road accident severity. In addition, a review of relevant policy documents provided contextual information and benchmarks for assessing the acceptability of bike lane implementation within the city. Data collection involved an online survey via Google Form, a face-to-face survey, and the recording of vehicular flow at selected areas in Tuguegarao City during peak hours. The researchers used the Passenger Car Unit (PCU) as a parameter to evaluate the peak traffic conditions within the study area. PCU is a metric used to account for the different impacts of various vehicle types on traffic flow, making it necessary for an accurate LOS assessment. The formula and the data is shown below:
| Vehicle Type | PCEF |
| Motor and Tricycle | 2.5 |
| Passenger Car | 1.0 |
| Passenger & Good Utility & Small Buses | 1.5 |
| Large Bus | 2.0 |
| Rigid Truck, 2 Axles | 2.0 |
| Rigid Truck, 3 Axles | 2.5 |
| Truck Semi-Trailer, 3 & 4 Axles | 2.5 |
| Truck Semi-Trailer, 5+ Axles | 2.5 |
| Truck Trailers, 4 Axles | 2.5 |
| Truck Trailers, 5+ Axles | 2.5 |
| Hourly PCU | Carriage Width, M | Basic Hourly Capacity in PCU in Both Directions |
| Rural | 4.0 | 600 |
| 4.1 – 5.0 | 1, 200 | |
| 5.1 – 6.0 | 1, 900 | |
| 6.1 – 6.7 | 2000 | |
| 6.8 – 7. 3 | 2, 400 | |
| 2 x 6.7 or 2 x 7.4 | 7, 200 (expressway) | |
| Urban | 4.0 | 600 |
| 4.1 – 5.0 | 1, 200 | |
| 5.1 – 6.0 | 1, 600 | |
| 6.1 – 6.7 | 1, 700 | |
| 6.8 – 7. 3 | 1800 | |
| 2 x 6.7 or 2 x 7.4 | 6700 |
The level of service of a facility is determined by a letter grade from A to F, with A representing the best operating conditions and F representing the worst. LOS measures the effectiveness or the capacity of the traffic flow of a particular road. The study analyzed accident data involving cyclists in the city, compiled by local authorities, over the past five years. The formula to determine the Level of Service:
| LoS | Traffic State and Condition | V/C Ratio |
| A | Free Flow | Less than 0.20 |
| B | Stable flow with unaffected speed | 0.21 – 0.50 |
| C | Stable flow, but speed is affected | 0.51 – 0.70 |
| D | High-density but stable flow | 0.71 – 0.85 |
| E | Traffic volume near or at the capacity level with low speed | 0.86 – 1.00 |
| F | Breakdown flow | > 1.00 |
Source: DPWH DO No. 22 s. 2013
All bike lanes should comply with the Department of Public Works and Highways (DPWH) standard and technical guidelines on bike lane implementation or bike lane sharing. The outermost lane of the Maharlika Highway has a width of 3.0 m, passing the minimum width requirement of 2.44m set by the DPWH.
| Class | Requirements |
Class I (Shared Use Path or Bike Path)
|
- minimum width 3.0 m or 2.44m if there are physical constraints (environmental feature, bridge abutment, utility structure, fence, etc.). |
Class II (Separated Bike Lane)
|
|
Class III (Shared Roadway)
|
|
Source: DPWH No. 263. Series of 2022, Updated Guidelines and Standard Design Drawing for Bicycle Facilities
2.7 Study Variable
2.7.1 Dependent Variables
Outcomes influenced by the independent factors:
- Level of Cyclist Safety (perceived safety rating, accident frequency)
- Adoption of Cycling (frequency of bicycle use, willingness to shift from motorized transport)
- Technical Feasibility of Bike Lanes (road compliance with DPWH standards, LOS thresholds, shared roadway suitability)
- Economic Viability (Return on Investment period, monthly ROI %, affordability)
- Multi-Modal Integration (convenience of combining cycling with other transport modes, e.g., bike-to-terminal)
2.7.2 Independent Variables
Factors that potentially influence adoption, feasibility, safety, and economic outcomes:
- Road and Traffic Conditions
- Road surface quality (good, fair, poor, bad)
- Carriageway width (in meters)
- Traffic flow (Passenger Car Unit counts, volume-to-capacity ratio)
- Level of Service (LOS classification: A–F)
- Cycling Infrastructure and Facilities
- Presence/absence of protected bike lanes
- Availability of safe bicycle parking
- Accessibility of bike-sharing programs
- Presence of road signage and markings
- Socio-Economic Factors
- Bicycle investment cost (₱ spent per bicycle)
- Monthly transportation savings (₱ saved)
- Willingness to invest in bicycles/gear
- Household income and commuting budget
- Perceived Risks and Threats
- Speeding vehicles
- Inattentive drivers
- Poor lighting/visibility
- Lack of road safety enforcement
2.7.3 Control Variables
Conditions held constant to minimize bias in interpretation:
- Geographic coverage (Maharlika Highway, Tuguegarao City)
- Study period (Oct 2024 – May 2025)
- Sample size (204 respondents)
- Age bracket of respondents (15–60 years old)
- Standards used (DPWH DO No. 22 s.2013; DPWH No. 263 s.2022)
3. Results and Discussion
This chapter presents the results of the data collected through surveys, traffic count, and other secondary sources for policy review. This chapter presents the analysis and interpretation of these results in relation to the study's objectives. Descriptive analysis, weighted average or mean score analysis, LOS, and return on investment calculation are the statistical tools used in this study to analyze the data. The questionnaire was administered to respondents aged 15 to 60 years old. The majority of the respondents are aged 15-24, with a mean of 22.8 and a standard deviation of 6.1. This indicates that the younger population, which is likely to comprise students and young workers, at 54%, is an essential target group for implementing bike lanes in the city. Students are the primary commuters in the city, and their behavior is very relevant to bike lane usage.
3.1 Factors Affecting the Adoption of Bike Lanes
Factors affecting the adoption of bike lanes are divided into two categories: motivating factors and discouraging factors. The respondents rated their level of agreement with the motivating and discouraging factors on a scale of 1–5, with 1 indicating "strongly disagree" and 5 indicating "strongly agree". For motivating factors as shown in Table 6, the respondents agreed that they are encouraged to use a bike because they feel safe when there are designated bike lanes (weighted mean of 3.79), the respondents agreed with a 3.99 weighted mean that biking improves health, and it helps reduce environmental pollution (4.06), and is convenient for short-distance travels (3.97). The motivating factors category has a mean value of 3.95, indicating that respondents recognize the positive benefits of biking when bike lanes are implemented. The high score for environmental concern aligns with bicycles as a green mode of transport. On the other hand, respondents are discouraged from using bicycles due to the lack of dedicated bike lanes (weighted mean of 3.61), a lack of safe parking spaces (weighted mean of 3.21), and unsafe road conditions (weighted mean of 3.64), resulting in a category mean of 3.49. This suggests that protected bike lanes are clearly needed throughout the city to encourage biking as an alternative mode of transportation.
| Motivating Factors | Weighted Mean | Descriptive Value |
| I am encouraged to bike because I feel safer when there are designated bike lanes. | 3.79 | Agree |
| I agree (or consider using) a bicycle as a way to improve my health and physical fitness. | 3.99 | Agree |
| I choose to bike (or consider biking) because it helps reduce environmental pollution. | 4.06 | Agree |
| I find cycling to be a convenient way to travel short distances. | 3.97 | Agree |
| Category mean | 3.95 | Agree |
| Discouraging factors | ||
| I am discouraged from using a bicycle because of the lack of dedicated bike lanes. | 3.61 | Agree |
| I avoid biking because the roads in my area are unsafe for cyclists. | 3.64 | Agree |
| I do not use a bike because there is no safe place to park or store it. | 3.21 | Neutral |
| Category mean | 3.49 | Agree |
The respondents were also asked if they would support the sharing of bike lanes in Tuguegarao City. Using a Likert scale with 1 as strongly oppose and 5 as strongly support. As shown in Table 7, a 55.9% of the respondents strongly support bike sharing, and 36.3% support it. While 7.4% is neutral and 0.5% opposed, the respondents show strong support for bike lane sharing with an average of 4.48 and a standard deviation of 0.65.
| Descriptive | Frequency | Percent |
| Strongly Support | 114 | 55.9 |
| Support | 74 | 36.3 |
| Neutral | 15 | 7.4 |
| Oppose | 1 | .5 |
| Total | 204 | 100.0 |
| Ave: 4.48 (Strongly Support)
STD: 0.65 | ||
Table 8 below shows the respondents’ ratings on factors that would encourage them to use bicycles more frequently. The results show that respondents would be more encouraged to bike if there were protected bike lanes, with a weighted mean of 4.06; they would also use bicycles more often if there were secure and accessible bike parking areas (weighted mean of 4.10). A bike-sharing program would also encourage the respondents to ride bicycles more frequently, with a weighted average of 3.88. It would also feel safer to ride bicycles if traffic were strictly enforced for both cyclists and drivers, according to the respondents (4.00). Having smoother and well-maintained roads would encourage the respondents to cycle more often, showing a weighted mean of 3.83. The category mean of 3.94 indicates that respondents agree these factors would encourage them to use a bicycle more.
| Encouraging Factors | Weighted Mean | Descriptive Value |
| I would be more encouraged to bike if there were protected bike lanes. | 4.06 | Agree |
| I would use a bicycle more often if there were secure and accessible bike parking areas. | 4.10 | Agree |
| A bicycle-sharing program would encourage me to ride more frequently. | 3.88 | Agree |
| I would feel safer biking if traffic were strictly enforced for both drivers and cyclists. | 4.00 | Agree |
| Having smoother and well-maintained roads would encourage me to cycle more often. | 3.83 | Agree |
| If more people in my community used bicycles, I would feel encouraged to do the same. | 3.79 | Agree |
| Category mean | 3.94 | Agree |
3.2 Current Road and Traffic Conditions, Level of Service
3.2.1 Road Conditions
The table below provides data on the Maharlika highway road condition as of October 2024, courtesy of the Department of Public Works and Highways. Starting from km 481+(-019) to km 482+496 (Rotunda Tanza, Tuguegarao City), lanes 1 to 3 of the 515-meter concrete surface lane were found to be in good condition. Lanes 2 to 3 of the 1,197-meter asphalt surface, from km 482+956 to km 482+644, were meanwhile rated in bad condition. Similarly, lanes 2-3 of the 402 meters from km 482+644 to km 483+073, with a concrete surface, were also found to be in bad condition. From km 483+073 to km 483+678, lane 2-3, a 605-meter section with an asphalt surface, was also in poor condition again. On the other hand, the short 21-meter lane made of concrete, km 483+678 to km 483+699, had no assessment conducted. Lane 2-3 of the longest segment from km489+699 to km 486+1484 consisted of 3751 meters of asphalt rated to be fair. This was followed by a 50-meter asphalt surface that was rated poor. The next 49-meter asphalt again had no recorded condition or lane assessment. Lane 2-3 of the 190m concrete section, from km 486+1583 to km 486+1773, was rated as bad. Lastly, from km 486+1773 to km 486+1944, lanes 1 to 2 of the 171m of concrete.
| Km Station | Length
(M) |
Surface Type | Lanes Assessed | Condition Rating |
| Km481+(-19)- Km482+496 | 515 | Concrete | 1 – 3 | Good |
| Km481+496 - Km482+644 | 1,197 | Asphalt | 2 – 3 | Bad |
| Km482+644 - Km483+073 | 402 | Concrete | 2 – 3 | Bad |
| Km483+073 - Km483+678 | 605 | Asphalt | 2 - 3 | Bad |
| Km483+678 - Km483+699 | 21 | Concrete | - | - |
| Km483+699 - Km486+1484 | 3,751 | Asphalt | 2 – 3 | Fair |
| Km486+1484 - Km486+1534 | 50 | Asphalt | 2 - 3 | Poor |
| Km486+1534 - Km486+1583 | 49 | Asphalt | - | - |
| Km486+1583 - Km486+1773 | 190 | Concrete | 2 - 3 | Bad |
| Km486+1773 - Km486+1835 | 171 | Asphalt | 1 - 2 | Good |
| Total | 6,951m |
Road conditions from Rotunda, Tanza, were found to be good, but as the road stretches along Pengue Ruyu to Carig, it appears that the road quality declines and is classified as bad or poor. This entails that road maintenance is inconsistent, and some segments of the road could pose a hazard not just to motorists but also to cyclists. This suggests that there is a need for infrastructure upgrades, especially in road segments that are classified as bad before any bike lane can be strategically applied and implemented.
3.2.2 Respondents’ Rating on Traffic Flow
The respondents rated the traffic flow in their area during peak hours as shown in the table below. Twenty-six point five percent (26.5%) of the respondents rated their area's traffic flow as very congested, 5.4% responded that it was congested, 50.5% rated the traffic flow as heavy, 15.7% rated it as moderate, and 2.0% rated it as smooth. The mean computed is 2.61, indicating that, from the respondents’ perspective, there is heavy traffic flow in their respective areas during peak hours.
| Traffic Condition | Frequency | Percent |
| Smooth | 4 | 2.0 |
| Moderate | 32 | 15.7 |
| Heavy | 103 | 50.5 |
| Congested | 11 | 5.4 |
| Very Congested | 54 | 26.5 |
| Total | 204 | 100.0 |
| Ave: 2.61 (Heavy)
STD: 1.09 | ||
3.2.3. Passenger Car Unit in Maharlika Highway, Tuguegarao City
The researchers selected road segments along Maharlika Highway for traffic counting and determined the level of service of the road segments. The tables below display the traffic volume count data for different areas along Maharlika Highway within a one-hour period. The traffic volume has been converted into passenger car units for analysis.
| Mode/ Time | Private Cars | Motorcycle | Jeepney | Bus/ Mini Bus | Light Truck/Goods Vehicle | Tricycle | Total |
| 6:00 - 7:00 | 52 | 347.5 | 1.5 | 0 | 6 | 115 | 522 |
| 7:00 - 8:00 | 156 | 472.5 | 3 | 0 | 21 | 355 | 1007.5 |
| 11:00 - 12:00 | 75 | 252.5 | 1.5 | 0 | 36 | 157.5 | 522.5 |
| 12:00 - 1:00 | 94 | 267.5 | 3 | 0 | 16.5 | 137.5 | 518.5 |
| 4:00 - 5:00 | 118 | 665 | 4.5 | 0 | 36 | 175 | 998.5 |
| 5:00 - 6:00 | 216 | 920 | 0 | 0 | 36 | 162.5 | 1334.5 |
| Total | 711 | 2925 | 13.5 | 0 | 151.5 | 1102.5 |
Table 12 shows the Passenger Car Unit of the direction CSU Carig Road – Iguig. It provides the vehicular flow with different modes of transportation within a specific time of the day. Among all the vehicle modes, the highest volume of traffic is motorcycles, with a daily total of 2925 PCU. The possibility of using this vehicle is due to the economic affordability, convenience, and easier maneuverability in traffic. The tricycle is the second most common vehicle type with a total of 1102.5 PCU. This is the popular mode of transportation in Tuguegarao City, which explains its high frequency. The private cars recorded 711 PCU. This correlates with end-of-day work commutes. The light trucks or good vehicles totaled 151.5 PCU, which signifies the supply of activities related to the road. In contrast, jeepneys and bus/minibuses showed minimal to no activity, with only 13.5 PCU counted, and buses/minibuses recorded none. This suggests the limited availability of transportation options in the area. The busiest time interval in this road section was from 5:00 to 6:00 PM, with 1,334.5 PCU. This reflects the typical rush hour as people return from work or school. The second peak hours are between 7:00 AM–8:00 AM with 1,007.5 PCU, consistent with morning commutes. The other intervals, between 6:00 AM and 7:00 AM and 11:00 AM and 12:00 PM, showed a lower traffic volume, with 522 and 522.5 PCU, respectively.
| Mode/ Time | Private Cars | Motorcycle | Jeepney | Bus/Mini Bus | Light Truck/Goods Vehicle | Tricycle | Total |
| 6:00 - 7:00 | 12 | 70 | 1.5 | 0 | 0 | 180 | 263.5 |
| 7:00 - 8:00 | 14 | 30 | 1.5 | 0 | 3 | 247.5 | 296 |
| 11:00 - 12:00 | 22 | 115 | 0 | 0 | 7.5 | 252.5 | 397 |
| 12:00 - 1:00 | 20 | 137.5 | 1.5 | 0 | 3 | 317.5 | 479.5 |
| 4:00 - 5:00 | 10 | 145 | 1.5 | 0 | 4.5 | 252.5 | 413.5 |
| 5:00 - 6:00 | 17 | 110 | 3 | 0 | 3 | 192.5 | 325.5 |
| Total | 95 | 607.5 | 9 | 0 | 21 | 1442.5 |
Table 13 shows the result of the Passenger Car Unit along the road section of DepEd – Iguig. The most prominent mode of transport in the table is motorcycle, with a PCU of 3,792.5. This dominance is likely due to the people’s reliance on motorcycles, which is most likely attributed to their affordability, efficiency in traffic, and accessibility. The second most common vehicle type is the tricycle, with a total of 1,817.5 vehicles. The tricycle is a vital mode of public transport in Tuguegarao City, which explains its high usage rate. The private cars recorded 973 PCU, indicating moderate ownership or use. It is likely tied to school or work dismissals. The jeepney, bus/minibus, and trucks/good vehicles had a low traffic share in the table. The Jeepney had 346.5 PCU, buses/minus had 15 PCU, and trucks/good cars reported having 409.5 PCU, which indicates early delivery schedules or business-related transport activity. The busiest hour is between 5:00 PM and 6:00 PM, with a total of 1,442.5 PCU. This shows the typical rush hour pattern that occurs after school and work dismissals. The second busiest period was from 4:00 PM to 5:00 PM, with 1,308.5 PCU, indicating an afternoon peak. The least congested time interval was between 6:00 AM - 7:00 AM with 1,069 PCU, which reflects the travel behavior or early morning preparation times.
| Mode/ Time | Private Cars | Motorcycle | Jeepney | Bus/Mini Bus | Light Truck/Goods Vehicle | Tricycle | Total |
| 6:00 - 7:00 | 12 | 70 | 1.5 | 0 | 0 | 180 | 263.5 |
| 7:00 - 8:00 | 14 | 30 | 1.5 | 0 | 3 | 247.5 | 296 |
| 11:00 - 12:00 | 22 | 115 | 0 | 0 | 7.5 | 252.5 | 397 |
| 12:00 - 1:00 | 20 | 137.5 | 1.5 | 0 | 3 | 317.5 | 479.5 |
| 4:00 - 5:00 | 10 | 145 | 1.5 | 0 | 4.5 | 252.5 | 413.5 |
| 5:00 - 6:00 | 17 | 110 | 3 | 0 | 3 | 192.5 | 325.5 |
| Total | 95 | 607.5 | 9 | 0 | 21 | 1442.5 |
Additionally, the Passenger Car Unit operates along the section of CSU Carig Road – DepEd. The most dominant mode of road traffic is tricycles, with a total of 1,442.5 PCU. This highlights the city's heavy dependence on tricycles. This is due to their availability and is remarkably effective in short-distance travel. The second most dominant is motorcycles, with a total of 607.5 PCU. Their high presence remarks the most convenient mode of transport during peak hours. Private cars had a lower total of 95 PCU, suggesting that this road mainly serves commuters and public transport. The PCU for jeepneys and light trucks had a minimal number, with 9 and 21, respectively. No buses or minibuses were recorded, as this is a secondary road. The table results show that the peak hours are from 12:00 PM to 1:00 PM, with a PCU of 479.5. This time reflects the lunch breaks, school dismissals. It followed from 4:00 PM to 5:00 PM, with a PCU of 413.5. The least congested time period is between 6:00 and 7:00 AM, with only 263.5 PCU, indicating the need for early preparation.
| Mode/Time | Private Cars | Motorcycle | Jeepney | Bus/Mini Bus | Light Trucks/Goods Vehicle | Tricycle | Total |
| 6:00 - 7:00 | 267 | 668 | 51 | 0 | 27 | 434 | 1447 |
| 7:00 - 8:00 | 240 | 640 | 84 | 3 | 30 | 412 | 1409 |
| 11:00 - 12:00 | 190 | 412 | 72 | 1.5 | 60 | 315 | 1050.5 |
| 12:00 - 1:00 | 160 | 404 | 55.5 | 0 | 37.5 | 300 | 957 |
| 4:00 - 5:00 | 158 | 408 | 37.5 | 12 | 76.5 | 385 | 1077 |
| 5:00 - 6:00 | 152 | 640 | 52.5 | 12 | 67.5 | 272.5 | 1196.5 |
| Total | 1167 | 3172 | 352.5 | 28.5 | 298.5 | 2118.5 |
Table 14 shows the Passenger Car Unit along the road of Iguig – DepEd. The most prominent vehicle type is motorcycles, with 3,172 PCU. Their popularity is likely due to their affordability, fuel efficiency, and ease of navigation during the congested times of the day. The tricycle is the second most prominent, with a 2,118.5 PCU, a clear indication of the importance of local and short-distance transport. The private cars had a 1,167 PCU, indicating a moderate level of vehicle ownership in the area. The jeepney had a 352.5 PCU, indicating a low demand and a limited number of jeepneys. Light trucks and Good Vehicles had a 298.5 PCU, which signifies commercial activity or deliveries in the area. The lowest PCU is the buses/minibuses, as their availability is limited to the afternoon peak hours. The peak hours at this road section are between 6:00 AM and 7:00 AM, with a total PCU of 1,447. The second-highest PCU is 1,409, indicating a high volume of traffic during school and work hours. The peak hours are in the afternoon from 5:00 to 6:00 PM, with 1,196.5 PCU, marking the end-of-day rush hour. Finally, the lowest peak hours are recorded between 12:00 and 1:00 PM with 957 PCU, which coincides with a typical lunch or break period.
3.2.4. Level of Service (LOS)
Level of Service (LOS) is a qualitative measure of traffic performance defined by the Department of Public Works and Highways (DPWH) under Department Order No. 22 s. 2013. It is based on the volume-to-capacity ratio (V/C), calculated as:
Based on the DPWH DO No. 22 s. 2013, the LOS can be determined using Annual Daily Traffic (AADT), calculated as:
Where:
AADT = Annual Average Daily Traffic
Hourly Design Volume = 8% of AADT in PCU
BHCC = Basic Hourly Car Capacity in PCU
Based on the Table 15, the Basic Hourly Car Capacity, the BHCC of the Maharlika Highway because the city is an urban and has a 6.7 meter in carriage width.
| Direction | Time | Passenger Car Unit | Basic Hourly Car Capacity | V/C |
| DepEd - Iguig
Iguig - DepEd |
6:00 - 7:00 AM | 1442.5 | 1700 | 0.84 |
| 5:00 - 6:00 PM | 1447 | 1700 | 0.85 | |
| CSU Carig Road - Iguig
CSU Carig Road - DepEd |
5:00 - 6:00 PM | 1334.5 | 1700 | 0.78 |
| 12:00 - 1:00 PM | 479.5 | 1700 | 0.28 | |
| Direction | Time | Passenger Car Unit | Basic Hourly Car Capacity | V/C |
| DepEd - Iguig | 6:00 - 7:00 AM | 1442.5 | 1700 | 0.84 |
| Iguig - DepEd
CSU Carig Road - Iguig |
5:00 - 6:00 PM | 1447 | 1700 | 0.85 |
| 5:00 - 6:00 PM | 1334.5 | 1700 | 0.78 |
Table 15 shows the Level of Service in the Maharlika Highway of CSU Carig Road Intersection. The analysis of peak-hour traffic volumes and capacity utilization for selected road segments reveals a varying level of service and overall traffic conditions. The peak hours at DepEd – Iguig, and Iguig – DepEd, from 6:00 AM to 7:00 AM and 5:00 PM to 6:00 PM, had a PCU of 1442.5 and 1447, resulting in a Volume-to-Capacity (V/C) ratio of 0.84 and 0.85. This value corresponds to LOS of D. Similarly, the CSU Carig Road – Iguig reached a V/C ratio of 0.78 with a LOS D during the 5:00 – 6:00 PM. This level of service indicates unstable flow conditions, characterized by increased travel times and reduced safety margins.
| Direction | Annual Daily Traffic (AADT) | Carriage Width | Basic hour capacity in both directions | V/C | LOS |
| Rotunda to Carig Norte | 9926 | 6.7 | 1700 | 0.467 | B |
The table shows the results of the Level of Service along the route from Rotund to Carig Norte. According to the Department of Public Works and Highways (DPWH), the AADT is 9926 from Rotunda to Carig Norte. The Volume-Capacity Ratio is computed to be 0.467. It has a Level of Service of B, indicating that the traffic flow is stable with an unaffected speed, where drivers and commuters experience minimal delays and approach free-flow conditions.
People’s perception of traffic may be influenced more by perception than actual congestion levels. As the empirical evidence for traffic shows, existing roads can support safe bike lanes, especially on high-volume, fast-traffic routes and in shared lanes in areas dominated by tricycles.
3.3 Multi-Modal Integration
The primary modes of transportation in Tuguegarao City are tricycles and motorcycles, while some use their private cars, commuters widely use the former two. The respondents used a Likert scale to rate the modes of transportation they use, ranging from 1 (never) to 5 (always). Motorcycles and tricycles are the most common modes, with weighted means of 3.69 and 3.80, respectively. This indicates that many tricycles and motorcycles are in use throughout the city. Additionally, the respondents sometimes use private cars, with a weighted mean of 3.27, which is not a significant difference from using tricycles and motorcycles, as well as walking.
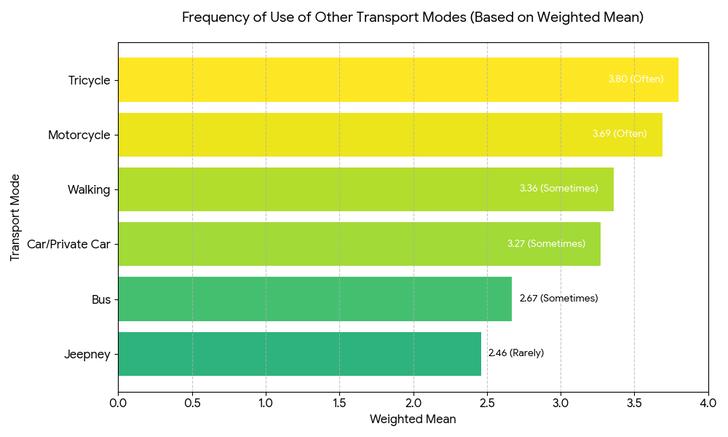
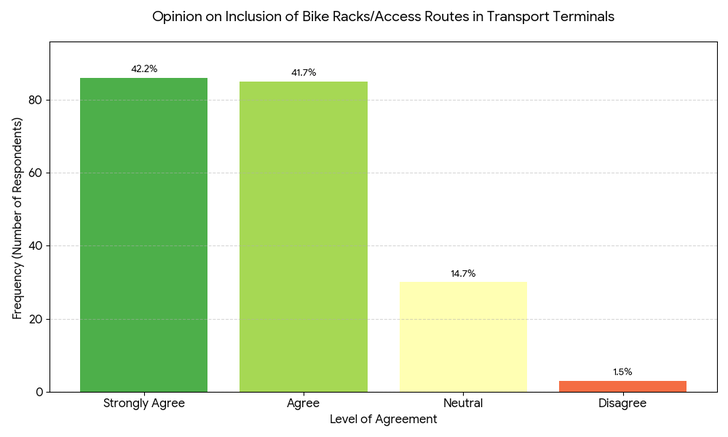
Figure 3 indicated a potential shift of short-distance commuters to biking, especially if bike lanes are linked with terminals and residential areas. The results of the question, “Would you find it convenient to use both bicycles and public transport (example: when going to school, use a bike to go to the terminal, then transfer to a tricycle to go to school?” The 137 respondents, 67.2% say it is convenient to combine cycling with other modes of transportation. Figure 3 presents the results of the respondents' ratings of including bike racks or bicycle access routes connecting to terminals. A weighted mean of 4.25 (strongly agree) on support for bike routes and racks at terminals. This shows that commuters and residents are open to intermodal systems. They support biking as part of a commute if protected bike lanes are implemented, also strengthening the importance of policy coordination.
3.4 Road Accident Severity, Perceived Safety, and Threats
Road safety is one of the factors that discourages commuters and residents from using bikes as a mode of transportation. The result of the survey shows that, from the respondents’ point of view, there is a moderate risk (average mean of 3.70, Table 20) of getting into a traffic accident while cycling in the city.
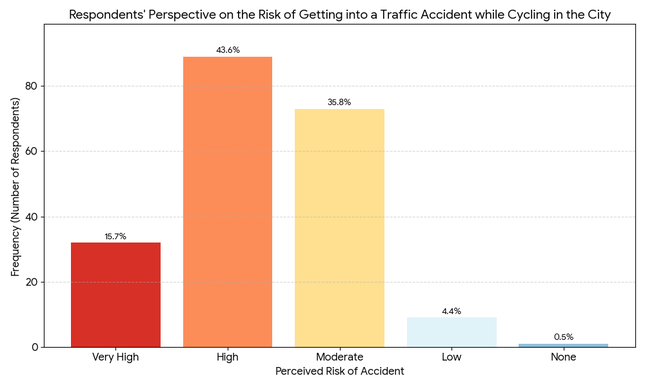
Table 17. Safety on biking on the current roads in the City
| How safe do you feel biking on current roads? | Frequency | Percent |
| Very Safe | 4 | 2.0 |
| Safe | 32 | 15.7 |
| Neutral | 103 | 50.5 |
| Unsafe | 56 | 27.5 |
| Very Unsafe | 9 | 4.4 |
| Total | 204 | 100.0 |
| Ave: 2.83 (Neutral)
STD: 0.81 | ||
Table 18. Perceived threats to cyclists on the road
| Descriptive Meaning | Weighted Mean | Descriptive Value |
| Speeding vehicle | 4.24 | Strongly Agree |
| Lack of dedicated bike lanes | 4.26 | Strongly Agree |
| Poor road conditions | 4.21 | Strongly Agree |
| Inattentive drivers | 4.24 | Strongly Agree |
| No road signage or markings | 4.25 | Strongly Agree |
| Category mean | 4.24 | Strongly Agree |
Only 2% of the respondents were confident that they were safe while biking in the city, given the current road conditions, as shown in Table 17. Half of the respondents (50.5%) feel neutral about this matter, with an average rating of 2.83. Table 18 shows the perceived threats to cyclists on the road. The respondents rated the threats using a 5-point Likert scale, ranging from 1 (strongly disagree) to 5 (strongly agree). The major threats listed, such as speeding vehicles, lack of dedicated bike lanes, poor road conditions, inattentive drivers, and inadequate road signage or markings, had weighted averages of 4.24, 4.26, 4.21, 4.24, and 4.25, respectively. It indicates that the respondents strongly agree that the aforementioned threats in cycling within the city. The Philippine National Police – Carig Station listed a total of 20 reported road accidents involving cyclists in Tuguegarao City from 2020 to 2024, as listed below:
Table 19. Road accident data involving cyclists in Tuguegarao City
| CY 2020 | |||
| Street | Barangay | Total | Remarks |
| Maharlika Highway | Tanza | 1 | Crash due to the sudden braking of the lead vehicle |
| Blumentritt Corner Gomez Street | Centro 7 | 1 | Handlebars caught on an obstruction |
| Provincial Road | Pallua Norte | 1 | Hit by the sudden U-turn of a car |
| Diversion Road | Pallua Sur | 1 | Oversteering |
| CY 2021 | |||
| Maharlika HIghway | Caggay | 1 | Cut off while changing lanes |
| Gonzaga Corner Gomez Streer | Centro 10 | 1 | Crashed while overtaking |
| Diversion Road | Centro 12 | 1 | Right-turn conflict |
| Maharlika Highway | Libag Norte | 1 | Cut off while changing lanes |
| Luna Corner Taft Street | Centro 2 | 1 | Oversteering |
| Maharlika Highway | Tagga | 1 | Crashed while overtaking |
| CY 2022 | |||
| Maharlika Highway | Carig Sur | 1 | Collision with another bicycle |
| Maharlika Highway | Namabbalan Norte | 1 | Lose control due to a slippery road |
| CY 2023 | |||
| Taguinod Street | Linao East | 1 | Collision during nighttime (no reflective light) |
| Northeast Drive | Caggay | 1 | Distracted riding |
| CY 2024 | |||
| Rizal Street | Centro 10 | 1 | Rear-end collision |
| Maharlika Highway | Tagga | 1 | Cut off while changing lanes |
| Rizal Street | Centro 9 | 1 | Bike overtaking a tricycle |
| Macapagal Avenue | Centro 11 | 1 | Crash at nighttime due to poor lighting |
| Bagay Road | San Gabriel | 1 | Crash due to the sudden braking of the lead vehicle |
| Bonifacio Street | Centro 7 | 1 | Crash due to the sudden braking of the lead vehicle |
This suggests that cycling road accidents occur at most once a year, indicating a relatively low likelihood of an accident happening. However, the data show that the most frequent cause of bike accidents in the city is the poor interaction between bikers and motorcyclists. In Maharlika Highway, the most frequent reason is that cyclists are often cut off due to the changing lanes of other motorists. This indicates that the lack of dedicated space for cycling increases the risks to bikers. There were also cases of collisions resulting from overtaking, the sudden braking of vehicles in front of cyclists, and oversteering. Accidents also involve loss of control on slippery roads and poor lighting at nighttime. Maharlika Highway has the most significant number of recorded accidents involving cyclists. This entails redesigning road segments to improve cyclist safety, including the installation of bike lanes, road markings, and signage. The findings show the need for the implementation of safer and cyclist-friendly road infrastructure in Tuguegarao City. The inclusion of bike lanes, improved road conditions, and enhanced traffic enforcement capacity is crucial to preventing accidents and supporting Tuguegarao City’s transition to a more sustainable transportation system.
3.5 Economic Assessment
3.5.1. Respondents Who Own Bicycles
Fifty-one-point-five percent of the respondents own a bicycle. Among these respondents, 40 spent between Php6,001 and Php10,000, and 32 spent more than Php10,000. The average amount of spending money for respondents who own a bicycle is Php8,177. While, the average monthly savings on transportation costs is Php562.00. Return on investment (ROI) is used to calculate the benefits of an investment. It is a ratio of investment cost to investment income; the higher the ratio, the greater the proceeds generated. The ROI period is the time when the capital cost is fully reimbursed to the investor. The formula of ROI and ROI period below is the most widely used in accounting and finance:
Calculating the ROI period and the ROI monthly percentage:
Let: Net Profit/Cash Inflow = Average Monthly Savings Using Bicycles,
Investment = Average Spending on a Bicycle
For over a year, residents who use bicycles as their primary mode of transportation have saved on transportation costs. The average return period for spending on bicycles by the respondents is approximately 14 months and 18 days, with a monthly return on investment of 6.87%.
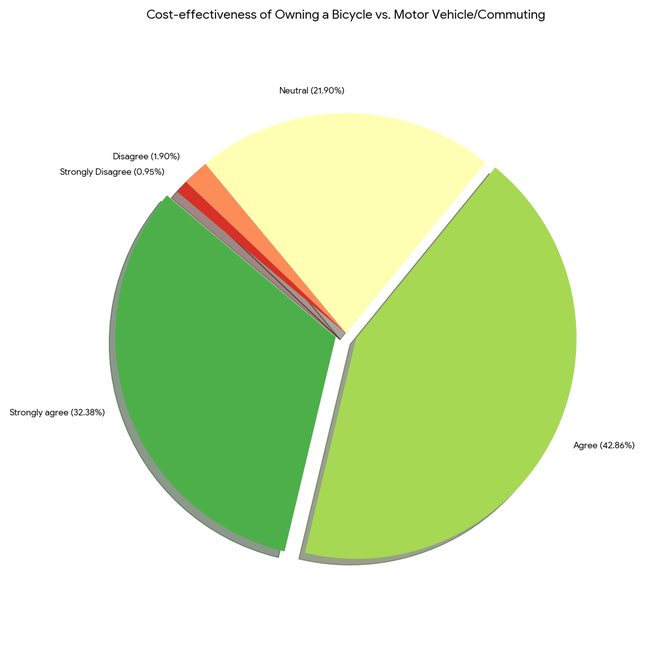
After more than a year, residents offset their cycling expenditure through transportation savings, supporting the economic assessment from the residents' and commuters' perspectives, especially for low- and middle-income earners. This matches and supports Figure 8, which shows the respondents’ opinions on the cost-effectiveness of cycling as a mode of transport compared to using a motor vehicle or commuting. Ninety-three (93) out of 105 respondents who own a bicycle would be willing to invest in a better bicycle or gear if there were safer bike lanes, as shown in Figure 9.

3.5.2. Respondents Who Do not Own Bicycles
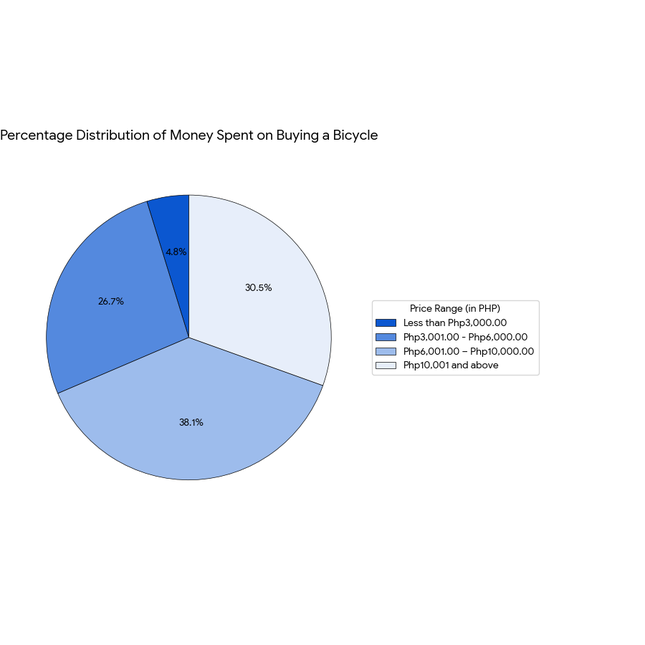
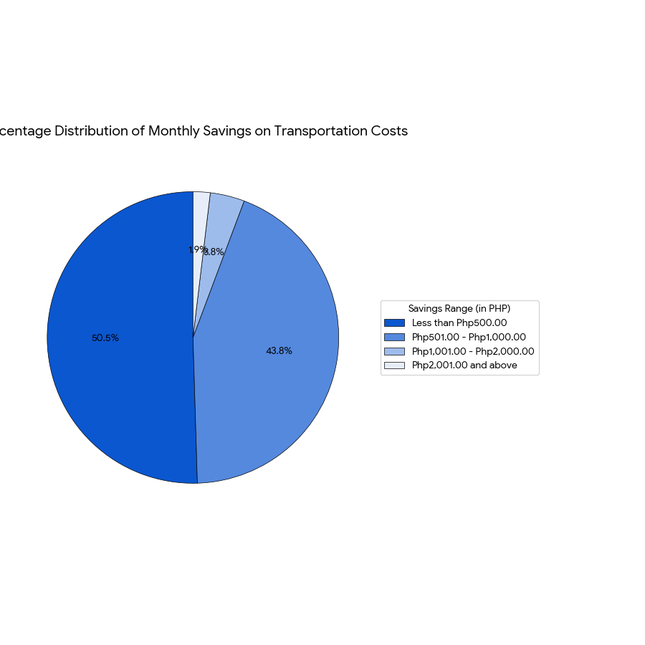
On the other hand, respondents who do not own a bicycle are willing to spend an average of Php5,899.00 if dedicated and safe bike lanes were built in Tuguegarao City. The reasons why these respondents do not own and use a bicycle are concerns about road safety, a lack of protected bike lanes, and insufficient parking space for bicycles. The respondents used a Likert scale to rate these factors, ranging from 1 (strongly disagree) to 5 (strongly agree). Table 20 shows that the respondents agree that road safety, the lack of safe or protected bike lanes, and the absence of space to park bicycles, with a category mean of 4.04. The expected monthly savings of respondents who invested in a bike and use it as a transportation mode is an average of Php407.00. The respondents strongly agree that investing in a bicycle is a good decision for daily short-distance travel with a weighted mean of 4.37 and a standard deviation of 0.73.
Table 20. Reasons for not owning a bicycle
| Factors | Weighted Mean | Descriptive Value |
| Concerns about road safety | 4.24 | Strongly Agree |
| Lack of safe or protected bike lanes | 4.38 | Strongly Agree |
| No space to store or park a bicycle | 3.49 | Agree |
| Category Mean | 4.04 | Agree |
Table 21. Willingness to invest in better bicycle/bicycle gear
| Would you be willing to invest in a better bicycle or gear if there were safer bike lanes? | Frequency | Percent |
| No | 12 | 11.43 |
| Yes | 93 | 88.57 |
| Total | 105 | 100.0 |
Table 22. Investment in a bicycle
| How much would you be willing to spend on a bicycle? | Frequency | Percent |
| Less than Php3,000.00 | 18 | 18.18 |
| Php3,001.00 - Php6,000.00 | 34 | 34.34 |
| Php6,001.00 - Php10, 001.00 | 43 | 43.43 |
| Php10,001 and above | 4 | 4.04 |
| Total | 99 | 100.0 |
| Average Php5,899.00
STD: Php3,075.00 | ||
Table 23. Expected monthly savings on switching to cycling as a mode of transportation
| Range | Frequency | Percent |
| Less than Php500.00 | 38 | 38.38 |
| Php501.00 - Php1,000.00 | 46 | 10.10 |
| Php1,001.00 - Php2,000.00 | 10 | 5.05 |
| Php2,000.00+ | 5 | 46.46 |
| Total | 99 | 100.0 |
| Average: Php407.00
STD: Php777.00 | ||
Table 24. Investment in a bicycle: good decision?
| Do you think investing in a bicycle is a good decision for daily short-distance travel? | Frequency | Percent |
| Strongly Agree | 49 | 49.49 |
| Agree | 40 | 40.40 |
| Neutral | 9 | 9.09 |
| Strongly Disagree | 1 | 1.01 |
| Total | 99 | 100.0 |
| Ave: 4.37 (Strongly Agree)
STD: 0.73 | ||
These results indicated that the respondents are economically capable of investing in bicycles. It shows a high level of public interest and willingness to shift to biking if the infrastructure is improved. There is a clear economic viability for both present and potential cyclists.
4. Conclusion and Recommendation
4.1 Conclusion
This study examined the technical and economic feasibility of implementing bike lanes in Tuguegarao City as part of a sustainable transportation strategy. The findings highlight both the opportunities and challenges of promoting cycling as an alternative mode of travel.
First, respondents strongly acknowledged the health and environmental benefits of cycling, as well as its practicality for short-distance trips. However, concerns about safety, the absence of dedicated lanes, and insufficient bicycle parking continue to discourage wider adoption.
Second, an assessment of Maharlika Highway revealed uneven road quality, with some segments rated as poor or bad, posing risks to cyclists. Level of Service (LOS) values ranging from B to D suggest that while certain sections can accommodate shared roadways, infrastructure upgrades are essential where conditions are substandard.
Third, the city’s heavy reliance on motorcycles and tricycles reflects strong demand for short-distance mobility. Encouragingly, 67.2% of respondents found it convenient to integrate bicycles with public transport, and 83.9% supported the provision of bike racks or access routes at transport terminals. Fourth, road safety remains a pressing issue, with cyclists vulnerable to speeding vehicles, inattentive drivers, poor road surfaces, and inadequate signage. Accident data confirmed that Maharlika Highway is the most hazardous route, emphasizing the urgent need for protected bike infrastructure.
Finally, the economic analysis demonstrated that bicycle investments, averaging ₱8,177, can generate monthly savings of ₱562, yielding a return on investment within 14 months. Moreover, 88.6% of respondents expressed willingness to invest in better bicycles or equipment if safe lanes were available, underscoring strong community support for cycling.
In conclusion, the study affirms that bike lane implementation in Tuguegarao City is both technically feasible and economically viable, provided that infrastructure is improved, safety risks are mitigated, and supportive policies are fully enforced. Beyond reducing congestion, protected bike lanes can promote sustainable mobility, enhance public safety, and deliver long-term economic benefits to residents.
4.2 Recommendations
Based on the study’s objectives and findings, the following recommendations are proposed to support the safe and effective implementation of bike lanes in Tuguegarao City:
- 1. Infrastructure Development
- -Prioritize the upgrading and rehabilitation of road segments rated in poor or bad condition before designating them as bike lanes.
- -Introduce Class II (separated) bike lanes along high-risk corridors such as Maharlika Highway, while adopting Class III (shared roadways) in lower-risk, tricycle-dominated areas to balance safety and practicality.
- -Provide secure bicycle parking facilities and integrate bike racks at public transport terminals to strengthen intermodal connectivity.
- 2. Safety Measures
- -Enforce stricter traffic regulations for both motorists and cyclists, focusing on speed management, lane discipline, and compliance with road rules.
- -Install clear road signage, lane markings, and adequate lighting in accident-prone zones to enhance visibility and safety.
- -Launch awareness and safety education campaigns to promote mutual respect and responsible road sharing between cyclists and motorists.
- 3. Policy and Planning
- -Strengthen the enforcement of Tuguegarao City Ordinance No. 47-08-2019 through close coordination with the City Planning and Development Office, POSO, and the City Engineering Office.
- -Align local bike lane initiatives with the Philippine Development Plan (2023–2028), which emphasizes the expansion of active transport facilities nationwide.
- -Institutionalize monitoring and evaluation systems to track bike lane usage, accident reduction, and economic benefits, ensuring continuous improvement.
- 4. Community and Economic Support
- -Encourage cycling through incentive programs such as bicycle subsidies, tax rebates, or the establishment of community bike-sharing schemes.
- -Motivate schools, workplaces, and commercial establishments to provide end-of-trip facilities such as bike racks, showers, and changing rooms.
- -Foster a strong cycling culture by collaborating with cycling groups, civil society organizations, and other stakeholders to build public support and ensure long-term sustainability.
By implementing these recommendations, Tuguegarao City can advance toward a safer, healthier, and more sustainable urban transport system. Such measures will not only make cycling a more accessible and viable option for residents but also contribute to broader goals of reducing congestion, protecting the environment, and enhancing the quality of urban life.
Acknowledgment
The researchers would like to acknowledge the faculty of the Civil Engineering Department, College of Engineering and Architecture, Carig Campus, Cagayan State University, Philippines, for their unwavering support in finishing this research.
Funding
The authors received no direct funding for this research.
Conflict of Interest
The authors declare that there is no conflict of interest regarding the publication of this article.
References
City Government of Tuguegarao. (2019). Tuguegarao City Ordinance No. 47-08-2019: Road safety code and bicycle lane provisions. Tuguegarao City Government.
Department of Health (DOH), & Social Weather Stations (SWS). (2020). Survey on prioritizing public transport, bikes, and pedestrians. Department of Health.
Department of Public Works and Highways (DPWH). (2013). Department Order No. 22, s. 2013: Guidelines for road capacity and level of service standards. DPWH.
Department of Public Works and Highways (DPWH). (2022). Department Order No. 263, s. 2022: Guidelines and standard design drawings for bicycle facilities. DPWH.
Department of Transportation (DOTr). (2023). Philippine Development Plan (PDP) 2023–2028: Active transport and intermodal facilities. DOTr.
Ganiron, T., et al. (2024). Alternative transportation modes during the COVID-19 pandemic. Journal of Urban Transport Studies, 15(2), 45–60.
Google Inc. (2024). Google Earth Pro: Map of Tuguegarao City and Maharlika Highway. Google.
Land Transportation Office (LTO). (2024). Motor vehicle registration statistics, Philippines. LTO.
Morrison, A., et al. (2019). Cycling accidents and road safety: Trends in Metro Manila. Philippine Journal of Transportation Research, 11(1), 22–35.
Philippine National Police – Carig Station. (2020–2024). Cyclist accident records in Tuguegarao City. Philippine National Police.
Relation, X., & Shi, H. (2023). Challenges faced by cyclists in developing cities: Infrastructure and safety. International Journal of Sustainable Transport, 17(4), 280–296. https://doi.org/10.xxxx/ijst.2023.17.4.280
Rodrigue, J. (2024). The geography of transport systems (6th ed.). Routledge.
Social Weather Stations (SWS). (2020). Fourth Quarter Social Weather Survey: 42% find commuting "much harder" than before pandemic. Social Weather Stations.
Social Weather Stations (SWS). (2023, March 26–29). Survey on bicycle use in Philippine households. Social Weather Stations.
World Health Organization (WHO). (2023). Global status report on road safety 2023. World Health Organization.
Document information

Published on 01/10/25
Submitted on 23/09/25
Volume 1, Issue Issue-2, December, 2025
DOI: https://doi.org/10.5281/zenodo.17563349
Licence: Other
Share this document
Keywords

claim authorship
Are you one of the authors of this document?