Abstract
China has achieved a political consensus around the need to transform the path of economic growth toward one that lowers carbon intensity and ultimately leads to reductions in carbon emissions, but there remain different views on pathways that could achieve such a transformation. The essential question is whether radical or incremental reforms are required in the coming decades. This study explores relevant pathways in China beyond 2020, particularly modeling the major target choices of carbon emission peaking in China around 2030 as China-US Joint Announcement by an integrated assessment model for climate change IAMC based on carbon factor theory. Here scenarios DGS-2020, LGS2025, LBS-2030 and DBS-2040 derived from the historical pathways of developed countries are developed to access the comprehensive impacts on the economy, energy and climate security for the greener development in China. The findings suggest that the period of 2025–2030 is the window of opportunity to achieve a peak in carbon emissions at a level below 12 Gt CO2 and 8.5 t per capita by reasonable trade-offs from economy growth, annually −0.2% in average and cumulatively −3% deviation to BAU in 2030. The oil and natural gas import dependence will exceed 70% and 45% respectively while the non-fossil energy and electricity share will rise to above 20% and 45%. Meantime, the electrification level in end use sectors will increase substantially and the electricity energy ratio approaching 50%, the labor and capital productivity should be double in improvements and the carbon intensity drop by 65% by 2030 compared to the 2005 level, and the cumulative emission reductions are estimated to be more than 20 Gt CO2 in 2015–2030.
Keywords
Emission peaking ; Energy cap ; Integrated assessment
1. Introduction
The transition to green social-economic development so called Ecological Progress in China is currently booming due to the domestic resources, environmental constraints and global climate change issues. Achieving a peak in CO2 and other greenhouse gas emissions is under heated debates as the next policy option for China to create a forcing mechanism of economic transformation and environmental governance. It is obviously a tough task for China to achieve an emissions peak soon, and the challenges mainly result from the trade-offs between the major issues such as the economy, energy and climate security. China recently announced new targets to peak CO2 emissions around 2030, with the intention trying to peak early, and to increase the non-fossil fuel share of all energy to around 20% by 2030 in China-U.S. Joint Announcement. The coming decades are still a crucial stage in Chinas development, and how to achieve a low-carbon transformation smoothly and avoid additional excessive adverse impacts on the social and economic development has become the most important prerequisite for decision makers in China. After all, China also worries about taking radical mitigation actions that could make the economic growth suffer a hard landing, with the economic recession and social unrest.
Most research indicates that the international community should cooperate to achieve a peak in greenhouse gas emissions as soon as possible, such as around 2020, to hold the increase in global mean temperature below 2 °C above preindustrial levels (IPCC, 2007 , He and Chai, 2008 , PBL, 2009 and Guivarch and Hallegatte, 2013 ). The increase in emissions will mostly derive from developing countries, and therefore, emerging economies that are big emitters would have to play an important role in driving the global emissions peak timeframe (Blanford et al., 2012 , UNEP, 2012 and Govindaraju and Tang, 2013 ). A peak in global emissions won't be reached if Chinas emissions do not peak. The scarce carbon emission space will become one of the most important constraints for developing countries during their modernization process, especially for big emitters like China, which would have to bear a disproportionate or abnormal burden, and pay the extra efforts and expenses only if the developed countries take the lead and fulfill their historical responsibilities (van Ruijven et al., 2012 and Chai and He, 2013 ).
Various modeling and scenario analysis have studied the long term energy consumptions and carbon emissions in China by sectors (Wang et al., 2007 , Cai et al., 2007 , Dai et al., 2012 , Zhou et al., 2012 , Zhou et al., 2013a , Zhou et al., 2013b and Mao et al., 2012 ) or hybrid perspectives (van Vuuren et al., 2003 , CEACER, 2009 , Qu and Guo, 2010 , Wang and Watson, 2010 , CAE, 2011 , Han and Yang, 2012 , Zhou et al., 2013a , Zhou et al., 2013b and Gambhir et al., 2013 ), and these studies have provided insights into the potentials, costs and policies in energy systems but little description on the typical energy and emissions peaking issues, systematic risks and the interactions with overall economy reform. China is currently facing various social and environmental problems, and the solutions require new vision and ideas. The question whether economic transformation and decarbonization will process as radical or incremental reforms need robust studies and practical demonstrations. The policies, actions and their implications by 2020 have been more explicit and less uncertain through massive researches and discussions (Meng et al., 2012 , Chai and Zhang, 2012 , Yu and Qu, 2013 and Lu et al., 2013 ). This study will focus on Chinas development pathways and emission regulation targets beyond 2020, particularly on how and at what levels China could achieve the emissions peak around 2030, and what the trade-offs accompany an earlier transition. The next section will critically review the peaking issues and development pathways in industrialized countries and also the current stage of development and circumstances in China to shape the feasible ranges and provide the strategic positioning for China. Then four transformation and emission pathway scenarios will be developed, and the related contexts of the peaking timeframe will be carefully examined to finally propose comprehensive policy recommendations for the Intended Nationally Determined Contribution.
2. Rethinking development and emission pathways in China
China is already the largest energy consumer and greenhouse gas emitter and is expected to be the largest economy by 2030, and that makes Chinas development and emission pathways extremely influential to the world. Due to the late dominant position, China has experienced rapid economic growth during the past three decades, which has brought a variety of problems, particularly that of heavy environmental pollution. Actually, China has not avoided the traditional pathways already taken by developed countries to achieve the so-called leapfrog development as officials and experts have claimed since the 1980s.
2.1. Economic transformation and multi-targeting
According to the national long-term development strategy, called the Two Centenary Goals, China is expected to essentially accomplish industrialization and build a moderately prosperous society by 2021, and become a prosperous, strong, democratic, culturally advanced and harmonious modern country (with an economic level similar to moderately developed countries) by 2049. This means that the goals of development in China will become diversified after passing through the initial accumulation stage of economic development. On one hand, China is now crossing the Lewis Turning Point and Middle Income Trap, while the unbalanced, uncoordinated and unsustainable development remains a big problem in the existing growth mode, and future economic development planning requires new vitality, direction and drivers after the rapid industrialization and urbanization in the last 30 years. On the other hand, China is now inevitably repeating the mistakes once made by industrialized countries, typically related to environmental pollution of air, water and soil, and several public hazard incidents in recent years have spurred the decision makers to seriously consider the quality of development and the issue of environmental protection. To the Chinese people, the modern China in the mid-21st century means not only a series of high but cold numbers like strong GDP, but also the green, low-carbon and environmental factors that are also fundamentally essential in the realization of modernity. As the economy keeps growing, these factors will gradually rise to the forefront for social value system and institutional innovation.
Low carbon energy development will be the primary area in which to promote the ecological, environment and climate protection in a concerted manner. The long term coal-dominated energy strategy in China has produced systemic problems including environmental degradation and the fact that energy production, transportation and chemical industry all have been built on coal resources, resulting in low efficiency, high pollution and emission patterns and the lock-in effect. This situation has also hampered energy revolution and technological progress, and the environmental costs were not effectively translated into the marketplace. The long-standing issues of chronic illness and inertia of energy development in China will be likely to have new breakthroughs by real decarbonlization, which also bring co-benefits for energy security. Comprehensive national strength and potential usually comes from technological and institutional innovation, low carbon development will greatly motivate future production, consumption and lifestyles change, and bring opportunities for industrial, commercial and community transformation. Such development and reform will also make China more involved in global climate change governance and able to take the proportionate responsibilities.
2.2. Forcing mechanism and multi-staging
The market alone has failed to push forward ecological progress and green development, so the government is required to stimulate and regulate those processes by appropriate planning. Current high carbon infrastructure stocks, technological pathways, consumption behaviors and entrenched interests have effects of the lock-in and path-dependence that are occurring. The economy will face enormous difficulties and costs if it does not make adjustments soon. Meanwhile, if the government does not take timely measures for effective governance related to the increasingly serious environmental pollution in China, immeasurable losses in human capital and health will be borne by the country. The international community also can't continue to allow such large growth in emissions. These reasons urge decision makers to reflect on the development in recent decades, which has produced intensity improvements yet overall deteriorations. Increased attention and discussion are turning to the energy consumption and emission caps as the policy options, which is called forcing mechanisms. One of the most controversial topics is the turning point issue, namely when China can reach an emissions peak.
There are different emission pathways for China, such as growing quickly to an early but high peak as soon as possible, which would be followed by a deep cut, or growing slowly with progressive control to a later but lower peak, which would be followed a moderate decline. However due to the lock-in and path-dependence effects mentioned above, the former fast mode may lead to far more economic shock. Therefore, progressive and incremental mitigation efforts seem more viable for developing countries as it is expected that they will make the transitions smoother. The more rational emission control policies predominate in the debates, which mean achieving the emission peaking stage by stage, sector by sector and region by region, because of the common view that the current circumstance is usually insurmountable. The targets are also planned to evolve step by step from an intensity reduction to cap control and then to absolute emissions declines. The first phase mainly aims at the emissions growth from industrialization and production, and the second phase focuses on regulating the emissions growth from urbanization and consumption. The ability to reach an emissions peak depends on the superposition of these two phases. Further questions are how long each phase will take, at what level emissions will be, and how economic and energy systems will make corresponding adjustments. Such questions can be partially answered by the historical cases of industrialized countries.
2.3. Emission peaking in industrialized countries
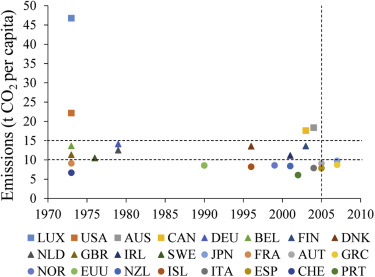
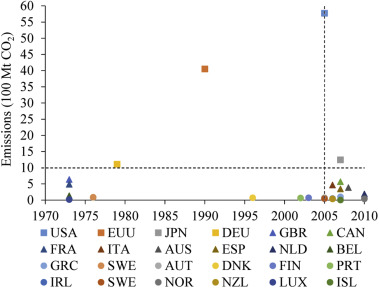
The historical cases of emissions peaks and the contexts in industrialized countries have referential significance for developing countries. In 1992 Article 4.2 (a) in the UNFCCC requires that developed countries should be “taking the lead in modifying longer-term trends in anthropogenic emissions consistent with the objective of the Convention, recognizing that the return by the end of the present decade to earlier levels of anthropogenic emissions of carbon dioxide and other greenhouse gases not controlled by the Montreal Protocol would contribute to such modification”, and indicated that those countries should achieve an emissions peak by 2000 and return to the level of 1990. However several countries have not yet succeeded in this. Taking into account the peculiarities of economies in transition and data reliability, only the industrialized countries in Annex II of the UNFCCC and their CO2 emissions from fuel combustions were taken here for comparisons with the available consistent data sets (IEA, 2012 ). To develop representative patterns, the 24 industrialized countries can be divided into three groups as follows (Fig. 1 and Fig. 2 ).
- Red Label Countries (4/24), such as the U.S., Canada and Australia. The per capita CO2 emissions in these countries usually stay high at over 15 tons, and approximately 3/4 of these countries have reached emission peaking after 2005; their peaks are deemed unstable yet.
- Yellow Label Countries (8/24), such as Germany, the United Kingdom and Belgium, all of which are from Europe. The per capita CO2 emissions in those countries have been above 10 tons but now are usually lower, and approximately 3/4 of these countries have reached emission peaking naturally in the 1970s, long before the effects of global climate policy interference; their peaks have been identified as stable and sustainable.
- Blue Label Countries (12/24), such as Japan, Italy and Spain. The per capita CO2 emissions in those countries usually stay below 10 tons, and approximately 3/4 of these countries have reached an emissions peak after 2005; their peaks are deemed unstable as well.
|
|
|
Fig. 1. Per capita emission peaking in industrialized countries (Ranking from the highest peaking level to the lowest, only including the CO2 from fuel combustions, data source: IEA (2012) ). |
|
|
|
Fig. 2. Total emission peaking in industrialized countries (Ranking from the highest peaking level to the lowest, only including the CO2 from fuel combustions, data source: IEA (2012) ). |
The peaks of CO2 emissions from fuel combustions in industrialized countries first came in 1973, and thereafter, six countries reached total emissions peaks and nine countries reached per capita emissions peaks by 1990. These are considered Naturally Peaking Countries because they occurred before the Convention. Additionally, peaking before 2005 can be defined as Stable Peaking, and peaking after 2005 may be interpreted as fluctuations due to economic crisis issues as they were in the 1930s and 1970s, so these countries must still be observed over a longer time. Based on this understanding, Austria, Spain, Greece, and Japan have not yet reached a stable per capita emissions peak, and Austria, Switzerland, the U.S., Ireland, Italy, New Zealand, Canada, Greece, Iceland, Japan, Spain and Australia have not yet reached a stable total emissions peak, while the emissions in the Netherlands and Norway are still growing. Whether the emissions peak is reached naturally or by policy interference, there are no cases of peaks below 6 tons per capita of CO2 emissions from fuel combustions, and large differences in per capita numbers between countries are often due to different circumstances.
The energy consumption peaks were usually later than the emissions peaks, and most occur after 2000. But two countries reached a total primary energy consumption peak and five countries reached a per capita energy consumption peak by 1990. In those industrialized countries, seven countries have not yet reached a stable per capita energy consumption peak, whereas three countries are still growing, and twelve countries and the EU as a whole have not yet reached a stable total primary energy consumption peak, whereas five countries are still growing. Simultaneously, thirteen countries and the EU as a whole have reached a total primary energy consumption peak below 5 toe per capita, and eight countries have reached a peak below 4 toe per capita.
The electricity consumption peaks were definitely later than the emissions peaks, and were also later than the energy peaks too; only Denmark reached its peak before 2000. In these industrialized countries, nine countries and the EU as a whole have not yet reached a stable per capita electricity consumption peak, whereas five countries are still growing, and ten countries and the EU as a whole have not yet reached a stable total electricity consumption peak, whereas seven countries are still growing. Simultaneously, five countries and the EU as a whole have reached a peak below 7 MWh per capita, and two countries have reached a peak below 6 MWh per capita.
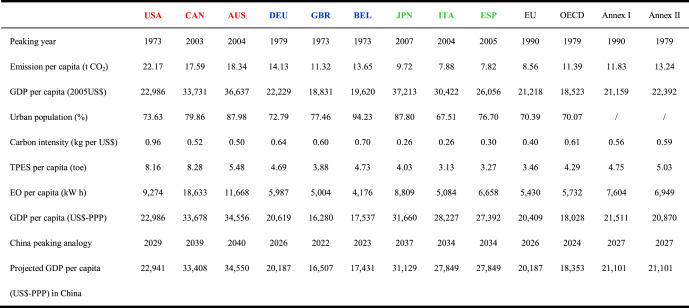
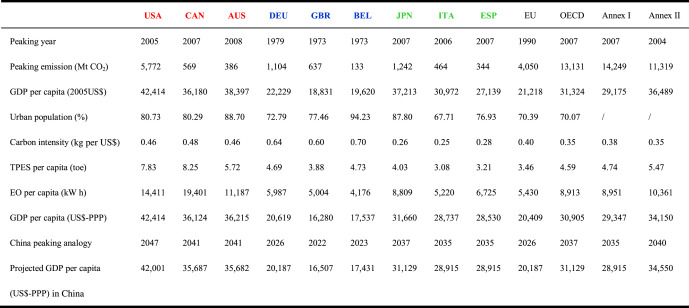
In the three labeled groups and the nine typical cases of industrialized countries (Table 1 and Table 2 ), the GDP per capita in most countries have been over US$20,000 (constant price of 2005) since they reached the peak, among which the GDP in four countries have been over US$30,000 since they reached the per capita emissions peak, and the GDP in five countries have been over US$30,000 since they reached a total emission peak, especially the GDP in the U.S. then have been over US$40,000. Most countries have completed their industrialization and urbanization before they reached the peak, and the urbanization rates have exceeded 70% in most countries.
|
|
|
Table 1. The context of per capita emission peaking in typical countries and regions (IEA, 2012 , WB, 2013 and OECD, 2012 ). |
|
|
|
Table 2. The context of total emission peaking in typical countries and regions (IEA, 2012 , WB, 2013 and OECD, 2012 ). |
Here, we take the level of economic development as the benchmark, according to the OECDs projection to 2060 (PPP based) (OECD, 2012 and Johansson et al., 2013 ), if China goes as Red Label Countries, then the emissions will peak around 2040; if China goes as Yellow Label Countries, then the emissions will peak by 2025; and if China goes as Blue Label Countries, then the emissions will peak around 2035. Although the peaking time in the Blue Label model will be later than in the Yellow Label model, the peak level will be lower, which is a trade-off. Obviously, the Red Label model should be avoided in developing countries, and if a big emerging economy like China can combine the Yellow Label and Blue Label models into a Green Label model, by taking advantages of late development and technological change spillovers, it might help produce a lower peaking level than in Yellow Label Countries and an earlier peaking time than in Blue Label Countries, that will be definitely kind of progress and contributions to the international community.
3. Scenarios of the energy and emissions peak in China
According to analysis of the domestic development transition and historical peaks in industrialized countries, here we developed a Business-as-usual (BAU) scenario and four peaking pathway scenarios based on the integrated assessment model for climate change (IAMC) to quantitatively evaluate the contexts of the energy consumption and emissions peaks.
3.1. The integrated assessment methodology for peaking issues
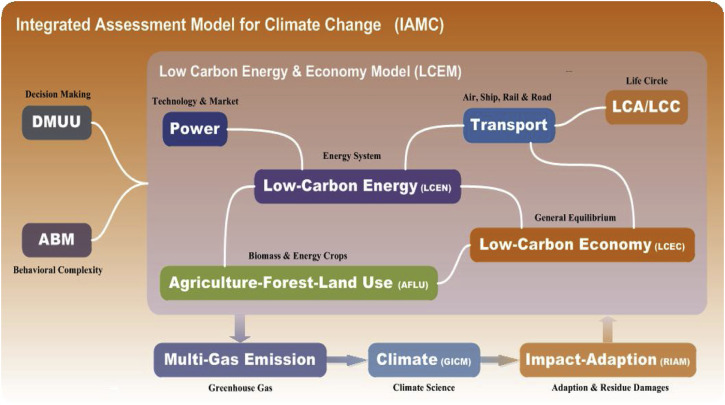
The IAMC is a dynamic hybrid model system that consists of five sub-models including economy, energy, agriculture and land use, climate, impacts and adaptation, as the comprehensive framework to describe the interaction of human and natural systems, especially the complex relationship between economy, energy and climate change (Fig. 3 ) (Chai, 2010 , Chai and Zhang, 2010 and Chai and He, 2013 ).
|
|
|
Fig. 3. Integrated assessment model for climate change (Chai, 2010 , Chai and Zhang, 2010 and Chai and He, 2013 ). |
In order to better study the interaction of climate and economy, the IAMC has involved a new scarce factor of production which is carbon assets and a new expenditure for climate change which cover the cost from mitigation, adaptation and residual damage into the economic module with inter-temporal optimization of social welfare, and the core functions as follows.
|
|
( 1) |
|
|
( 2) |
The IAMC uses multi-level nested constant elasticity of substitution (CES) functions. The primary nested Equation (1) means that the total output Y is the CES function of value-added inputs VA and carbon asset inputs CE , and the secondary nested Equation (2) means that the value-added inputs VA is the CES function of capital inputs K and labor inputs L . Here, α , β and γ are the share parameters, and 0 <α , β , γ < 1. The ac indicates the impacts of climate change on the factor productivities, and ak , al and ace indicate technological change parameters of production factors, namely non-price-induced technological change. The index ρ and ρva are related with the elasticity of substitution.
The integrated assessment and the scenario design of Chinas emission peaking implicates the vision and anticipation of future development pathways. The major driving forces are economic growth, industrial structure and technological change and their underlying policy objectives, and the assumptions used are as follows.
In the Deep Green Scenarios (DGS-2020) , the processes of global climate governance and low carbon industrialization are far beyond general expectation, and China successfully and rapidly achieves a green transformation, emissions-intensive production and consumption are well controlled and regulated, the total primary energy stays at a low level, the technological change in energy efficiency and non-fossil fuel conversion makes large advances, carbon capture gradually becomes deployed, and carbon emissions are expected to achieve the stable peaking around 2020.
In the Light Green Scenarios (LGS-2025) , global low carbon industries and technologies develop well, and the green transformation in China takes time to catch up, with economic restructure proceeding more slowly because of the inertia in the present industrialization and urbanization pattern, the total energy consumptions is still growing, the contribution from clean and low carbon energy is limited by resources and technologies although the increments are still substantial, and carbon emissions are expected to achieve a stable peak around 2025.
In the Light Blue Scenarios (LBS-2030) , the low carbon transition progressively unfolds across the world, and developing countries can't surmount the development gaps, the household sector growth and the industrial sector restructuring in China occur over a long period of time, the adjustment in energy mix can't follow the fast growing energy consumption accordingly, although the energy efficiency and low carbon technologies are widely applied, and carbon emissions are expected to achieve a stable peak around 2030.
In the Deep Blue Scenarios (DBS-2040) , global low carbon development does not make breakthroughs in the coming decades, the growth pattern transformation in China encounters difficulties, a larger emissions space is required to make the economic transition smoothly, although the major growth in energy consumption and carbon emissions still happens by 2030, followed by a long plateau, during which carbon capture technology will be more widely applied, and carbon emissions are expected to achieve a stable peak around 2040.
For comparison, this study also examines the BAU scenario, which assumes the continuation of relatively stable and conservative policy objectives and technological progress trends since 2005. The population and economic growth data are based primarily on the United Nations Department of Economic and Social Affairs' forecasts (UNDESA, 2011 ) and the Organization for Economic Co-operation and Development' forecasts (OECD, 2012 ), respectively (Table 3 ).
| 2020 | 2025 | 2030 | 2035 | 2040 | 2045 | 2050 | |
|---|---|---|---|---|---|---|---|
| Population (100 Million) | 13.9 | 14.0 | 13.9 | 13.8 | 13.6 | 13.3 | 13.0 |
| GDP (compared to 2005, %) | 379.4 | 501.4 | 620.3 | 745.0 | 876.8 | 993.3 | 1084.1 |
| Potential annual growth in each Five-Year-Plan (%) | / | 5.7 | 4.3 | 3.7 | 3.3 | 2.5 | 1.8 |
| Peaking year | DGS-2020 | LGS-2025 | LBS-2030 | / | DBS-2040 | / | / |
3.2. The overall scenario analysis for peaking issues
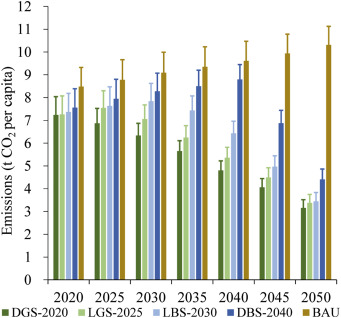
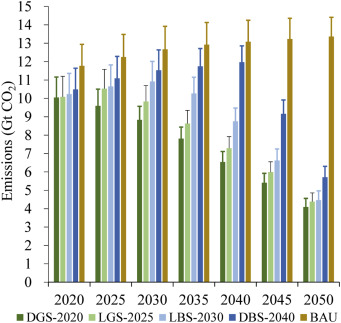
Emissions levels in four peaking scenarios are illustrated in Fig. 4 and Fig. 5 , where the columns and the line ends denote the CO2 emissions from fuel combustions and industrial process, respectively. Because population growth in the future will be much slower than emissions growth, Chinas total and per capita carbon emissions appear to peak simultaneously, unlike the situation for the total peaks in industrialized countries, which were frequently later than the per capita peaks. In the four peaking scenarios, the per capita emissions stay within the range of 7–9 t CO2 , apparently lower than in the Red and Yellow Label Countries, while the emissions in the BAU scenario slightly overshoot 10 t CO2 per capita, and the total emissions in 2030 are approximately as much as the total emissions in all Annex I Countries in 2010. The total emissions peak levels in the four colored scenarios approximately range from 10 Gt to 12 Gt CO2 , or 11 Gt to 13 Gt CO2 with emissions from industrial process. The peak levels in LBS-2030 and LGS-2025 are approximately 12.0 Gt and 11.6 Gt CO2 in total, and 8.6 and 8.3 t CO2 per capita, respectively. Such levels are significantly lower than in industrialized countries, which means that, although the peaking time in China will be later than industrialized countries, the peak level can be lower than in industrialized countries. The lower levels can be partially attributed to technological change and spillovers, and should also depend in part on policy efforts that China is going to make, because technological progress is often accompanied by a substantive increase in new consumption demands and per capita emissions.
|
|
|
Fig. 4. CO2 emissions per capita in peaking scenarios (excluding LULUCF). |
|
|
|
Fig. 5. Total CO2 emissions in peaking scenarios (excluding LULUCF). |
If we refer to the major works on emission pathways to achieve the 2 °C warming target, Chinas share of global limited emissions space (median value) in BAU and the four colored scenarios will be approximately 29%–25% in 2020, 38%–26% in 2030 (32.5% in LBS-2030 and 28.9% in LGS-2025), 49%–25% in 2040, and 69%–22% in 2050. Although the actual global emissions may exceed the allowable emissions space, and there are large uncertainties in the emissions pathways themselves, the numbers still indicates the evolving role of China in future global emissions maps. Compared with the BAU scenario, the cumulative emissions reductions in the four peaking scenarios will be 13.7–33.3 Gt CO2 from 2020 to 2030 (18.9 Gt in LBS-2030 and 24.4 Gt in LGS-2025), and the value from 2020 to 2050 will account for 5.4%–12.9% of the generally estimated total allowable emissions space (approximately 1.44 trillion t CO2 , and a 50% probability to stay below 2 °C).
3.3. The synergies and trade-offs between energy and climate security
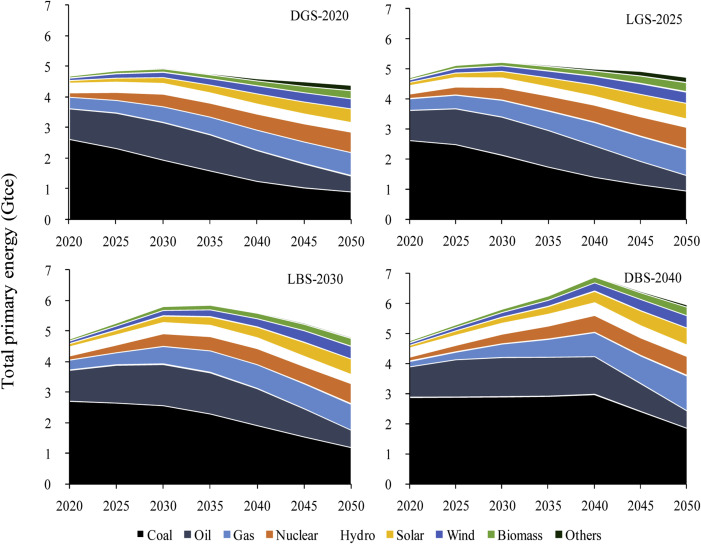
The synergies between energy and climate security polices primarily focus on cap control to decouple these factors from the economic growth in China. The scenarios indicated that the earlier the carbon emissions peak occurs, the lower the corresponding total and per capita energy consumption levels will be, and the energy consumption peak naturally follow the emissions peak (Fig. 6 ). The energy consumption peak in the four colored scenarios occurs slightly later than the emissions peak, and the levels range from 5.0 Gtce to 5.9 Gtce in total (5.8 Gtce in LBS-2030 and 5.3 Gtce in LGS-2025), and 3.6 tce to 4.2 tce per capita (4.2 tce in LBS-2030 and 3.8 tce in LGS-2025) in 2030, respectively. Despite the cap control and forcing mechanism, the growth in energy consumption in China will still almost double the number today, and the problem is to determine how such large increments can be attained.
|
|
|
Fig. 6. Total primary energy and mix in peaking scenarios. |
The synergies between energy and climate security polices secondarily derive from a cleaner energy mix and a lower coal consumption to gain the environmental co-benefits in China. The scenarios illustrate that the peak in coal consumption occurs earlier and at lower values when the carbon emissions peak regulations are more stringent, and decarbonization to some extent means the decoalization (Fig. 7 ). The coal consumption levels in the four colored scenarios range from 39% to 50% in mix (44.2% in LBS-2030 and 40.8% in LGS-2025), and 2.0 Gtce to 4.0 Gtce (2.8 Gt to 4.2 Gt) in total in 2030, respectively. The carbon emissions peak generally requires the coal consumption to peak by 2020, and the increments in energy consumption will mainly derive from the cleaner energy such as natural gas and non-fossil fuels.
|
|
|
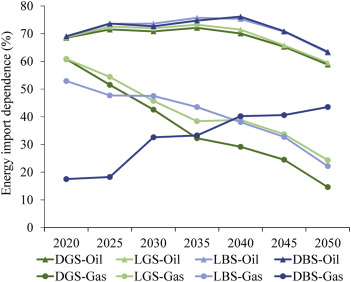
Fig. 7. Import dependence of oil and natural gas in peaking scenarios. |
The trade-offs between energy and climate security policies are primarily reflected in an increasing import dependence to fix the flaws from domestic resource and technology constrains. The scenarios indicate that the oil consumption in China will peak around 2030, however import dependence will remain as high as over 70% for a long time and will probably exceed the historical highest import amount in the U.S. (0.67 Gtoe). Taking into account the exploitation of the unconventional domestic resources, such as oil sands and oil shale, the oil import dependence will not fluctuate wildly (Fig. 6 and Fig. 7 ). The oil consumption levels in the four colored scenarios range from 0.86 Gtoe to 0.95 Gtoe (0.95 Gtoe in LBS-2030 and 0.89 Gtoe in LGS-2025) in total, and 71%–74% in import dependence in 2030, respectively. The oil import peak ranges from 0.61 Gtoe to 0.72 Gtoe (0.72 Gtoe in LBS-2030 and 0.64 Gtoe in LGS-2025). Such high imports of oil have the alternative solution of coal liquefaction for the sake of modeling energy security scenarios in previous research, but this route usually does not work in an emission-and-water-constrained world.
The scenarios also indicate that the natural gas in China will grow significantly, and challenges will come from the massive exploitation of unconventional domestic natural gas and imports from global market. The investments in shale gas exploitation in the four colored scenarios are projected to be approximately 697–1520 billion US$ (constant price of 2005) in 2030. In spite of this, the natural gas import dependence will increase rapidly in the near term (Fig. 6 and Fig. 7 ). Aside from DBS-2040, the three other peaking scenarios show a high increase in the short term, followed by a downward trend in the long term. Such imports will disturb the international gas market inevitably, even with the strong assumption of domestic exploitations and yields increase.
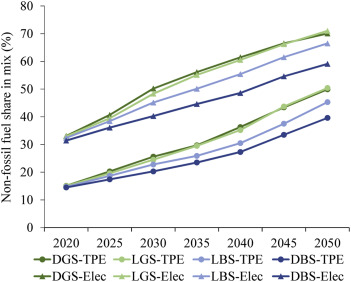
The trade-offs between energy and climate security polices secondarily include huge investments and the systemic risks of nuclear and renewable energy to close the gap between the large demand and lower fossil fuel supplies. The scenarios illustrate that the earlier the carbon emissions peak occurs, the higher the non-fossil fuel demand levels will be (Fig. 6 and Fig. 8 ). The non-fossil fuel share in energy mix in the four colored scenarios ranges from 20% to 26% (23% in LBS-2030 and 25% in LGS-2025). Nuclear and renewable energy have been given a crucial role in the long run.
|
|
|
Fig. 8. Share of non-fossil fuel and electricity in peaking scenarios. |
The big challenges may actually be in the power and end use sectors. Due to the quickly growing increments of non-fossil fuels and the limitations in conversion technologies, which means that the non-fossil fuels are substantially used for power generation, the electrification level will be much higher in the building and transportation sectors, and the power consumption will increase substantially (Fig 8 ), which will greatly impact the existing infrastructure, and also the stability and reliability of power systems. The total electricity consumption in the four colored scenarios ranges from 9.8 trillion to 11.4 trillion kW h in total (11.4 trillion in LBS-2030 and 10.3 trillion in LGS-2025), 8169 to 7020 kW h per capita, and 40%–50% in share of non-fossil (45% in LBS-2030 and 48% in LGS-2025) in 2030, respectively. A high share of non-fossil energy and electricity can be the means for emissions governance transformation from end-of-pipe control to source control.
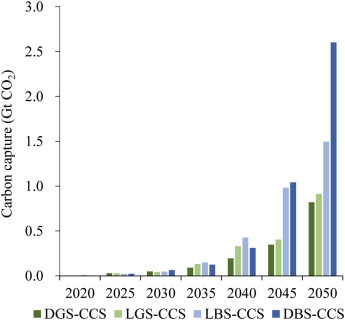
The trade-offs between energy and climate security polices finally come from the deployment of end-of-pipe technologies to cut down the residual emissions with an efficiency loss and geographical uncertainty. Carbon capture, use and storage (CCUS) technologies will be applied on a large scale in fossil fuel combustions and industrial process after 2030, although the coal consumption will drop significantly (Fig. 9 ). The captured CO2 in the four colored scenarios ranges from 64 Mt to 42 Mt (42 Mt in LBS-2030 and 47 Mt in LGS-2025) in total in 2030 and 0.8 Gt to 2.6 Gt in 2050. The roadmap of energy resources and technological revolution could be redrawn in various ways, but the synergies and trade-offs between energy and climate security would still exist.
|
|
|
Fig. 9. Carbon capture in peaking scenarios. |
3.4. The synergies and trade-offs between economy and climate security
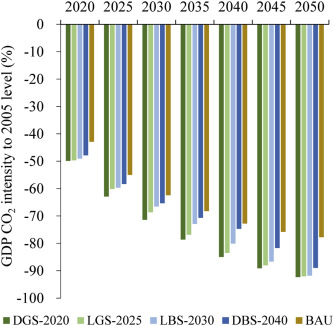
Long term economic security issues are subject to multiple factors, the measures of which are complicated, uncertain and sensitive to the occasional and external environment, but analysis of such scenario can still help us understand the comparison of different development pathways. The synergies between the economy and climate security polices primarily result from the growth of carbon productivity, which make the economy a deviation from the traditional pathway. The scenarios indicate that the GDP carbon intensity (the inverse of the carbon productivity) will decline significantly (Fig. 10 ). The GDP carbon intensity reduction in the BAU and four colored scenarios ranges from 62% to 71% (67% in LBS-2030 and 69% in LGS-2025) in 2030 compared to the 2005 level. The number in 2050 will be expected as much as 1/10 of the one in 2005.
|
|
|
Fig. 10. Carbon intensity change in peaking scenarios. |
The synergies between the economy and climate security policies are secondarily rooted in the bigger and faster growth of labor and capital productivity to improve the economic efficiency and development transformation. The scenarios indicate that the productivity of these factors will continue to increase to almost double the BAU level even though the economic growth slows (Fig. 11 ). Here, only the energy intensive industries (EII) and service & other industries (S&OI) are illustrated, although the agriculture sector also makes progress and modern farming practices contributes to the decarbonization, albeit in a relatively small way. The deviations of annual growth of labor and capital productivity in the four colored scenarios range from −0.84% to −0.25% and −1.04% to −0.08% in the EII, and 0.10%–2.11% and 0.09%–3.62% in the S&OI in 2030, respectively, compared to BAU level. The significant increase in the productivity of the S&OI has negative impacts on the productivity of the EII due to policy-induced resource reallocation, which results in more investments flowing into the non-energy-intensive sectors to achieve the economic restructuring and rebalancing. The earlier the emission peaking comes, the higher the productivity of the S&OI are required to be. There are obviously substitutions between value-added inputs (labor/capital) and carbon asset inputs, and the capability to peak as early as possible and sustainably develop largely depends on factor productivity improvements and substitutions.
|
|
|
Fig. 11. Labor and capital productivity change in peaking scenarios. |
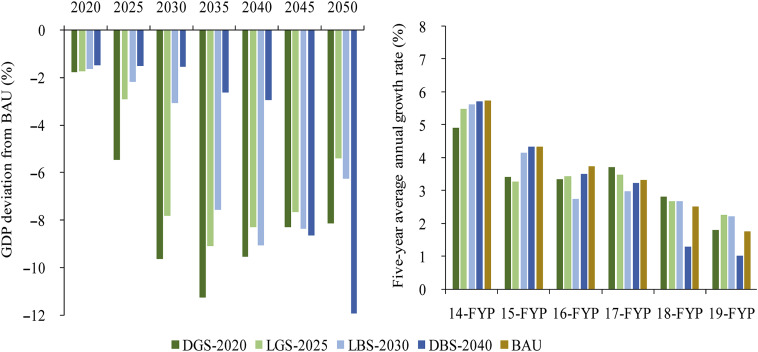
The trade-offs between the economy and climate security polices primarily merge as additional climate change costs from mitigation, adaptation and residual damage to occupy the economic resources and slow the economic growth. The scenarios indicate that the transmission of such impacts is not linear or quasi-linear but fluctuates on different time scales (Fig. 12 ). The cumulative deviations of GDP in the four colored scenarios range from −1.6% to −9.6% (−3.1% in LBS-2030 and −7.8% in LGS-2025) in total by 2030, and −0.01% to −1.07% (−0.19% in LBS-2030 and −1.07% in LGS-2025) in annual growth in the 15-FYP (15th-Five-Year-Plan), respectively, compared to BAU level. DBS-2040 shows small impacts on annual growths but big cumulative losses in the last decades, coupled with gradual and stable overall performance. LBS-2030 and LGS-2025 have moderate impacts throughout the decades, and the economic fluctuation occurs in the medium term and then follows the gradual recoveries and long term rebound trends. DGS-2020 has big losses in the short and medium term but small recovery in the long term. So LBS-2030 and LGS-2025 can be considered as relatively smooth transitions to low-carbon development.
|
|
|
Fig. 12. Impacts on economic growth in peaking scenarios. |
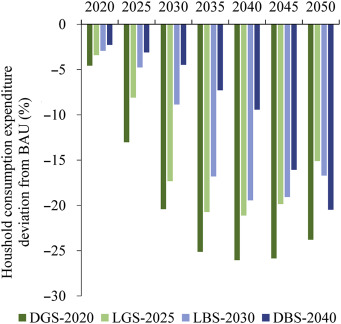
The trade-offs between the economy and climate security polices secondarily lie in the limitations on the consumption growth of the building and transportation sectors to control the non-subsistence emissions. Urbanization and consumption expansion are expected to be the next round of growth incentives in China, however an early peak may suppress such effects without significant technological innovations (Fig. 13 ). The cumulative deviations of household consumption in the four colored scenarios range from −20.4% to −4.5% (−8.9% in LBS-2030 and −17.3% in LGS-2025) in expenditure by 2030 compared to BAU level. The CO2 emissions peak of household sectors in DBS-2040, LBS-2030, LGS-2025 and DGS-2030 are correspondingly projected to be approximately 6.7 Gt, 6.1 Gt, 5.7 Gt and 5.1 Gt respectively compared to the 7.5 Gt in BAU scenario. Emissions are responsible for the approximately 400 million farmers moving from rural areas to urban areas and another 200 million rural migrant workers in urban areas improving their lives.
|
|
|
Fig. 13. Impacts on household consumption in peaking scenarios. |
4. Conclusions
Peaking after 2025 in China appears to have moderate impacts on economic development and energy transition, and its level can be expected to be 11–12 Gt CO2 in total and 8.0–8.5 t per capita. By that time, industrialization and the majority of infrastructure building will be completed, the urbanization rate will approach 70%, and the per capita income will reach US$20,000 (constant price of 2005). The future development of industry will primarily be inventory optimization rather than growth by big increments, the output of energy-intensive products will peak around 2020, and the future emissions growth will mainly come from the household sectors. If China can take the advantages of both the Yellow and Blue Label Countries, reform the consumption pattern, and do the best to implement technological and institutional innovation in the next decades, then it may be an example for developing countries on how to achieve an emissions peak and a low carbon transformation while simultaneously developing at a relatively high level.
The aggregated control over energy consumption and structural adjustment with the large scale application of low carbon technology will undoubtedly play a decisive role in achieving an emissions peak. If China can control its total energy consumption at a level below 6 Gtce, then the non-fossil fuels can meet most of the new incremental demand in the future, which means that the average annual investment in non-fossil fuels will exceed 150 billion US$, and the energy mix will be greener by 1–2 percentages annually by 2050. The risks appears to stem from a slower economic growth rate and a lower dependence on coal, and accordingly, the increase in natural gas imports in the short term and unconventional resources exploitations in the long term, the high share of intermittent energy on the supply side, the high electrification on the demand side, and the large scale application of carbon capture and storage beyond 2030. Thus, more investments, effort and policies are required to improve the labor, capital and carbon productivities for a fundamental green transformations.
Acknowledgments
The work was supported by National Science and Technology Program “The Key Supporting Research of The International Negotiations on Climate Change and the Domestic Emission Reduction” (2012BAC20B04 ).
References
- Blanford et al., 2012 G. Blanford, S. Rose, M. Tavoni; Baseline projections of energy and emissions in Asia; Energy Econ., 34 (S3) (2012), pp. S284–S292
- CAE, 2011 CAE (Chinese Academy of Engineering); China Medium and Long Term Energy Development Strategy Research; Science Press, Beijing (2011)
- Cai et al., 2007 W. Cai, C. Wang, K. Wang, et al.; Scenario analysis on CO2 emissions reduction potential in Chinas electricity sector ; Energy Policy, 35 (12) (2007), pp. 6445–6456
- CEACER, 2009 CEACER; 2050 China Energy and CO2 Emission Report ; Science Press, Beijing (2009)
- Chai, 2010 Q. Chai; Global Change Integrated Assessment Model for China (IAMC) and Sequential Decision Making under Uncertainty; Tsinghua University, Beijing (2010) (in Chinese)
- Chai and Zhang, 2010 Q. Chai, X. Zhang; Technologies and policies for the transition to a sustainable energy system in China; Energy, 35 (10) (2010), pp. 3995–4002
- Chai and Zhang, 2012 Q. Chai, X. Zhang; Policies and Pathways for Chinas Nationally Appropriate Mitigation Actions through 2020; Social Science Academic Press & Routledge, New York (2012)
- Chai and He, 2013 Q. Chai, J. He; Climate equity: concepts, politics and integrated assessment-how to comprehensively apply the principle of common but differentiated responsibilities in durban platform; China Popul. Resour. Environ., 23 (6) (2013), pp. 1–7
- Dai et al., 2012 H. Dai, T. Masui, Y. Matsuoka, et al.; The impacts of Chinas household consumption expenditure patterns on energy demand and carbon emissions towards 2050; Energy Policy, 50 (2012), pp. 736–750
- Gambhir et al., 2013 A. Gambhir, N. Schulz, T. Napp, et al.; A hybrid modelling approach to develop scenarios for Chinas carbon dioxide emissions to 2050; Energy Policy, 59 (2013), pp. 614–632
- Govindaraju and Tang, 2013 C. Govindaraju, C. Tang; The dynamic links between CO2 emissions, economic growth and coal consumption in China and India ; Appl. Energy, 104 (2013), pp. 310–318
- Guivarch and Hallegatte, 2013 C. Guivarch, S. Hallegatte; 2°C or not 2°C?; Glob. Environ. Change, 23 (2013), pp. 179–192
- Han and Yang, 2012 W. Han, Y. Yang; China Energy Outlook: Embracing Changes and Reshaping the Future; China Economic Publishing House, Beijing (2012) (in Chinese)
- He and Chai, 2008 J. He, Q. Chai; Reviews on global long-term goal of ghg emission reduction; J. Tsinghua Univ. Philos. Soc. Sci., 23 (5) (2008), pp. 15–25 (in Chinese)
- IEA, 2012 IEA; CO2 Emissions from Fuel Combustion Highlights ; International Energy Agency, Paris (2012)
- IPCC, 2007 IPCC; Climate Change 2007: Mitigation. Contribution of Working Group III to the Fourth Assessment Report of the Intergovernmental Panel on Climate Change; Cambridge University Press, Cambridge and New York (2007)
- Johansson et al., 2013 Å. Johansson, Y. Guillemette, F. Murtin, et al.; Long-term Growth Scenarios; OECD Economics Department Working Papers, No. 1000 OECD Publishing, Paris (2013)
- Lu et al., 2013 Y. Lu, A. Stegman, Y. Cai; Emissions intensity targeting: from Chinas 12th five year plan to its copenhagen commitment; Energy Policy, 61 (2013), pp. 1164–1177
- Mao et al., 2012 X. Mao, S. Yang, Q. Liu, et al.; Achieving CO2 emission reduction and the co-benefits of local air pollution abatement in the transportation sector of China ; Environ. Sci. Policy, 21 (2012), pp. 1–13
- Meng et al., 2012 M. Meng, D. Niu, W. Shang; CO2 emissions and economic development: Chinas 12th five-year plan ; Energy Policy, 42 (2012), pp. 468–475
- OECD, 2012 OECD; Looking to 2060: Long-term Global Growth Prospects; OECD Economic Policy Papers, No. 03 OECD Publishing, Paris (2012)
- PBL, 2009 PBL (Netherlands Environmental Assessment Agency); Meeting the 2°C Target: from Climate Objective to Emission Reduction Measures; Netherlands Environmental Assessment Agency, Bilthoven (2009)
- Qu and Guo, 2010 S. Qu, C. Guo; Forecast of Chinas carbon emissions based on STIRPAT model; China Popul. Resour. Environ., 20 (12) (2010), pp. 10–15 (in Chinese)
- UNDESA, 2011 UNDESA; World Population Prospects: the 2010 Revision, Highlights and Advance Tables; Working Paper No. ESA/P/WP.220 Population Division, Department of Economic and Social Affairs, United Nations, New York (2011)
- UNEP, 2012 UNEP (United Nations Environment Programme); The Emissions Gap Report 2012; United Nations Environment Programme, Nairobi (2012)
- van Ruijven et al., 2012 B. van Ruijven, M. Weitzel, M. den Elzen, et al.; Emission allowances and mitigation costs of China and India resulting from different effort-sharing approaches; Energy Policy, 46 (2012), pp. 116–134
- van Vuuren et al., 2003 D. van Vuuren, F. Zhou, B. de Vriesa, et al.; Energy and emission scenarios for China in the 21st century: exploration of baseline development and mitigation options; Energy Policy, 31 (4) (2003), pp. 369–387
- Wang et al., 2007 K. Wang, C. Wang, X. Lu, et al.; Scenario analysis on CO2 emissions reduction potential in Chinas iron and steel industry ; Energy Policy, 35 (4) (2007), pp. 2320–2335
- Wang and Watson, 2010 T. Wang, J. Watson; Scenario analysis of Chinas emissions pathways in the 21st century for low carbon transition; Energy Policy, 38 (7) (2010), pp. 3537–3546
- WB, 2013 WB (World Bank); World Development Indicators 2013; The World Bank, Washington DC (2013)
- Yu and Qu, 2013 X. Yu, H. Qu; The role of Chinas renewable powers against climate change during the 12th five-year and until 2020; Renew. Sustain. Energy Rev., 22 (2013), pp. 401–409
- Zhou et al., 2013a N. Zhou, D. Fridley, N. Khanna, et al.; Chinas energy and emissions outlook to 2050: perspectives from bottom-up energy end-use model; Energy Policy, 53 (2013), pp. 51–62
- Zhou et al., 2012 S. Zhou, Q. Tong, S. Yu, et al.; Role of non-fossil energy in meeting Chinas energy and climate target for 2020; Energy Policy, 51 (2012), pp. 14–19
- Zhou et al., 2013b S. Zhou, P. Kyle, S. Yu, et al.; Energy use and CO2 emissions of Chinas industrial sector from a global perspective ; Energy Policy, 58 (2013), pp. 284–294
Document information
Published on 15/05/17
Submitted on 15/05/17
Licence: Other
Share this document
Keywords
claim authorship
Are you one of the authors of this document?
