ABSTRACT
The effects of the thermal properties of three flooring materials on the spread rate of polymer melt over the surface were studied using a model based on the Particle Finite Element Method (PFEM). The high thermal conductivity of steel keeps the steel floor at a nearly uniform temperature throughout, whereas the ceramic and oak floors are able to sustain a higher temperature beneath the point at which the hot melt is dripping onto the surface. In general, the spread rate is controlled by the viscosity at the outer edges of the melt pool. The spread rate over steel is therefore fastest, especially for a thin floor that rapidly increases in temperature. The low thermal inertia of oak results in rapid changes in surface temperature, which traps the heat close to the interface between the floor and the melt and maintains a high temperature and low viscosity in the center of the melt pool. The ceramic floor transports heat more readily and may develop a hot spot underneath. The material properties of ceramic lie between those of oak and steel, but although the spread rate over a steel floor is always faster than over ceramic, the spread rate over oak may not always be slower.
INTRODUCTION
The melting and dripping of thermoplastic materials in a fire can significantly change how the fire develops. The severity of the fire may either be reduced or heightened depending on the evolving geometry of the flow and the location of the flames. The fuel may flow away from the source of heat without igniting, or it may form a pool fire that interacts with the original fire. In the latter case, the ignited pool beneath the dripping object causes even faster dripping, increasing the surface area of the fire and the peak rate of heat release, and making it more likely that the fire will spread to other objects in the room.
Sherratt and Drysdale1 showed experimentally that the type of flooring beneath a burning thermoplastic sheet can have a large effect on the development of the fire. Initially, flaming drops of polypropylene were extinguished as they dripped onto the cool surface below, and a base layer solidified while the top layer fed by continued dripping remained molten, eventually forming a small flaming pool. On a thin (3 mm thick) substrate of steel, the high thermal inertia caused the rapid conduction of heat away from the melt pool, cooling it and slowing its initial spread. The increasing temperature of the steel, kept uniform throughout the substrate by high thermal conductivity, eventually lowered the melt viscosity and caused rapid spread of the flaming melt pool accompanied by a rapid increase of the heat release rate (HRR). The resulting peak HRR was 25 % higher than for a 20-mm thick wood floor and almost four times that for a 30-mm thick concrete floor. This was attributed in part to the thermal mass of the substrate, which in the case of concrete enabled it to absorb five times more heat than the steel floor. The melt thus continued to lose heat to the concrete over time, maintaining a higher viscosity. Surface roughness and porosity were also proposed to contribute to the differences among the fire growth rates over the three types of flooring.
To better understand the effect the type of flooring has on fire growth, including the relative influence of thermal properties and physical characteristics, it would be useful to have a model that can show the effects of changing one variable at a time. Finding materials to carry out this kind of study in the laboratory would be very difficult. Progress is being made on modeling thermoplastic melting and dripping behavior using the Particle Finite Element Method (PFEM). This method represents the fluid and solid materials in the problem as a set of material points (particles) that move freely according to the forces (gravity, viscous, pressure, etc.) they experience. The relocated particles then form the nodes of a finite element model, whose governing equations are solved along with the appropriate boundary conditions to determine the temperature, flow velocity, and other variables, as well as the force that will be applied to each particle during the next time step. The free motion of the particles enables this method to simulate large changes in shape, including separation of material from the main body of the object. For the model of thermoplastic behavior in fire, thermoplastic materials are represented as a fluid with viscosity strongly dependent on temperature, as determined by rheometric measurements, and the flooring may be represented as a fluid with extremely high viscosity.
The PFEM application to fire behavior has been developed in conjunction with experiments based on a vertically-mounted polypropylene slab exposed on one face to a steady heat flux.2-4 Reasonable agreement with experiment has been demonstrated for the mass loss rate from the slab over a range of incident heat fluxes, and the agreement was improved by the addition of gasification to the model. For a second set of experiments measuring 2D melt spread rate, the PFEM predicted the spread rate over horizontal and slightly tilted surfaces within 10 % when the continuing degradation of the polymer over the heated surface was taken into account.3 The success of these previous efforts supports an investigation of the effects of the thermal properties of the flooring material on melt spread.
THE PARTICLE FINITE ELEMENT METHOD
The Particle Finite Element Method (PFEM) combines convection of particles by the flow field with a finite element solution of the equations of motion and energy, in a fully Lagrangian formulation that tracks large changes in shape and topology.5,6
In the PFEM, all domains, fluid or solid, are modeled using an updated Lagrangian formulation, in which all variables in both fluid and solid domains are known at time t and sought for time t+Δt. The finite element method is used to solve the continuum equations specific to each domain. This requires a mesh that discretizes the fluid and solid domains and defines the interfaces and free surfaces. The fluid and solid regions are not required to be stationary, and the nodes defining the elements are allowed to move. Each node becomes a material particle, with its own density, acceleration, and velocity, subject to gravity and other forces in the problem. During a single time step, the nodes move to a new position dictated by their individual forces. The new boundaries for the fluid and solid domains are identified using the alpha-shape method, which is described below.7 The domains are then discretized with a finite element mesh using a method based on the extended Delaunay tessellation, in which a random collection of particles is divided into a mesh of elements of arbitrary polyhedral shapes, including triangles and quadrilaterals. The Lagrangian equations of motion for the fluid and solid domains can then be solved for state variables, including velocities, pressure, and viscous stresses in the fluid, displacements, stresses, and strains in the solid, and temperature throughout, and the next time step is initiated.
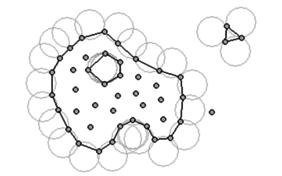
Identification of domain boundaries must take into account the possibility of highly distorted boundaries, such as the free surface of fluids, and the separation of particles or groups of particles from the bulk of the material. This is a central requirement for the modeling of dripping polymers in fire, in which the drips leave the original object and accumulate on the surface below. The alpha-shape method used to detect the boundaries is illustrated in Figure 1. To determine which particles are on the surface of a domain, circles (or spheres in three dimensions) are drawn touching two or more points. Any nodes that are on an empty circle with radius greater than αh, where h is the local minimum distance between two particles and α is a parameter close to but greater than one, are considered to be boundary nodes. Figure 1 illustrates the detection of the boundary of a large domain with a hole in it and two separated droplets, one defined by three nodes and the other by a single particle.
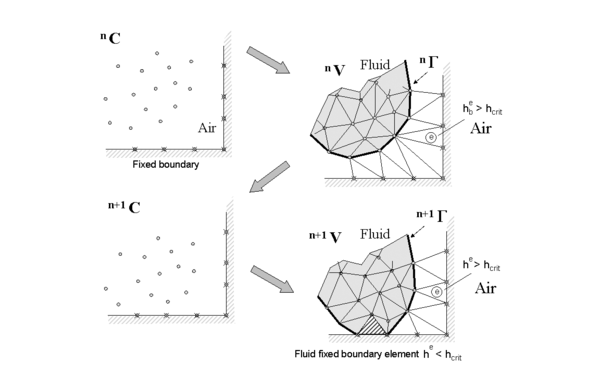
Of particular interest for the dripping problem is the process by which the particles falling off the thermoplastic object land on the catch plate. Figure 2 illustrates the approach of a fluid mass toward a wall. In this illustration, C denotes the cloud of particles, Γ the boundary of the fluid mass derived from the particle locations, and V the analysis domain for the fluid, with superscripts n and n+1 denoting times tn and tn+1. The alpha-shape method detects when a particle approaches to a point he within a critical distance hcrit of the wall. When this occurs, the incompressibility constraint prevents the particle from going through the wall and converts momentum toward the wall into momentum parallel to the wall. The particle experiences two additional forces: a normal force proportional to the difference (he-hcrit) in the direction away from the wall and a tangential force proportional to viscosity times the normal force pointed in the same direction as the original tangential velocity. This procedure puts a limitation on the time step for the dripping thermoplastic problem, since drops must be detected before they travel through the catch plate.
MODEL GEOMETRY AND INPUT PARAMETERS
The modeling effort for melting and dripping polymers in fire simulates the behavior from a set of experiments by Ohlemiller et al. at NIST.8 In these experiments, a rectangular polymeric sample was mounted upright and exposed to uniform heating on one face from a radiant heater placed on its side. The sample is modeled as a 2D upright rectangle with the heated face designated as a free surface and all other faces satisfying no-slip and adiabatic boundary conditions. Gravity is directed downwards. The free surface is exposed to a steady heat flux, and the boundary condition for the heated surface includes convective and radiative losses. The melt flows down the heated face of the sample and drips onto a surface below, which represents a floor over which the melt is able to spread. The floor is considered to be protected from the heating element, so that the only source of heat is the spreading melt. For this study, the melt on the surface of the floor is either allowed to cool or is exposed to a simple “flame” represented by a steady heat flux to its upper surface. In both cases, the spreading melt and the upper surface of the floor lose heat to convection and radiation. The floor is a rigid slab with uniform thickness and assigned material properties, and is assumed to be insulated along its bottom and sides.
More details of the model and experiment are given in previous papers.8,3,4
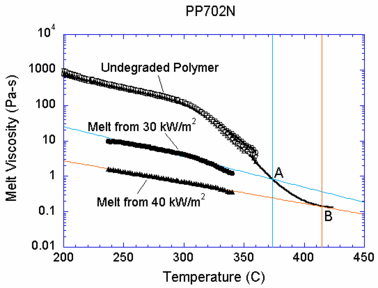
Viscosity is a key determinant of the melting behavior of thermoplastics. A high temperature both increases the mobility of the polymer chains and breaks chemical bonds to create smaller fragments; thus viscosity is a function of both molecular weight and temperature. To avoid calculation of the molecular weight distribution of the polymeric melt, which would greatly increase the complexity of the model, a simple relationship between viscosity and temperature was sought.4 A rheometer can measure viscosity as a function of temperature, but only up to the temperature at which the polymer begins to bubble. To carry the curve beyond this point, the rheometer was also used to characterize samples of the melt generated by two different heat flux levels. These melt samples are assumed to have been generated at the surface temperature of the melt as it flows down the heated face, a quantity that is measured during the experiment. This assumption neglects the effects of residence time at a given temperature on molecular weight, but tests found that doubling the residence time does not affect the melt viscosity. Figure 3 shows all three curves of viscosity vs. temperature for the polypropylene type PP702N, a low viscosity commercial injection molding resin formulation. The relationship used in the model, as shown by the black line, connects the curve for the undegraded polymer to points A and B extrapolated from the viscosity curve for each melt sample to the temperature at which the sample was formed. Above 415 °C, the viscosity is set to the value at point B. Below 200 °C, the viscosity is interpolated linearly to 106 Pa-s at room temperature, a value that maintains the solidity of the sample at low temperatures. The final result is an empirical viscosity-temperature curve that implicitly accounts for molecular weight changes.
For the calculations carried out here, the steady heat flux to the face of the polymeric sample is 30 kW/m2. Consistent with this assumption, the viscosity of the polymer melt over the floor substrate follows the line in Figure 1 associated with the melt collected from heating at 30 kW/m2. As the hot polymer drips onto the surface of the floor, its viscosity is on the order of 1 Pa-s. The melt viscosity increases as it cools, reaching a value of about 800 Pa-s if it is cooled all the way to room temperature. In the cases where the surface of the spreading melt pool is considered to be heated by a “flame”, the heat flux is also 30 kW/m2.
Although in general material properties in the PFIRE model may depend on temperature, for this study the densities, thermal conductivities, and specific heat capacities are assigned constant values. This simplification allows a clearer understanding of the effects of thermal properties on melt spread. The material properties are given in Table 1 for the PP702N polymer and three types of flooring: oak, ceramic, and steel. Oak and steel properties are from Drysdale,9 and ceramic properties are from melt spread experiments by Ohlemiller and Shields.8
In addition to thermal conductivity k, specific heat capacity cp, and density ρ, Table 1 also lists derived quantities that affect the thermal behavior of each material. The thermal inertia, kρcp, measures the resistance of a material to raising or lowering of surface temperature. When materials with low thermal inertia, such as oak, are heated, the surface temperature rises more quickly than for a material with high thermal inertia like steel. The thermal mass, Δxρcp, where Δx is thickness, measures the capacity of a body to store heat. A body with a higher thermal mass can store a larger amount of heat. For the three materials used for flooring here, heat will conduct most rapidly through steel and least rapidly through oak. The surface temperature will rise most rapidly for oak and least rapidly for steel. For a given thickness of flooring, steel will hold the largest amount of heat and oak the least. In this study two floor thicknesses are studied. The thick floor is 12.7 mm thick, and the thin floor is 3 mm thick. For all material properties, the values for a ceramic floor fall between those of oak and steel.
Table 1. Material properties for polymer melt and floor
| Material | Thermal conductivity
(W/m K) |
Specific heat capacity
(J/kg K) |
Density
(kg/m3) |
Thermal inertia
(W2 s/m4K2) |
Thermal mass of thick floor
(J/m2 K) |
Thermal mass of thin floor
(J/m2 K) |
| PP 702N | 0.25 | 2400 | 900 | 5.4 × 10⁵ | ― | ― |
| Oak9 | 0.17 | 2380 | 800 | 3.2 × 10⁵ | 24000 | 5700 |
| Ceramic8 | 1.26 | 1000 | 2700 | 3.4 × 10⁶ | 34000 | 8100 |
| Steel9 | 45.8 | 460 | 7850 | 1.6 × 10⁸ | 46000 | 11000 |
RESULTS
The spread rate of the polymer melt over a floor substrate is controlled by the viscosity of the melt, which in turn depends on the thermal conductivity, thermal inertia, and thermal mass of the floor. For this study, three types of flooring, two floor thicknesses, and a melt pool with and without a flame are considered. In all cases, the sides and lower surface of the floor are insulated.
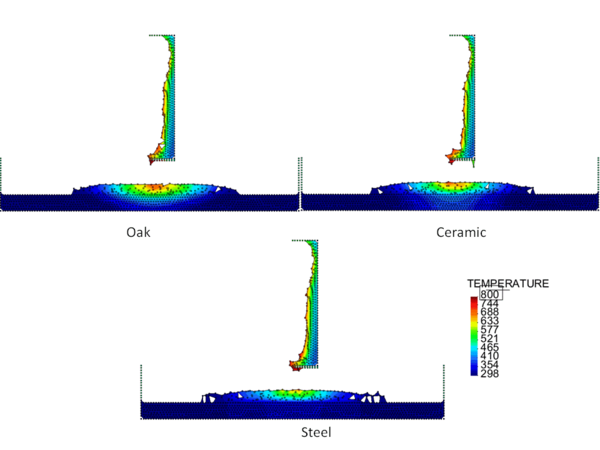
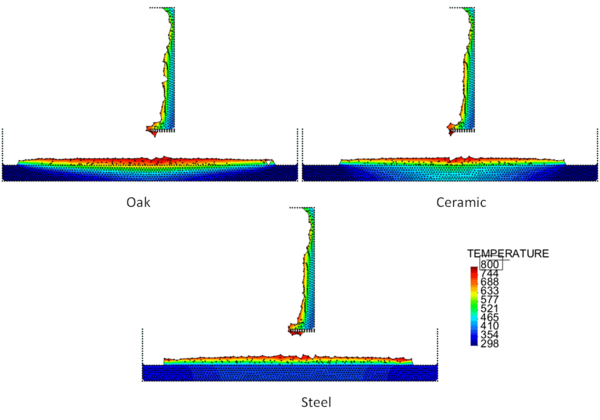
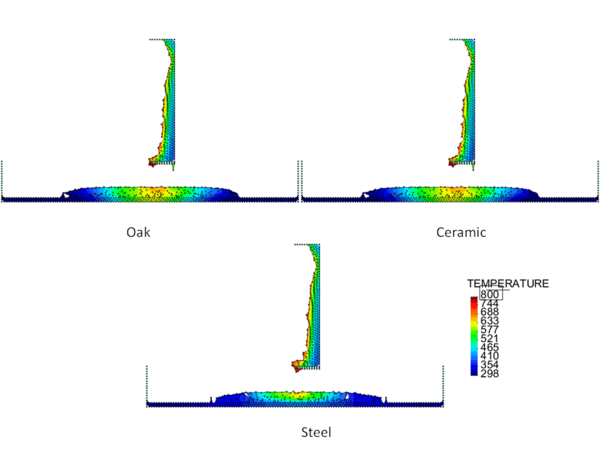
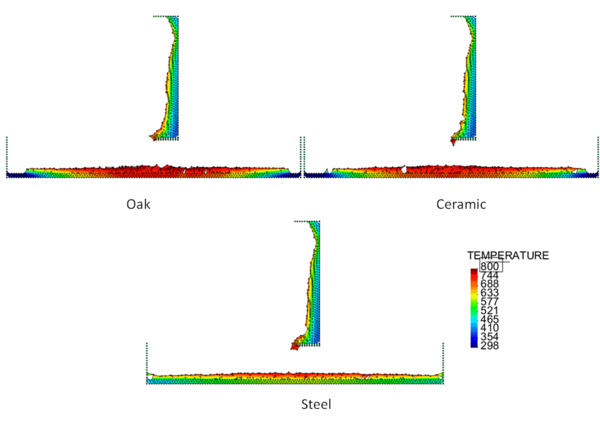
Figures 4 and 5 show the temperature contours for thick floors consisting of oak, ceramic, and steel at a time 750 s after heat is applied to the surface of the polymeric sample. In Figure 4, the melt is allowed to cool as it spreads over the floor, and in Figure 5 a flame heat flux is applied to the melt surface. Comparing these two figures, the cooling melt layer is found to be thicker than the heated melt layer, and its spread rate over each type of floor is slower. This is reasonable because the viscosity of the cooling melt is considerably higher than that of the heated melt.
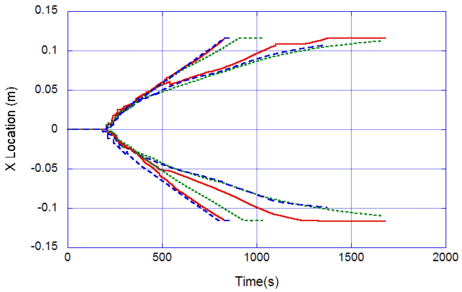
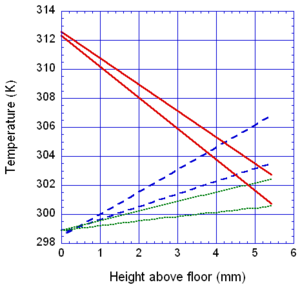
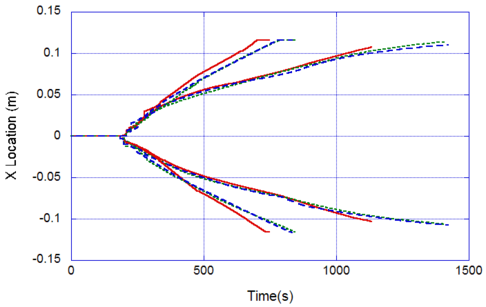
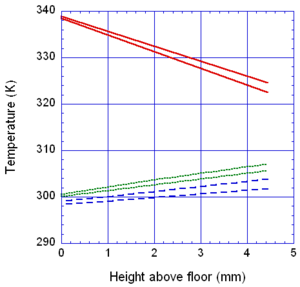
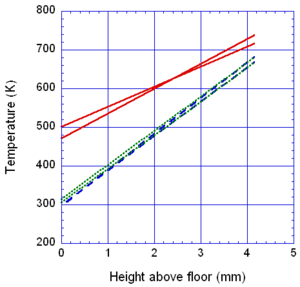
The locations of the melt front to the left and right of the drip point are plotted in Figure 6. As observed, the spread rate for the cooling melt is slower than for the heated melt. It is also not as even over time, reflecting slight changes in flow rate from the sample that are smoothed out by the more uniform viscosity of the heated melt. The spread rate over steel is faster than that over ceramic for both cooling and heated melts. This can be explained by the high conductivity of steel, which causes the temperature to rise over the entire steel substrate, reducing the viscosity at the outer edges of the melt pool. Figure 7 illustrates this factor more clearly by plotting the temperatures of the particles on the leading edges of the spreading melt as a function of height above the floor. In each case the average values of temperature along the leading edge are higher for steel than for oak, resulting in lower viscosities for the melt spreading over steel. Since the viscosity of the melt at the edges of the melt pool is higher than the viscosity at the center, the edge viscosities are expected to have the greatest control over the spread rate.
The spread rate over the oak floor is not as easily characterized. For the cooling melt pool, the spread rate is almost identical to that of ceramic, while for the heated melt the spread rate is closest to, and may even slightly exceed, that of steel. Figures 4 and 7(a) indicate for the cooling melt flowing over oak and ceramic floors that both the temperature contours and the temperatures (and thus viscosities) along the leading edges are very similar. The closeness of the spread rates for these two cases is therefore not surprising. The heated melt requires a different explanation. A comparison of the temperature contours through the oak and ceramic floors in Figure 5 illustrates the effects of the thermal inertia. For the oak, the low thermal inertia results in the confinement of high temperatures to the region near the upper surface, where they maintain a higher temperature, lower viscosity melt in the center of the pool. The heat has diffused farther through the ceramic floor, resulting in a hot spot at the bottom of the floor and lowering the temperature of the melt in the center. In this case, the viscosity at the edges of the melt pool does not explain the differences in spread rate, since Figure 7(b) indicates that the temperatures at the edges of the melt over oak are the lowest of the three materials. It may be that there is an effect from the strong gradient in viscosity along the direction of spread – this is also seen for the thin floor cases.
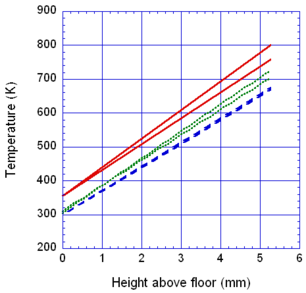
Figures 8-11 show the behavior of the melt flow over thin oak, ceramic, and steel floors. For both cooling and heated melt pools, Figure 10 shows that the spread rate over steel is the fastest overall, although for earlier times the spread rate is somewhat slower. This may be an indication of the effects of the high thermal inertia of steel noted by Sherratt and Drysdale1, in which the initial melt spread is slowed due to the rapid conduction of heat away from the melt pool. Due to the statistic nature of the PFEM, early drips are somewhat scattered in space, so this effect is difficult to assess. A larger number of particles, providing a higher resolution finite element mesh, will be necessary to accurately view this phenomenon.
Figures 8 and 9 show that for the thin floor the difference between the temperature contours for the melt spreading over oak and ceramic floors is small. The effects of the thermal inertia on surface temperature that affected the melt spread over thick oak and ceramic flooring substrates are greatly reduced when the heat is rapidly transported from top to bottom of the thin floors. Figures 10 and 11 show that for these two types of flooring the spread rates and leading edge temperatures respectively are nearly identical. Note in Figure 9 that the temperature profiles for the heated melt pools over oak and ceramic show a hot region in the center of the pool that is similar to that for the heated melt over oak in Figure 5. A comparison of Figures 6 and 9 indicates that the spread rates over thin oak and ceramic floors are similar to the spread rates over the thick oak floor, with a slower spread over the thick ceramic floor.
The high thermal conductivity of steel keeps the steel floor at a nearly uniform temperature throughout. The temperature rises more rapidly for the thin steel floor than for the thick one, as indicated in Figure 11 for both cooling and heated melts. At the edges of the pool at t = 750 s, the temperature of the heated melt over the thin steel floor is the highest of all cases in this study, resulting in the highest spread rate, as shown in Figure 10.
CONCLUSIONS
Although the fluid layer is thin and the distribution of particles is not always uniform, the PFEM is capable of demonstrating some of the complexities in the spread of a polymeric melt pool over different types of flooring material. This study demonstrates that the spread rate results from the interaction of thermal properties, viscosity, and the temperature and flow rate of the dripping material. The dependence of viscosity on temperature is a key property in the determination of spread rate, since it determines not only the flow rate but also the thickness of the melt pool layer and thus has a significant effect on thermal transport.
Accurate modeling of the spread of a polymer melt pool requires test methods and/or submodels that adequately describe the viscosity of the polymer as it melts and degrades. Gasification and the ability to solve 3D problems are available now, although the runtime may be excessive for realistic situations. A flame model is needed to complete the feedback between the dripping object and the accumulating pool fire below.
ACKNOWLEDGMENT
The authors would like to thank Martin (Drew) Mooney for early work on modeling melt flow over different catch plate materials during his time as a SURF (Summer Undergraduate Research Fellowship) student at NIST.
REFERENCES
1 Sherratt, J. and Drysdale, D., “The effect of the melt-flow process on the fire behaviour of thermoplastics”, Interflam 2001, Interscience Communications Ltd, London, UK, pp. 149-159.
2 Butler, K.M., Oñate, E., Idelsohn, S.R., Rossi, R., “Modeling polymer melt flow using the Particle Finite Element Method”, Interflam 2007, Interscience Communications Ltd, London, UK, pp. 929-940.
3 Butler, K.M., “A model of melting and dripping thermoplastic objects in fire”, Fire and Materials 2009, Interscience Communications Ltd, London, UK.
4 Oñate, E., Rossi, R., Idelsohn, S.R., Butler, K.M., “Melting and spread of polymers in fire with the particle finite element method”, International Journal for Numerical Methods in Engineering, 81 (8), 2009, pp.1046-1072.
5 Idelsohn, S.R., Oñate, E., Del Pin, F., “The particle finite element method: a powerful tool to solve incompressible flows with free-surfaces and breaking waves”, International Journal for Numerical Methods in Engineering, Vol. 61, 2004, pp. 964-989.
6 Oñate, E., Idelsohn, S.R., Del Pin, F., Aubry, R., 2004. The particle finite element method. An overview. International Journal of Computational Methods 1 (2), pp.267–307.
7 Edelsbrunner, H. and Mucke, E.P., “Three dimensional alpha shapes”, ACM Trans. Graphics, Vol. 13, 1999, pp. 43-72.
8 Ohlemiller, T. and Shields, J., “Aspects of the Fire Behavior of Thermoplastic Materials”, NIST TN 1493, 2008.
9 Drysdale, D., An Introduction to Fire Dynamics, 2nd ed., John Wiley & Sons, Chichester, England, 1998.
Document information
Published on 01/01/2010
Licence: CC BY-NC-SA license
Share this document
Keywords
claim authorship
Are you one of the authors of this document?
