(Main changes were: 1.- The title, abstract and introduction were re-written 2.- Some text phrases were corrected or modifyed 3.- New images were included 4.- A description of the study stages was included 5.- A list of parameters and mesh characteristi) (Tag: Visual edit) |
m (Lafloresh moved page Draft Flores-Herrera 662712112 to Review Flores-Herrera et al 2017a) |
(No difference)
| |
Revision as of 22:50, 30 October 2017
3D printed scaled setup for smoke transport analysis in a subterranean passenger platform
L. A. Flores-Herrera, R. Rivera-Blas, J. Humberto Pérez-Cruz, N. Muñoz-Aguirre, C. Torres-Martínez, M. F. Carbajal-Romero, R. Vargas-Carmona, M. Funes-Lora
Instituto Politécnico Nacional, Sección de Estudios de Posgrado e Investigación, Escuela Superior de Ingeniería Mecánica y Eléctrica, Unidad Azcapotzalco: Av. de las Granjas No. 682 Col. Santa Catarina, c. p. 02250, Ciudad de México, México.
lafloresh@ipn.mx, rriverab@ipn.mx, jhperez@ipn.mx, nmunoz@ipn.mx, ctorresm@ipn.mx, mcarbajalr@ipn.mx, rvargasc1400@egresado.ipn.mx, miguelaf@umich.edu
Corresponding author: lafloresh@ipn.mx
Abstract
The study presented in this work considers the presence of smoke inside of a subway passenger platform with a particular set of ventilation ports connected to atmospheric pressure. Real dimensions and main architectural details of a passenger platform located in Mexico City were considered for modeling the analysis scenario. The main purpose of this analysis is to observe the behavior of the smoke in simulated scenarios and compare them with a re-creation in a 3D printed 1:100 scaled model. The study is divided in three stages, the first one is focused on the theoretical application of the critical velocity calculation, which is essential for engineers during the selection and location of the fans (NFPA 130-7). The second stage consists in two FDS simulations with a 5MW fire source located inside the passenger platform during 180 seconds. In the third stage, a 3D printed model was constructed to create a suitable observation experimental setup. The behavior of the smoke in the experiment demonstrated that the smoke is transported out of the platform through the same ventilation duct than the one observed in the simulation. Details of the numerical models meshing are shown, as well as key facts essentials for the creation of the 3D printed models. The procedures described here can be used as important tools for organizations working in the development of safety procedures.
Keywords: CFD, FDS, ANSYS-FLUENT, Smoke, Critical velocity, 3D print.
1. Introduction
Comparative characteristics between the use of field simulations (FDS) and volume of fluid simulations (Fluent) to calculate smoke spread in a subway platform fire and its complexity are well described in [1]. In addition to the calculus, when the fire occurs, the emergency response process starts. At least 25 tasks and resources have been identified during an empirical study of emergency response reported in [2]. They have to interact in a common site and also deal with a situation in which, the architectural distribution creates important differences in the behavior of the fire and smoke distribution [3] loss of visibility [4, 5], as well as the ventilation characteristics [6]. The reaction procedure of the staff is intended to adequately manage the time that elapses until the last person is evacuated [7, 8]. Passenger reactions to an emergency in subways have shown to be independent of their individual characteristics such as gender, educational level or for example; carrying-on luggage [9]. These kind of disasters involve a great human cost because in subterranean emergency scenarios, the possibilities for the passengers to leave or scape out of a critical location is quite compromised. The limited space for mobility, low visibility, presence of fresh air, etc., are some of the restrictions that a passenger can face in these situations.
When designing subterranean installations, connections to atmospheric pressure are one of the most important issues that have to be considered. The location and size of the ventilation ports, external and internal weather conditions among others create set of variable air conditions. In the case of subway tunnels, convective flow currents enhance the generation of vortex in random locations even when the air velocity can be maintained constant along the tunnel by natural conditions or by means of a mechanical ventilation system. The emission of smoke close to a ventilation duct connected to the atmosphere does not always guarantee a safety condition because; the atmospheric pressure creates an equilibrium between the internal and external pressures affected by the temperature and the resulting direction of the air flow in consequence is not easy to predict.
2. Materials and methods
This study is composed by several steps with the purpose of observing in a separate way the events occurring in a fire scenario. In these events, several physical situations are presented simultaneously, by dividing the sequence of them, interesting observations can be made to understand the complexity of the phenomenon. The main situation to be observed in this study is the resulting flow after the equilibrium condition is reached. The temperature changes generated inside the platform will have a straight interaction with the ducts connected to atmospheric pressure, and finally addressing the transportation of the smoke. Therefore, the three main stages of the study are described below. The first stage was developed to validate the critical velocity calculation. The second one to simulate the smoke transportation phenomena and the third one describes the creation of a 1:100 scaled model to observe and compare the displacement of the smoke with respect to the simulation.
2.1. First stage
The first stage considers the analysis of the flow velocity inside the platform when the critical velocity is injected from one side of the tunnel. There is not fire source in this case but only the air flow velocity calculation. The NFPA 130-7 provides important information to carry out the calculation of the critical velocity which is the velocity required to provide adequate ventilation conditions and to produce adequate smoke transportation in case of fire emergencies. This critical velocity avoids also the backlayering effect in which the smoke in certain cases tends to move in a different direction of the one desired. To observe the flow pattern, a simplified theoretical 2D model was implemented in Fortran and compared with a simulation in ANSYS-Fluent and also in FDS programs. The FDS program was developed by the National Institute of Standards and Technology. This results are very important during the selection and location process of the fans in subterranean installations.
2.2. Second stage
The second stage considers a 180 seconds fire simulation in FDS [10]. In this case, a totally developed fire of 5MW is located close to the center of the platform as in [11]. The evacuation of the smoke trough the natural ventilation ports is another interesting issue to observe in the simulation [12] and to notice the presence or not of the backlayering effect with the injection of the critical velocity [13-15]. It is not easy to predict the displacement of the smoke because at least 4 ventilation ducts connected to atmospheric pressure are close to the fire source. In one simulation, the air conditions are allowed to move freely. In a second simulation, the previously calculated critical velocity is injected from the left side of the platform and both results are compared.
2.3. Third stage
In the third stage, a 3D printed model was constructed to create a suitable observation experiment setup by using a Mendelmax printer and Polylactic Acid (PLA) as the deposition material with 0.2mm thickness layers. The stage has been developed with the purpose of re-creating the scenario to observe the smoke spread. Once the smoke output is constant, an exchange of temperatures within the platform is generated, these differences between the hot and cold gases, after some time, reach an equilibrium behavior creating a flow distribution (under free motion conditions). This equilibrium is directly related with the distance between the ventilation ducts because they are communicated through the platform and are directly affected by the atmospheric pressure. The behavior will be observed with the help of this setup; once the ventilation system has been turned on, it will be possible to observe if the behavior is similar to the one observed in the simulations (stage 2), although in a real scenario many other factors will be presented and may differ from this experiment.
Table I, shows a list of all the analyzed cases in each stage of this study.
| Case No. | Program | Simulation type | Objective |
| 1 | Fortran | Air flow at critical velocity | Validation |
| 2 | ANSYS-Fluent | ||
| 3 | FDS | ||
| 4 | FDS | Smoke transported at free motion condition | Differentiate the influence of the air flow at critical velocity |
| 5 | FDS | Smoke transported with the air flow at critical velocity | |
| 6 | Experimental setup | Smoke transported in free motion | Observe experimental behavior with respect to the FDS simulations |
| 7 | Experimental setup | Smoke transported with the fans on |
2.4. Description of the analysis scenario
In the presence of fire inside underground facilities, different parameters should be considered to handle the emergency situation and provide a suitable breading atmosphere for the users, it must be kept sustainable conditions for life. However, every subway systems have particular characteristics, it requires specific solutions which relate internal and external conditions of the tunnel as an enclosed place with limited escape routes.
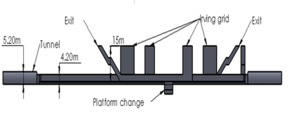
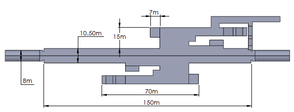
The analyzed platform has 15m depth from the sidewalk level and 150m in length, it has four ventilation ports (ducts) at the ceiling connected to atmospheric pressure and three passenger access towards the street. Figure 1, shows the dimensions and geometry considered for the 3D model. They were obtained by direct measurements of the platform creating a simplified geometry.
|
|
| a) | b) |
2.5. Critical velocity calculation
During the backlayering effect, the ventilation conditions are not suitable to transport the smoke to a desired direction or exit. The smoke produced by a fire source can be moved then to the opposite direction. The critical velocity has become in one of the prime criteria for the design of ventilation systems, especially in tunnel section [16]. In this study, the Kennedy model (equations 1 up to 3) were used to calculate the critical velocity in the subterranean scenario, where the value of the critical velocity is determined with the simultaneous solution of the Kennedy model [17-20].
| 1 | |
| 2 | |
| 3 |
For the model, K1= 0.605 is a dimensionless constant value given by equation 3, the Froude number considered for the calculation takes a value of 4.5 according to [21] and K2=1 is a dimensionless slope factor; the average burning temperature was TF=369.34 °K (96.2°C) which resulting values corresponds to the ones presented in [22]. The 5MW fire source was considered according with [23, 24], and the remaining values considered for the critical velocity calculation are shown in table II [25].
Table II. Values for the critical velocity calculation using the Kennedy model.
| Parameter | Value |
| Gravity acceleration (g) | 9.81 |
| Tunnel height (H) | 5.2 m |
| Slope | 0 % |
| Air density ( ) | 1.176 |
| Specific heat of air (Cp) | 1.007 |
| Transverse section area (A) | 41.6 |
| Air temperature ( ) | 300.15 °K (97 °C) |
| Critical velocity (Vc) | 1.464 |
3. General formulation
3.1. Theoretical analysis implemented in FORTRAN
The present analysis is based on the pressure-velocity coupling method, known as vorticity-stream function. The governing equations for the analysis consider an incompressible and Newtonian flow (2D), the conservation of mass (equation 4) and momentum (equation 5). The analysis considers a procedure step by step with respect to time, variable velocities ( ), density ( ) and dynamic viscosity (μ):
| 4 | |
| 5 |
The vorticity - stream function ( ) equations were discretized using the finite differences method where each node is used to describe the computer dominion (equations 6 and 7) [26]:
| 6 | |
| 7 | |
Here, U and V corresponds to the velocities in the x and y directions (equation 8):
| , | 8 |
After discretization of equation 6, the following is obtained:
| 9 |
| 10 |
In which, the coefficients are:
| 11 |
And for equation 7:
| 12 |
| 13 |
The coefficients are:
|
|
14 |
The resulting Reynolds number is in this case 4.898 x 10⁻⁵.
3.2. Boundary conditions in the theoretical model implemented in Fortran
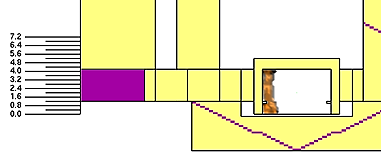
Figure 2 a) shows the distribution of boundary conditions in the 2D model (case 1). The resulting mesh arrangement is shown in figure 2 b). The figure represents the top view of an idealized duct; the control area, it is represented by a horizontal layer crossing along the center of the passenger platform. The corresponding mesh was formed by 50x275 rectangular divisions. The entire rectangle corresponds to the first 59m measured from the left side of the platform. The location of each boundary condition is applied on each side by considering the Thom formulation and an idealized velocity profile [27].

|
| a) |
|
| b) |
3.3. Boundary conditions in ANSYS-FLUENT
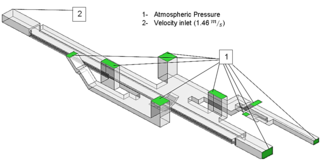
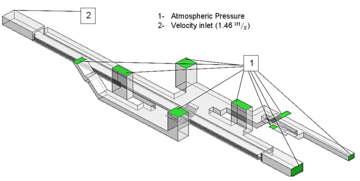
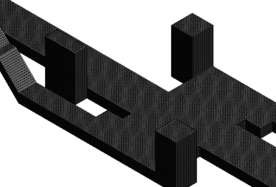
This analysis (case 2) was carried out only to observe the flow stream along the platform at the critical velocity and compare with case 1. It considers the Finite Volume formulation allowing the discretization and solution of the differential equations. The resulting 3D model is shown in figure 3, it is composed by a large rectangular shape representing the passenger platform, and four rectangular blocks were used to represent the natural ventilation ports. Another three slender blocks (tilted) were used to represent the stairs. The location of the areas connected to atmospheric pressure were identified as condition type 1. These includes the natural ventilation ports and passenger accesses. For the type 2 condition, 1.46m/s of air velocity was applied at the end of the tunnel (left side).
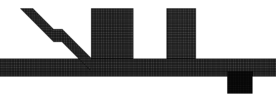
Different mesh methods were tested until an excellent mesh quality range (qualification) was obtained according to [28]. The resulting model contains 284,816 nodes and 247,974 elements as shown in figure 4 a) isometric view and b) lateral view.
|
|
| a) | b) |
Table III, shows the main parameters considered for the ANSYS-Fluent simulation:
| Name | Selection/Value |
| Solution type | Pressure based |
| Velocity formulation | Absolute |
| Viscous model | k-ε standard |
| Air density | 1.164 kg/m3 |
| Dynamic viscosity | 1.86 e-05 kg/m.s |
| Inlet velocity | 1.464 m/s |
3.4. Boundary conditions in FDS
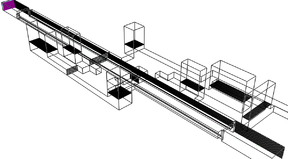
Fire Dynamic Simulator (FDS) was used to simulate the behavior of the calculated critical velocity in the platform [29]. The CAD modelling for this case was created considering a series of coordinates along the X, Y and Z axes as shown in figure 5. In this model, three case studies were considered, one was used to verify the development of the critical velocity named case 3. Case 4, includes the fire source in free motion and case 5 includes the fire source and the application of the critical velocity (location 2).
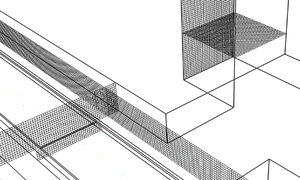
For the FDS meshing, the total number of rectangular cells was 2,474,693, a simplified view of the resulting mesh is shown in figure 6 a) isometric view and a close view in figure 6 b).
|
|
| a) | b) |
|
Figure 6. Resulting mesh in FDS a) Isometric view of the passenger station and b) Close view of mesh layers at the center of the passenger platform | |
4. Results
The gathering of results was made considering a horizontally oriented rectangular plane crossing along the model, located at 3.4m (height) from the floor level, in the middle of the platform, this plane was used to observe all sceneries, now for each case:
4.1. Case 1- Results obtained in FORTRAN
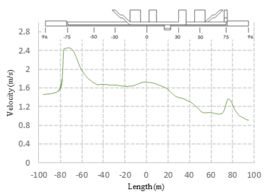
Figure 7 a), shows a dimensionless scale of the resulting air velocity distribution. This results were scaled to the real dimensions and tracked through a crossing line at the middle of the plane as shown in figure 7 b).
|
|
| a) | b) |
4.2. Case 2- Results obtained in ANSYS-FLUENT
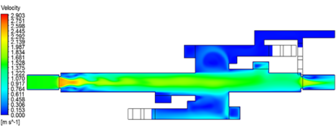
Figure 8, shows the resulting velocity contour obtained in ANSYS-FLUENT. The red frame represents the portion of the model analyzed in FORTRAN. An increment of the velocity is present at both ending sides of the model due to the reduction of the cross section area (-70m and 80m) between the tunnel and the passenger platform.
|
|
| a) | b) |
4.3. Case 3. Results obtained in FDS
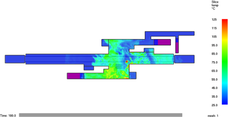
Figure 9, shows the velocity contour obtained in FDS for case 3. The results present a similar behavior as in ANSYS-FLUENT.
|
|
| a) | b) |
4.4. Case 4 and 5. Comparison
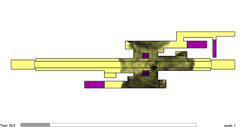
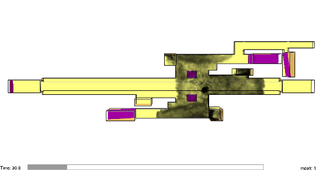
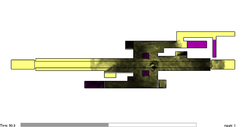
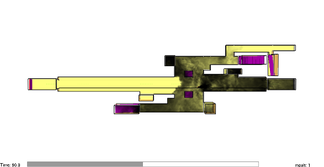
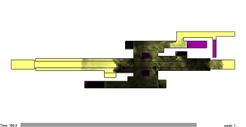
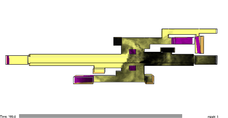
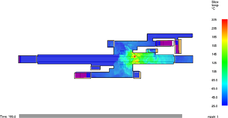
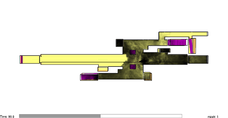
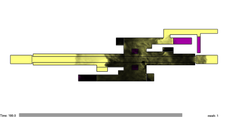
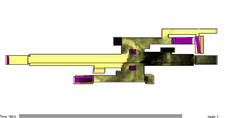
Case 4 corresponds to the simulation of the smoke evolution in free motion condition. The smoke moves only according to the influence of the temperature changes and atmospheric interactions. Case 5 presents the evolution of the smoke affected with an air velocity of 1.46 m/s. The evolution of the simulations is presented in figure 10. From a) to c) corresponds to case 4 and figures d) to f) corresponds to case 5.
| Evolution of smoke for Case 4 | Evolution of smoke for Case 5 |
|
|
| a) 30 sec. | d) 30 sec. |
|
|
| b) 90 sec. | e) 90 sec. |
|
|
| c) 180 sec. | f) 180 sec. |
| Figure 10. Evolution of smoke transportation for cases 4 and 5. | |
According to the calculation described in [30], the resulting flame height is in this case 6.07m which is higher than the top ceiling level as observed in figure 11, and a safety distance for the passengers to be away from the fire source goes beyond 10m [31].
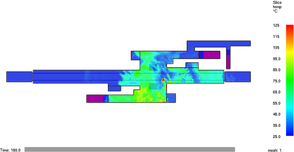
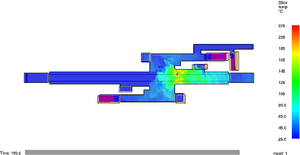
The difference of heat distribution for cases 4 and 5 after 3 minutes of fire evolution is presented in figure 12, a) and b) for free motion, and c) and d) with the fans switched on. When the critical velocity is injected from the left side of the platform.
| Temperature distribution for case 4 | Temperature distribution for case 5 |
|
|
| a) | c) |
| b) 180 sec. | d) 180 sec. |
| Figure 12. Temperature distribution for cases 4 and 5. | |
The distribution of the heat is maintained above 35°C for more than 80m long in the free motion case with a maximum of 63°C. When the critical velocity is acting on the scenario, a notorious local increment in the temperature reaches more than 220°C. After approximately 10 meters this temperature drops to 100°C and 40meters away it falls down below 60°C. As in many fire situations, an increment in the air velocity can produce enrichment of the fire reaction.
5. Experimental setup
The use of the experimental setup is important because it allows to include the physical senses during the study of the phenomenon; although the creation of the scaled model is not a straight way work, instead it has presented a series of challenges, because of that, a series of recommendations are described below.
5.1. Distribution and manufacturing of the setup
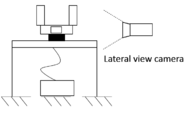
Figure 12 shows the distribution of the experimental setup, the scaled model is mounted on a support table. Apart from the 3D printing of the model, extra support equipment will be required to locate the camera systems depending on the shots or pictures desired to obtain. Another important factor that must be carefully considered is the treatment of the filming (or photographs) in scaled scenarios. For this reason, an adequate lighting system will allow to obtain better pictures during the experiment. In this case, different attempts had to be made to obtain a suitable observation sequences.
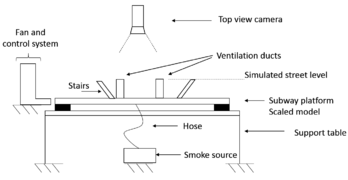
|
|
| a) | b) |
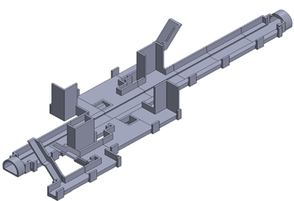
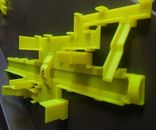
For the creation of the scaled model, a series of modifications were considered in the original 3D CAD model in order to create the printable file. The modifications included the elimination of the ceiling and selected walls also. These layers will be next substituted with transparent glass to allow the observation of the smoke. The final CAD file is shown in figure 13.
It is possible to observe also that the model was divided in many sections to be finally assembled together. A series of mechanical supports were also included to provide rigid support and to hold in position the transparent layers. Previous prints were made to obtain the model shown in figure 14.
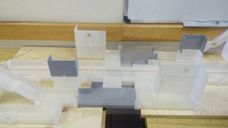
In this case, this model allow us to validate the assembling process between all the sections and make corrections if needed. For convenience of this picture, the bottom stairs were located on top of the model upside down (number 11 in the picture). Once the entire model was validated, a 1:100 scaled model was finally printed. It is recommended to create a numbered map and list of all the pieces to avoid confusion during the assembling. In this form, the model can be easily transported to a preferred location for the experiments. Figure 15 shows the resulting assembled model, now the bottom stairs are properly located at the bottom face of the model.
Finally, the transparent layers of the ceiling were installed, figure 16 shows the final scenario constructed for the experiment.
5.2. Captured shots of the smoke
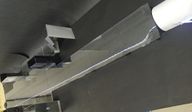
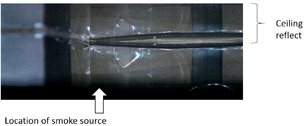
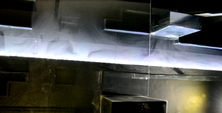
Besides of the top views captured during the experiments, a close lateral view in the location of the smoke source is also considered and presented in figure 17. In this case, the ceiling reflect is observed on the top side of the picture. This is one of the issues that can appear during the close-up shots and have to be identified during the interpretation of results.
5.3. Smoke displacement in free motion
Once the smoke has been injected into the setup, a free displacement of smoke was allowed. After 60 seconds, the internal equilibrium of the system was clearly achieved generating a flow pattern like the one shown in figure 18. In the right side of the figure, the tendency of the smoke to move out of the platform in the same ventilation duct as the one observed in the FDS simulation can be observed.
5.4. Smoke displacement with fans switched on
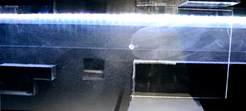
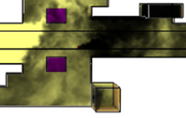
In figure 19 a) a top view of the smoke movement was captured when the fans were switched on. This is compared with the result obtained in the FDS simulation in figure 19 b). Similar displacement of the smoke was observed in both scenarios showing that the smoke leaves out in the same ventilation duct despite of the differences appreciated between the scaled model and the simulation.
|
|
| a) | b) |
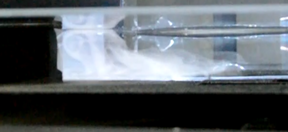
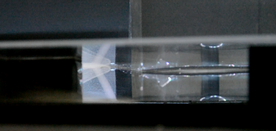
Figure 20 shows a lateral close view in the smoke emission zone in two different cases, a) when the fans are turned off and b) when the fans are turned on.
|
|
| a) | b) |
Changing the location of the smoke source in this scaled scenario is a fast task. It will allow to observe in a reduced time the displacement of the smoke creating important information for firefighters or other security personnel working in the development of emergency contingences.
7. Discussion
Similar results were obtained between the theoretical model, and the ones obtained in ANSYS-FLUENT and in FDS simulations. In the smoke simulations, the air stream affected by the critical velocity injection increases the possibility of having smoke-free areas were the passengers can have better breathing conditions, but an important increment in the temperature was also observed. The development of the 3D printed setup combined with the simulations, allows to have more visual observations of the phenomena. One advantage of using the setups is that more architectural details can be included in the physical model and to reproduce a wide variety of analysis scenarios in very short time by changing the location of the smoke source. Several future work implementations can be applied in the setup from sophisticated control systems to special illumination for pattern recognition, image analysis algorithms, thermography or other technologies for intelligent support of firefighters that can be implemented also in real platforms.
8. Conclusions
According to the simulation, 1.46m/s is required to produce adequate smoke transportation of the 5MW fire source; no backlash was observed. This was an idealized case in which the velocity of air can be altered for example by the presence of the piston effect produced by trains traveling along the tunnels. In real case, an increment of the velocity caused by external factors could produce an increment in the combustion due oxygen enrichment to the fire source. The results presented here correspond qualitatively to the ones obtained in [23] and [32] with differences related to the power of fire considered in each investigation. The time it takes the smoke to occupy the entire platform can be used to calculate the available time the passengers have to evacuate the platform as it was presented in [4, 5] in which the critical velocity plays an important role.
9. Acknowledgements
Authors acknowledge the Instituto Politécnico Nacional (IPN) and the Consejo Nacional de Ciencia y Tecnología (CONACYT) México for the support provided for this academic research.
10. References
- [1] Wang Binbin, Comparative Research on FLUENT and FDS’s Numerical Simulation of Smoke Spread in Subway Platform Fire, Procedia Engineering 26 (2011) 1065 – 1075, doi:10.1016/j.proeng.2011.11.2275
- [2] Qiming Li, Yongliang Deng, Cong Liu, Qingtian Zeng, Ying Lu, Modeling and analysis of subway fire emergency response: An empirical study, Safety Science 84 (2016) 171–180, http://dx.doi.org/10.1016/j.ssci.2015.12.003 0925-7535
- [3] Ran Gao, Angui Li, Ying Zhang, Na Luo, How domes improve fire safety in subway stations, Safety Science 80 (2015) 94–104, http://dx.doi.org/10.1016/j.ssci.2015.07.015 0925-7535
- [4] Kai Kang, A smoke model and its application for smoke management in an underground mass transit station, Fire Safety Journal 42 (2007) 218–231, doi:10.1016/j.firesaf.2006.10.003
- [5] Manabu Tsukahara, Yusuke Koshiba, Hideo Ohtani, Effectiveness of downward evacuation in a large-scale subway fire using Fire Dynamics Simulator, Tunnelling and Underground Space Technology 26 (2011) 573–581, doi:10.1016/j.tust.2011.02.002
- [6] Na Luo, Angui Li, Ran Gao, Zhenguo Tian, Zhipei Hu, Smoke confinement utilizing the USME ventilation mode for subway station fire, Safety Science 70 (2014) 202–210, http://dx.doi.org/10.1016/j.ssci.2014.06.002 0925-7535
- [7] Wang Zhilei, Hua Min, Xu Dayong, Pan Xuhai, Simulation research on human evacuation in subway with a single point fire scenario, Procedia Engineering 84 ( 2014 ) 595 – 602, doi: 10.1016/j.proeng.2014.10.472
- [8] Jae Seong Roh, Hong Sun Ryou, Won Hee Park, Yong Jun Jang, CFD simulation and assessment of life safety in a subway train fire, Tunneling and Underground Space Technology 24 (2009) 447–453, doi:10.1016/j.tust.2008.12.003
- [9] Jing-Hong Wang, Wen-yu Yan, You-ran Zhi, Jun-cheng Jiang, Investigation of the panic psychology and behaviors of evacuation crowds in subway emergencies, Procedia Engineering 135 ( 2016 ) 128 – 137, doi: 10.1016/j.proeng.2016.01.091
- [10] NFPA 130, Standard for Fixed Guideway Transit & Passenger Rail Systems, (2007 edition)
- [11] Jae Seong Roh, Hong Sun Ryou, Won Hee Park, Yong Jun Jang, CFD simulation and assessment of life safety in a subway train fire, Tunnelling and Underground Space Technology 24 (2009) 447–453, doi:10.1016/j.tust.2008.12.003
- [12] Dong-Ho Rie, Myung-Whan Hwang, Seong-Jung Kim, Sung-Wook Yoon, Jae-Woong Ko, Ha-Yong Kim, A study of optimal vent mode for the smoke control of subway station fire, Tunnelling and Underground Space Technology 21 (2006) 300–301, doi:10.1016/j.tust.2005.12.157
- [13] Shaogang Zhang, Yongzheng Yao, Kai Zhu, Kaiyuan Li, Ruifang Zhang, Song Lu, Xudong Cheng, Prediction of smoke back-layering length under different longitudinal ventilations in the subway tunnel with metro train, Tunnelling and underground space technology 53 (2016) 13-21, http://dx.doi.org/10.1016/j.tust.2015.12.013 0886-7798.
- [14] Shaogang Zhang, Xudong Cheng, Yongzheng Yao, Kai Zhu, Kaiyuan Li, Song Lu, Ruifang Zhang, Heping Zhang, An experimental investigation on blockage effect of metro train on the smoke back-layering in subway tunnel fires, Applied Thermal Engineering 99 (2016) 214–223, http://dx.doi.org/10.1016/j.applthermaleng.2015.12.085 1359-4311
- [15] Miao-cheng Weng, Xin-ling Lu, Fang Liu, Xiang-peng Shi, Long-xing Yu, Prediction of backlayering length and critical velocity in metro tunnel fires, Tunnelling and Underground Space Technology 47 (2015) 64–72, http://dx.doi.org/10.1016/j.tust.2014.12.010 0886-7798
- [16] Y.Z. Li, B. Lei, H. Ingason, Study of Critical velocity and backlayering length in longitudinally ventilated tunnel fires, Fire Safety Journal 45 (2010) 361–370
- [17] Ahmed Kashef, Zhongyuan Yuan, Bo Lei, Ceiling temperature distribution and smoke diffusion in tunnel fires with natural ventilation, Fire Safety Journal 62 (2013) 249–255, http://dx.doi.org/10.1016/j.firesaf.2013.09.019
- [18] W. K. Chow, On smoke control for tunnels by longitudinal ventilation, Fire and life safety, Tunnelling and Underground Space Technology, vol. 13, issue 3, (1998), 271–275, http://dx.doi.org/10.1016/S0886-7798(98) 00061-3
- [19] Y. Wu, M.Z.A. Bakar, Control of smoke in tunnel fires using longitudinal ventilation systems - a study of the critical velocity, Fire Safety Journal 35 (2000) 363-390, http://dx.doi.org/10.1016/S0379-7112(00)00031-X
- [20] Falin Chen, Smoke propagation in road tunnels, Applied Mechanics Reviews, 53 (8), 207-218 (2000), doi:10.1115/1.3097350
- [21] W.D. Kennedy, J.A. Gonzalez, J.G. Sanchez, Derivation and application of the SES critical velocity equations, Transactions-American Society of Heating Refrigerating and Air Conditioning Engineers (ASHRAE) vol. 102, pt. 2, (1996), USA ISSN 0001-2505
- [22] J. H. Klote, J. A. Milke, P. G. Turnbull, A. Kashef, M. J. Ferreira, Handbook of Smoke Control Engineering. Atlanta. ASHRAE, ICC, SFPE & NFPA, (2012) USA, ISBN 978-1-936504-24-4
- [23] E. K. Stefopoulos, D. G. Damigos, Design of emergency ventilation system for an underground storage facility, Tunnelling and Underground Space Technology, 22 (3), 293–302, (2007), http://dx.doi.org/10.1016/j.tust.2006.07.002
- [24] Morgan J. Hurley, SFPE Handbook of Fire Protection Engineering, 5th edition, Springer (2016) USA, ISBN-13: 978-1493925643
- [25] NFPA 502, Standard for Road Tunnels, Bridges, and Other Limited Access Highways, (2011 edition).
- [26] Suhas V. Patankar, Numerical Heat Transfer and Fluid Flow. Series in computational methods in mechanics and thermal sciences, McGraw-Hill, (1980) USA, ISBN: 0-07-048740-5
- [27] A. Thom, The flow past circular cylinders at low speeds, Proc. Roy. Soc. London A 141, 651-669, (1933).
- [28] ANSYS Fluent Meshing User's Guide, ANSYS Inc., Release 15.0 (2013) USA, http://www.ansys.com
- [29] Kevin McGrattan, Bryan Klein, Simo Hostikka, Jason Floyd, Fire Dynamics Simulator User’s Guide (Version 5), NIST Special Publication 1019-5, (2007) USA
- [30] You HZ, Faeth GM, An investigation of fire impingement on a horizontal ceiling, NBS-GCR-81-304, National Bureau of standards, Washington D. C., USA (1981)
- [31] J. H. Klote, J. A. Turnbull, P. G. Kashef, M. J. Ferreira, Handbook of Smoke Control Engineering, Atlanta ASHRAE, (2012)
- [32] Deng Jun, Ma Li, Wang Zhen-ping, Xing Zhen, Wang Wei-feng, Simulation Study on Critical Velocity of Longitudinal Ventilation Tunnel Fire, Procedia Engineering 52 (2013) 67 – 71, doi: 10.1016/j.proeng.2013.02.107
Document information
Published on 08/02/19
Accepted on 15/03/18
Submitted on 29/10/17
Volume 35, Issue 1, 2019
DOI: 10.23967/j.rimni.2018.03.005
Licence: CC BY-NC-SA license
