Fragility curves based on the numerical analysis of masonry walls against subsidence, using the Abaqus / CAE software and relying on the pulldown technique
Yaimara Chávez-Pérez1, José A. Ortiz-Lozano1*
1Centro de Ciencias del Diseño y de la Construcción, Universidad Autónoma de Aguascalientes, Edificio 108, Aguascalientes, México
A B S T R A C T
This research uses Abaqus / CAE software as a computational tool, to obtain numerical models that correctly describe the behavior of masonry walls against subsidence. To do this, a mathematical calibration process is performed, the angular distortion values are obtained for different load states and compared with the experimental results presented by the researcher Charry Ablanque in 2010, the influence of the dimensions of the wall is studied in its resistance and the fragility curves of the material are constructed to evaluate the state of damage of the element, for a certain value of angular distortion.
Keywords:
Fragility curves
Angular distortion
Pushover
Pulldown
Subsidence
1. Introduction
The gradual subsidence of the surface caused by subsidence affects several countries in Europe, Asia and Latin America. This is considered a geological phenomenon that takes place due to the extraction of solids (minerals) or fluids (gas, oil, steam and water) from the subsoil, and that manifests itself in gradual or sudden subsidence of the surface and in the generation of cracks in the mass of the granular filling [1].
The first cracking by subsidence was documented, in the Picacho locality, in the Center-South of Arizona, in an area with a high consolidation potential, surrounded by mountains and with a high overexploitation of aquifers.
It is now known that for subsidence and cracking of the land to occur, it must be
there is an incompressible basement with significant irregularities, abatement at the water table and that at least one layer of the filling material has a plasticity of medium to low [2].
'1.1' Types of subsidence
The subsidence is manifested through different mechanisms of deformation of the surface and the interior of the earth's crust, which can be classified into two types: endogenous and exogenous.
The endogenous subsidence refers to the subsidence of the land that is the result of the action of geological processes inside the earth's surface (folds, faults, volcanism and seismicity) and the exogenous refers to the processes of superficial deformation related to the natural or anthropic compaction of soils.
This phenomenon can also be classified depending on the causes that trigger it, such as the activities of extraction of ore in underground galleries, the descent of the water table, the natural dissolution of the land and the washing of materials by the effect of water, the tectonic processes and of sedimentation, the consolidation of soft or organic soils and the extraction of fluids (water, oil or gas) accumulated in underground reservoirs.
'1.2' Numerical analysis using the Finite Element Method
The Finite Element Method allows solving engineering problems that require the use of complex geometries and undistributed loads, this procedure approximates the behavior of a structure with infinite degrees of freedom for another, with approximately the same physical and geometric properties, but with a finite number of degrees of freedom [3].
The softwares that use the Finite Element Method as a calculation tool pass through three basic stages in the analysis:
Stage one or pre-process: consists of defining the physical-mechanical characteristics of the different regions of the domain (geometry, material properties, boundary and mesh conditions), to obtain a model mathematical, that allows to analyze the behavior of a structure.
Stage two or calculation: consists of solving the system of equations that are generated at the conclusion of the pre-process, using the methods of solving simultaneous linear algebraic equations.
Stage three or post-process: analysis of the numerical results obtained at the end of the calculation stage (interpolation and determination of approach errors, application of smoothing operations and determination of magnitudes derived from the values obtained for the nodes)
1.2.1 Pushover and pulldown analysis
Pushover
The pushover analysis is one in which the model of the structure is subjected to a monotonic horizontal load, previously defined, which is increased until the maximum deformation considered is reached or the structure fails [4]. The purpose of the pushover analysis is to evaluate the structural performance, estimating the resistance and deformation capacities using a nonlinear static analysis and comparing these capacities with the demands in the corresponding performance levels.
The pushover analysis is represented by means of the last load capacity curve of the structure and is a simple and very precise method that allows a direct evaluation of the response of a structure, subject to displacements horizontal, generated by earthquakes of considerable magnitude.
Pulldown
The pulldown effect in a structure is considered when one of the supports suffers a vertical displacement. This type of analysis turns out to be similar to what happens when a pushover analysis is carried out, the difference lies in the direction in which the displacements are evaluated.
In the pushover analysis, horizontal displacements are evaluated, while in the pulldown analysis, they are considered vertically, which can be generated by different causes, the most common being the settlements in the terrain. An important feature in this type of vertical settlement is the speed of the displacements, which depends on the type of landslide that affects the structure.
1.2.3 Abaqus / CAE Software
The Abaqus / CAE software is a computational tool that requires high speed equipment and processing capacity; however, it is an efficient alternative for the solution of engineering problems.
The three-dimensional analysis of the models is one of the competitive advantages of the program, which allows the creation of geometric models in other software or within the Abaqus / CAE, it has a wide library of materials that allow the simulation of models with linear characteristics, not linear, isotropic and anisotropic materials, allows to establish different interactions between surfaces, modify the analysis steps through which the modeling process will pass and offers a data output with values of physical magnitudes such as deformations, tensions, turns, forces, reactions and displacements, which can later be analyzed in the visualization module.
'1.3' Behavior of masonry versus subsidence
Subsidence is a geological phenomenon that does not usually cause fatalities, however the material damage can be large [5], mainly in buildings with low resistance to stress.
The tensile strength of the masonry depends on the tensile strength of the brick-mortar joint.
For tensile loads perpendicular to the mortar joints, the collapse is caused by the decrease in the resistance to relative tension in the brick-mortar interface [6].
However, in the case of high-strength brick-mortar joints and the presence of perforated pieces, stress failure can occur in the unit before joining.
The behavior of the masonry under loads of uniaxial tension has been part of several investigations and experimental campaigns, all with the objective of establishing an essay that successfully describes the behavior of the material in front of this solicitation.
Backes (1985) developed a study in which he analyzed the stress behavior of the horizontal joints of the masonry, where he obtained load-displacement curves by displacement control and observed two types of failure in the joints, the first of them was presented as a diagonal and staggered crack through the horizontal and vertical joints and the second were small, almost vertical cracks through the units and vertical joints
Currently there are only two groups of tests to determine the uniaxial tensile strength of the brick-mortar interface (direct tension tests and bending tests), although part of the scientific community recommends using direct voltage tests considering that these they offer results closer to reality.
- 1.3.1 Analysis of masonry walls using fragility curves
The masonry structures have been the most affected by differential subsidence and are highly vulnerable to this phenomenon [7]. One example is the cases reported in the central valley of Mexico, where there were numerous economic damages in buildings of small and medium height. This confirms the importance of carrying out a structural assessment of buildings where cracks and fissures appear in their walls.
The fragility curves represent a very efficient method to evaluate the damage level of a masonry structure, because they allow to establish a measure of vulnerability, in probabilistic terms, of the behavior of a given system. These are elaborated based on a probability distribution of normal logarithm, whose density function corresponds to the following expression [4]:
Failed to parse (syntax error): \frac{(LnX-ϻ)\mbox{ˆ}2}{2\cdot \sigma \mbox{ˆ}2}
Where ϻ and σ are the mean and the standard deviation of the natural logarithm of the variable X.
The variable X referred to in this research corresponds to the maximum value of angular distortion and those associated with 50% and 65% of the maximum tension value, which represent levels of severe, mild and moderate damage.
2 Methodology
Numerical methodology:
Use micro-modeling to obtain and determine a numerical model capable of reproducing the real behavior of a masonry wall under the effect of the pushover.
Compare the experimental results obtained by Daniel Charry Ablanque in 2010, as part of his PhD thesis, with the numerical results to calibrate the model.
From the calibrated model the wall will be subjected to the pulldown effect (vertical load) in order to simulate the effect of the differential settlements in the structure and obtain the angular distortion values for the different load values.
Construct the fragility curves of the material, by means of which a probabilistic analysis of the behavior of the wall will be carried out, establishing the probability that the structural response of the same exceeds a certain limit state, as a function of the angular distortion.
Analyze the results to assess the damage status of a masonry structure, depending on the value of the angular distortion to which it is subjected.
2.1 Calibration of the numerical model.
The calibration process took into account the geometrical characteristics and properties of the materials used by Charry Ablanque in his experimental campaigns I and III. The percentage difference or relative error between the numerical and experimental models corresponds to the following expression [8]:
Failed to parse (syntax error): {\textstyle Dif\, \%=\, \frac{⎪{U}_{e\, \left( i\right) }-{U}_{m\, \left( i\right) \, }⎢}{{U}_{m\, \left( i\right) \, }}}
Where:
Ue (i): displacement corresponding to the load (i) in the experimental test.
Um (i): displacement corresponding to the same load in mathematical modeling.
- '2.1.1' Calibration experimental campaign I.
Charry during his first experimental campaign, analyzed 10 walls of 1.20 m x 1.0 m, subjected to 10 different loading states. The specimens were composed of 16 rows of solid brick of 290 x 140 x 50 mm, whose coefficient of friction, cohesion, and compressive strength correspond to the values of 45 o, 0.32 MPa and 11.6 MPa, respectively.
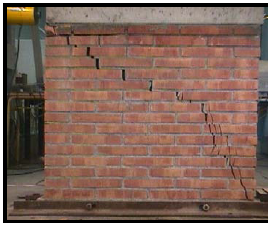
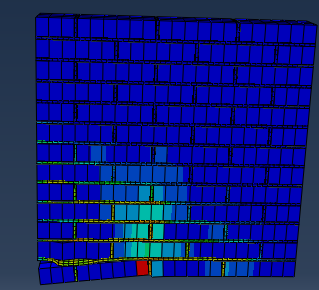
For the calibration, the maximum vertical load value considered was 150 kN and 80 kN of horizontal load, which caused two types of faults in the wall (tensile fracture of the bricks and sliding of the joints) (See figure 1).
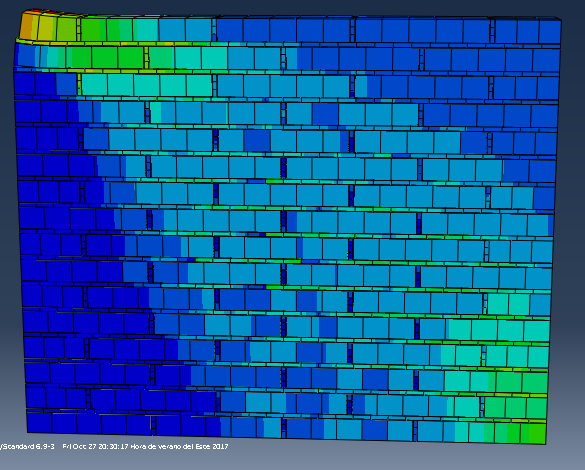
The percentage difference calculated between the numerical model and the experimental model was 13.57%, considering displacements of 31.24 mm in the numerical model and 27 mm in the experimental model (See figure 2).
2.1.2 Experimental campaign calibration III
The third experimental campaign was carried out on walls on a reduced scale with dimensions of 300 x 250 x 35 mm. In total, 15 walls were tested, whose mechanical properties were obtained during the development of the experiments, resulting in a cohesion, a coefficient of friction and a compressive strength of 0.46 MPa, 33.42 o and 10.65 MPa respectively.
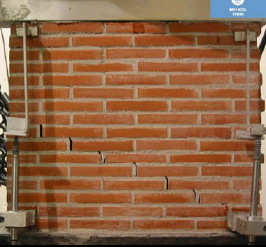
For the calibration, the maximum vertical load value considered was 9 kN and 5 kN of horizontal load, which caused sliding in the joints of the wall (See Figure 3). The
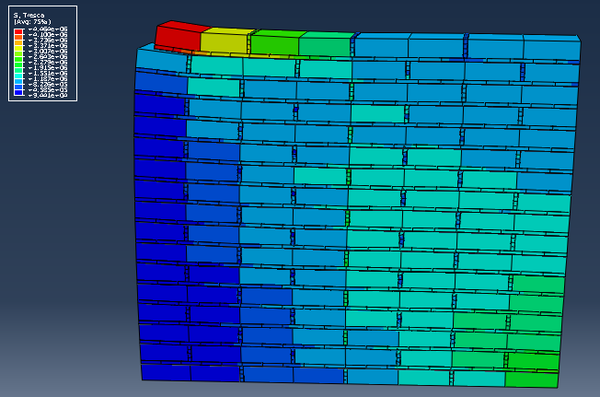
percentage difference between the numerical model and the experimental it was 12.39 %, for maximum values of displacements of 0.114 mm in the numerical model and 0.1 mm in the experimental one (See figure 4).
2.2 Experiment design.
In the second stage of the investigation, the subsidence numerical models are analyzed, which were considered isolated, unconfined and not reinforced walls, composed of solid pieces of red partition of 29 x 14 x 7 cm and mortar joints of 1 cm, whose dimensions vary between the experimental campaign I and the experimental campaign II.
Experimental campaign I
Isolated wall, not confined and not reinforced, 1 m x 1 m, subjected to vertical loads of presión of 270 kN / m2 and 300 KN / m2, in the middle of its base.
Experimental campaign II
Isolated, unconfined and non-reinforced walls of 1 m x 1 m, 1.5 m x 1.5 m and 2 m x 2 m, subjected to a vertical pressure load of 500 KN / m2, in the middle of its base.
2.2.1 Materials.
Partitions
The behavior of the partitions was reproduced through the Mohr-Coulomb constitutive model, whose basic parameters hey are the coefficient of friction, the cohesion and the angle of dilatation.
A coefficient of friction of 35o, a cohesion of 0.4 MPa and a dilatancy angle of 0 was considered, following the recommendations of E. Dumova-Jovanoska & S. Churilov for clay partitions.
In addition to the Mohr-Coulomb constitutive model, the density of the materials (Υ) and an elastic model defined by the Young's modulus (E) and the Poisson's coefficient (ν) were taken into account (See table 1).
| Density
(kN/m3) |
Young's module
(kN/m2) |
Poisson's coefficient |
| 13 | 4,170,000 | 0.15 |
Mortar
The simulation of the behavior of the mortar was made through the Drucker-Prager plastic damage model.
This constitutive model requires five basic input parameters, the internal friction angle, the angle of expansion, the range of stresses that cause plastic deformation, the yield stress and the absolute plastic deformation, in addition to the Young's modulus (E), the Poisson's coefficient (ν) and the density (Υ) of the material.
The angle of friction and the angle of dilatation, according to what was proposed by Oller in 2001, are considered equal to zero for concretes that do not present damages and take their maximum value (Ф = 36 ° and ψ = 15 °) when
This is defective. In this case, a mortar without structural damage is considered, so the angle of friction and the angle of dilatation are considered equal to 0.
"The range of stresses that cause plastic deformation (kp) varies between zero and one; for kp = 0 there is no damage to the material and for kp = 1 the plastic damage is established in its entirety "[3]. In numerical modeling, the range of stresses that causes plastic deformation equal to 0.8 is established.
The plastic yield stress depends on the compressive strength of the mortar, for a resistance of 8 MPa, the tension is considered 4 MPa [9].
The modulus of elasticity was considered to be 4,170,000 kN / m2, the Poisson's coefficient of 0.2 and the mortar density of 20 kN / m3.
2.2.2 Interactions.
The piece-mortar interaction is defined as a surface to surface contact, considering the elastic and inelastic parameters of the joints.
Elastic parameters
Oliveira in 2003 uses several analytical criteria to determine the rigidity parameters of the mortar-brick joints, determining that these depend fundamentally on the vertical precompression load. In this case, the normal stiffness was considered equal to 420.3 N / mm3 and the tangential rigidity equal to 195.49 N / mm3, recommended values for loads greater than 250 kN.
Inelastic parameters
The inelastic parameters of the boards were obtained from the research carried out by Álvaro Viviescas in 2009 (See table 2).
| Tension | Cutting | ||
| ft (MPa) | G´f (MPa) | c (MPa) | G´´f (MPa) |
| 0.55 | 0.13 | 0.4 | 0.045 |
2.2.3 Meshing.
"The number of nodes gives finite second-order elements greater precision in mathematical analysis, but they make it difficult to converge in complex nonlinearity problems" [10], which is why a finite element of the first order was used. type C3D8 and a mesh density of 5 cm (See figure 5).
3 Results
At the end of the calibration process, a vertical load was applied in the middle of the base of the walls and the other half was embedded, to simulate the effects of differential land subsidence. These numerical models were analyzed in two experimental campaigns.
Experimental campaign I
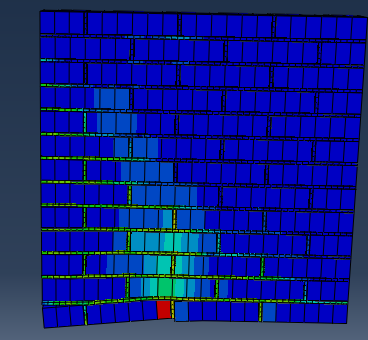
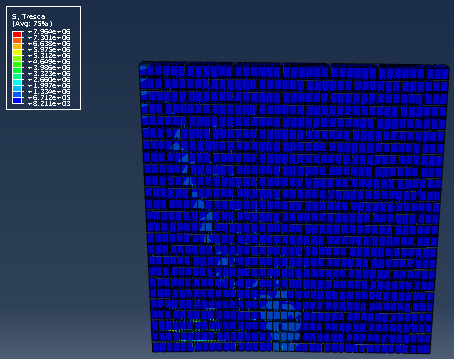
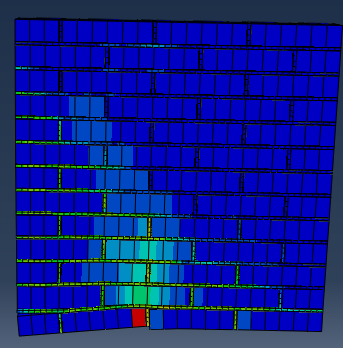
The experimental campaign I considered two walls of 1 mx 1 m with different load values applied in the middle of its base, observing the areas where the highest stresses accumulate (See Figure 6) and measuring the values of angular distortion, until reaching the failure of the element (See figures 7 and 8).
Experimental campaign II
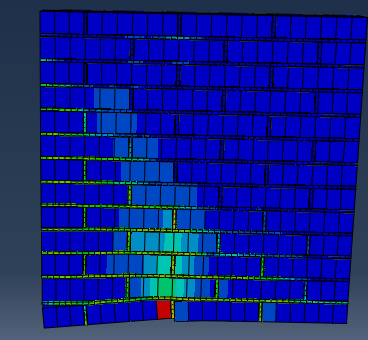
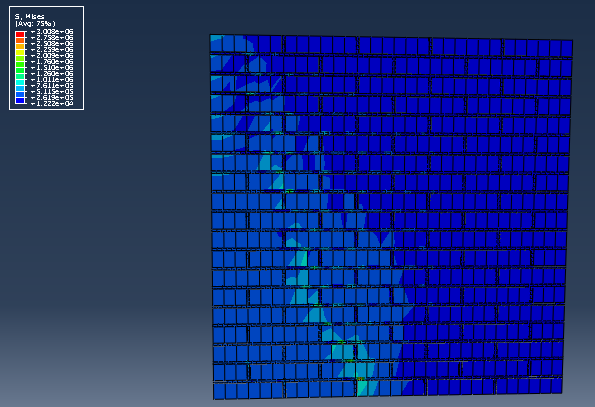
In experimental campaign II, three walls were modeled with variable dimensions (1 m x 1 m, 1.5 m x 1.5 m and 2 m x 2 m), considering the same load value, applied to half of its base. In the simulation, the zones where the highest stresses are concentrated were analyzed (See figures 9, 10 and 11) and the angular distortion values were obtained (See figures 12 and 13).
Figure 10: 1.5 m x 1.5 m wall, load 500 kN / m2.
</div>
Figure 11: 2.0 m x 2.0 m wall, load 500 kN / m2.
</div>
4 Discussion of results
The numerical results were compared with the experimental tests developed by Daniel Lara, concluding that in both cases the tensions begin at the base of the wall and extend towards the sides with an inclination of approximately 45 o (See figures 14 and 15).
When the angular distortions reach a value of approximately 0.04, the material begins to have a plastic behavior, reaching its failure. East valor concuerda con el propuesto por Meli in 2014, to evaluate the state of damage of a masonry wall, as opposed to differential settlements.
Experimental campaign I
The angular distortion stress curves in the wall of 1 mx 1 m, show a greater ductility for lower load conditions, presenting angular distortions greater than 0.03, with smaller stresses and even without reaching the wall failure (See figure 16) .
The difference in the behavior of the wall, is mainly due to the state of efforts to which it is subjected in its initial stage, which agrees with what was stated by Meli in 2014, where it states that the initial effort state defines the type of failure to be presented.
Experimental campaign II
During the second experimental campaign, the behavior of 1.5 m x 1.5 m and 2 m x 2 m walls was analyzed, which were subjected to the same load value, applied in its base, to simulate a differential settlement.
The 2 m x 2 m wall shows lower values of angular distortion than the 1.5 m x 1.5 m wall, for similar load values, although in both it agrees that the element failure occurs for a distortion value of approximately 0.04. The which shows that by increasing the dimensions of the wall (maintaining the width / length ratio equal to 1), its resistance
before differential settlements, needing greater efforts to reach their failure.
4.1 Fragility curves.
Fragility curves establish a measure of vulnerability, in probabilistic terms, of the behavior of a given system [2]. These depend on the density function discussed earlier in the introduction.
Walls of 1 m x 1 m
The three walls of 1 mx 1 m subjected to differential subsidence, were used to construct the first fragility curves, taking into account the values of angular distortion, corresponding to light, moderate and severe damage and calculating their natural logarithm, mean and standard deviation (See table 3) (See figure 17).
The walls of 1.5 mx 1.5 m and 2 mx 2 m subjected to differential subsidence, were used to construct the second fragility curves, taking into account the values of angular distortion, corresponding to slight, moderate and severe damage and calculating their natural logarithm, average and standard deviation (See table 4) (See figure 18).
| Experimental campaign I | Angular distortion in % | Ln of angular distortion in % | ||||
| 0,5 Tension
maximum |
0,65 Tension
maximum |
Tension
maximum |
0,5 Tension
maximum |
0,65 Tension
maximum |
Tension
maximum | |
| 1 m x 1 m P=250kN/m2 | 1 | 1,8 | 6 | -4,605 | -4,017 | -2,813 |
| 1 m x 1 m P=300kN/m2 | 1,2 | 2 | 5 | -3,507 | -3,912 | -2,996 |
| 1 m x 1 m P=350kN/m2 | 1,4 | 1,89 | 6 | -4,605 | -3,969 | -2,813 |
| Half | 0,0120 | 0,0190 | 0,0567 | -4,2390 | -3,9660 | -2,8740 |
| Standard deviation | 0,00943 | 0,000818 | 0,00471 | 0,518 | 0,0429 | 0,086 |
| Experimental campaign II | Angular distortion in % | Ln of angular distortion in % | ||||
| 0,5 Tension
maximum |
0,65 Tension
maximum |
Tension
maximum |
0,5 Tension
maximum |
0,65 Tension
maximum |
Tension
maximum | |
| 1 m x 1 m P=350kN/m2 | 1.4 | 1.89 | 6 | -4.269 | -3.969 | -2.813 |
| 1.5 m x 1.5 m P=350kN/m2 | 1.9 | 1.98 | 5.2 | -3.963 | -3.922 | -2.957 |
| 2 m x 2 m P=350kN/m2 | 0.7 | 1.0 | 4.0 | -4.962 | -4.605 | -3.219 |
| Half | 0.0133 | 0.0162 | 0.051 | -4.398 | -4.165 | -2.996 |
| Standard deviation | 0.00492 | 0.00442 | 0.00822 | 0.418 | 0.311 | 0.168 |
4 Conclusions
The main objective of this research is to evaluate the behavior of masonry walls against subsidence, using the fragility curves. All the numerical process by which it was transited to obtain the expected results, throw the following conclusions:
1- The computational modeling using the software Abaqus / CAE, based on the Finite Element Method, is a very accurate tool for the analysis of masonry walls against subsidence. What allowed to obtain a calibrated numerical model and the values of angular distortion for walls of 1.0mx1.0m, 1.5mx1.5m and 2.0mx2.0m.
2- The cracks in the walls caused by the subsidence begin at the base and extend towards the sides with a slope of approximately 45 o.
3- In the angular distortions it is observed that when reaching a value of approximately 0.04, the material begins to have a plastic behavior, reaching its failure. This value agrees with that proposed by Meli in 2014, to evaluate the damage status of a masonry wall, as opposed to differential settlements.
4- The curves of effort angular distortion in the wall of 1mx1m, show a greater ductility for lower load conditions, to present angular distortions greater than 0.03, with smaller efforts and even without reaching the wall failure.
5- The 2mx2m wall shows lower values of angular distortion than the 1.5mx1.5m wall, for similar load values, although in both it agrees that the element failure occurs for a distortion value of approximately 0.04. Which shows that by increasing the dimensions of the wall (maintaining the width / length ratio equal to 1), its resistance to differential settlements grows, requiring greater efforts to reach its failure.
6- Fragility curves are a very useful tool to assess the damage status of a masonry wall.
5 References
[1]. Jesús, P.M. and A.F. Jorge, Análisis multicapa, de la subsidencia en el valle Querétaro, México, in Revista Mexicana de Ciencias Geológicas. 2007: México. p. 389 a 402.
[2]. Luis, H.-C., et al., Fragility curves for thin-walled cold - formed steel wall frames affected by ground settlements due to land subsidence in Thin-WalledStructures. 2014: Aguascalientes, México.
[3]. Oller, S., Mecánica de la fractura. Enfoque global, ed. P. Edición. 2001.
[4]. Ramos, R.F.J., Simulación numérica y experimental de estructuras de acero rolado en frío por hundimientos diferenciales asociados al fenómeno de la subsidencia. 2013, Universidad Autónoma de Aguascalientes: Aguascalientes, México.
[5]. Roberto, T., et al., Subsidencia del terreno. Ground subsidence 2009.
[6]. J., L., O. S., and O. E., Cálculo del comportamiento de la mampostería mediante elementos finitos. 1ra edición ed. 1998, Barcelona, España.
[7]. Ruiz, G. Jorge, and N. Miguel, Drift-based fragility assessment of confined masonry walls in seismic zones. Engineering Structures, 2009.
[8]. C.a, T., Comparison of non linear elastic and electroplating models., ed. A.P.N. 94-1076. 1994.
[9]. P. Kmiecik, M.K., Modelling of reinforced concrete structures and composite structures with concrete strength degradation taken into consideration. 2011.
[10]. Quintero, J.C., Validación de métodos gráficos para determinar la capacidad de carga a partir de resultados de la modelación matemática, in Departamento de Ingeniería Civil 2013, Instituto Superior Politécnico ¨José Antonio Echeverría¨: La Habana.Document information
Published on 22/01/20
Accepted on 12/11/19
Submitted on 11/10/18
Volume 36, Issue 1, 2020
DOI: 10.23967/j.rimni.2019.11.002
Licence: CC BY-NC-SA license
Share this document
Keywords
claim authorship
Are you one of the authors of this document?
