| Line 10: | Line 10: | ||
This research uses Abaqus / CAE software as a computational tool, to obtain numerical models that correctly describe the behavior of masonry walls against subsidence. To do this, a mathematical calibration process is performed, the angular distortion values are obtained for different load states and compared with the experimental results presented by the researcher Charry Ablanque in 2010, the influence of the dimensions of the wall is studied in its resistance and the fragility curves of the material are constructed to evaluate the state of damage of the element, for a certain value of angular distortion. | This research uses Abaqus / CAE software as a computational tool, to obtain numerical models that correctly describe the behavior of masonry walls against subsidence. To do this, a mathematical calibration process is performed, the angular distortion values are obtained for different load states and compared with the experimental results presented by the researcher Charry Ablanque in 2010, the influence of the dimensions of the wall is studied in its resistance and the fragility curves of the material are constructed to evaluate the state of damage of the element, for a certain value of angular distortion. | ||
| − | |||
| − | |||
| − | |||
| − | |||
| − | |||
| − | |||
| − | |||
| − | |||
| − | |||
| − | |||
| − | |||
| − | |||
| − | |||
| − | |||
| − | |||
| − | |||
| − | |||
| − | |||
| − | |||
| − | |||
| − | |||
| − | |||
| − | |||
| − | |||
| − | |||
| − | |||
| − | |||
| − | |||
| − | |||
| − | |||
| − | |||
| − | |||
| − | |||
| − | |||
| − | |||
| − | |||
| − | |||
| − | |||
| − | |||
| − | |||
| − | |||
| − | |||
| − | |||
| − | |||
| − | |||
| − | |||
| − | |||
| − | |||
| − | |||
| − | |||
| − | |||
| − | |||
| − | |||
| − | |||
| − | |||
| − | |||
| − | |||
| − | |||
| − | |||
| − | |||
| − | |||
=4 Discussion of results= | =4 Discussion of results= | ||
Revision as of 18:16, 16 October 2018
Fragility curves based on the numerical analysis of masonry walls against subsidence, using the Abaqus / CAE software and relying on the pulldown technique
Yaimara Chávez-Pérez1, José A. Ortiz-Lozano1*
1Centro de Ciencias del Diseño y de la Construcción, Universidad Autónoma de Aguascalientes, Edificio 108, Aguascalientes, México
A B S T R A C T
This research uses Abaqus / CAE software as a computational tool, to obtain numerical models that correctly describe the behavior of masonry walls against subsidence. To do this, a mathematical calibration process is performed, the angular distortion values are obtained for different load states and compared with the experimental results presented by the researcher Charry Ablanque in 2010, the influence of the dimensions of the wall is studied in its resistance and the fragility curves of the material are constructed to evaluate the state of damage of the element, for a certain value of angular distortion.
4 Discussion of results
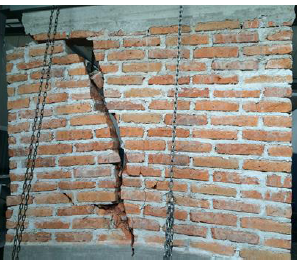
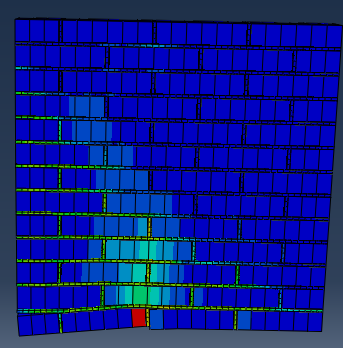
The numerical results were compared with the experimental tests developed by Daniel Lara, concluding that in both cases the tensions begin at the base of the wall and extend towards the sides with an inclination of approximately 45 o (See figures 7 and 8).
When the angular distortions reach a value of approximately 0.04, the material begins to have a plastic behavior, reaching its failure. East valor concuerda con el propuesto por Meli in 2014, to evaluate the state of damage of a masonry wall, as opposed to differential settlements.
Experimental campaign I
The angular distortion stress curves in the wall of 1 mx 1 m, show a greater ductility for lower load conditions, presenting angular distortions greater than 0.03, with smaller stresses and even without reaching the wall failure (See graphic 8) .
The difference in the behavior of the wall, is mainly due to the state of efforts to which it is subjected in its initial stage, which agrees with what was stated by Meli in 2014, where it states that the initial effort state defines the type of failure to be presented.
Experimental campaign II
During the second experimental campaign, the behavior of 1.5 m x 1.5 m and 2 m x 2 m walls was analyzed, which were subjected to the same load value, applied in its base, to simulate a differential settlement.
The 2 m x 2 m wall shows lower values of angular distortion than the 1.5 m x 1.5 m wall, for similar load values, although in both it agrees that the element failure occurs for a distortion value of approximately 0.04. The which shows that by increasing the dimensions of the wall (maintaining the width / length ratio equal to 1), its resistance
before differential settlements, needing greater efforts to reach their failure.
4.1 Fragility curves.
Fragility curves establish a measure of vulnerability, in probabilistic terms, of the behavior of a given system [2]. These depend on the density function discussed earlier in the introduction.
Walls of 1 m x 1 m
The three walls of 1 mx 1 m subjected to differential subsidence, were used to construct the first fragility curves, taking into account the values of angular distortion, corresponding to light, moderate and severe damage and calculating their natural logarithm, mean and standard deviation (See table 3) (See graph 9).
The walls of 1.5 mx 1.5 m and 2 mx 2 m subjected to differential subsidence, were used to construct the second fragility curves, taking into account the values of angular distortion, corresponding to slight, moderate and severe damage and calculating their natural logarithm, average and standard deviation (See table 4) (See figure 10).
| Experimental campaign I | Angular distortion in % | Ln of angular distortion in % | ||||
| 0,5 Tension
maximum |
0,65 Tension
maximum |
Tension
maximum |
0,5 Tension
maximum |
0,65 Tension
maximum |
Tension
maximum | |
| 1 m x 1 m P=250kN/m2 | 1 | 1,8 | 6 | -4,605 | -4,017 | -2,813 |
| 1 m x 1 m P=300kN/m2 | 1,2 | 2 | 5 | -3,507 | -3,912 | -2,996 |
| 1 m x 1 m P=350kN/m2 | 1,4 | 1,89 | 6 | -4,605 | -3,969 | -2,813 |
| Half | 0,0120 | 0,0190 | 0,0567 | -4,2390 | -3,9660 | -2,8740 |
| Standard deviation | 0,00943 | 0,000818 | 0,00471 | 0,518 | 0,0429 | 0,086 |
| Experimental campaign II | Angular distortion in % | Ln of angular distortion in % | ||||
| 0,5 Tension
maximum |
0,65 Tension
maximum |
Tension
maximum |
0,5 Tension
maximum |
0,65 Tension
maximum |
Tension
maximum | |
| 1 m x 1 m P=350kN/m2 | 1.4 | 1.89 | 6 | -4.269 | -3.969 | -2.813 |
| 1.5 m x 1.5 m P=350kN/m2 | 1.9 | 1.98 | 5.2 | -3.963 | -3.922 | -2.957 |
| 2 m x 2 m P=350kN/m2 | 0.7 | 1.0 | 4.0 | -4.962 | -4.605 | -3.219 |
| Half | 0.0133 | 0.0162 | 0.051 | -4.398 | -4.165 | -2.996 |
| Standard deviation | 0.00492 | 0.00442 | 0.00822 | 0.418 | 0.311 | 0.168 |
4 Conclusions
The main objective of this research is to evaluate the behavior of masonry walls against subsidence, using the fragility curves. All the numerical process by which it was transited to obtain the expected results, throw the following conclusions:
1- The computational modeling using the software Abaqus / CAE, based on the Finite Element Method, is a very accurate tool for the analysis of masonry walls against subsidence. What allowed to obtain a calibrated numerical model and the values of angular distortion for walls of 1.0mx1.0m, 1.5mx1.5m and 2.0mx2.0m.
2- The cracks in the walls caused by the subsidence begin at the base and extend towards the sides with a slope of approximately 45 o.
3- In the angular distortions it is observed that when reaching a value of approximately 0.04, the material begins to have a plastic behavior, reaching its failure. This value agrees with that proposed by Meli in 2014, to evaluate the damage status of a masonry wall, as opposed to differential settlements.
4- The curves of effort angular distortion in the wall of 1mx1m, show a greater ductility for lower load conditions, to present angular distortions greater than 0.03, with smaller efforts and even without reaching the wall failure.
5- The 2mx2m wall shows lower values of angular distortion than the 1.5mx1.5m wall, for similar load values, although in both it agrees that the element failure occurs for a distortion value of approximately 0.04. Which shows that by increasing the dimensions of the wall (maintaining the width / length ratio equal to 1), its resistance to differential settlements grows, requiring greater efforts to reach its failure.
6- Fragility curves are a very useful tool to assess the damage status of a masonry wall.
5 References
1. Jesús, P.M. and A.F. Jorge, Análisis multicapa, de la subsidencia en el valle Querétaro, México, in Revista Mexicana de Ciencias Geológicas. 2007: México. p. 389 a 402.
2. Luis, H.-C., et al., Fragility curves for thin-walled cold - formed steel wall frames affected by ground settlements due to land subsidence in Thin-WalledStructures. 2014: Aguascalientes, México.
3. Oller, S., Mecánica de la fractura. Enfoque global, ed. P. Edición. 2001.
4. Ramos, R.F.J., Simulación numérica y experimental de estructuras de acero rolado en frío por hundimientos diferenciales asociados al fenómeno de la subsidencia. 2013, Universidad Autónoma de Aguascalientes: Aguascalientes, México.
5. Roberto, T., et al., Subsidencia del terreno. Ground subsidence 2009.
6. J., L., O. S., and O. E., Cálculo del comportamiento de la mampostería mediante elementos finitos. 1ra edición ed. 1998, Barcelona, España.
7. Ruiz, G. Jorge, and N. Miguel, Drift-based fragility assessment of confined masonry walls in seismic zones. Engineering Structures, 2009.
8. C.a, T., Comparison of non linear elastic and electroplating models., ed. A.P.N. 94-1076. 1994.
9. P. Kmiecik, M.K., Modelling of reinforced concrete structures and composite structures with concrete strength degradation taken into consideration. 2011.
10. Quintero, J.C., Validación de métodos gráficos para determinar la capacidad de carga a partir de resultados de la modelación matemática, in Departamento de Ingeniería Civil 2013, Instituto Superior Politécnico ¨José Antonio Echeverría¨: La Habana.
Document information
Published on 22/01/20
Accepted on 12/11/19
Submitted on 11/10/18
Volume 36, Issue 1, 2020
DOI: 10.23967/j.rimni.2019.11.002
Licence: CC BY-NC-SA license
Share this document
Keywords
claim authorship
Are you one of the authors of this document?


