(Created page with "<span style="color:#FFFFFF; background:#ffffcc"><span id="article_es"></span>Pulsa aquí para ver la versión en Español (ES)</span> ==== Abstract ==== The c...") |
m (Scipediacontent moved page Draft Content 123150708 to Cabero Marin 2014a) |
(No difference)
| |
Latest revision as of 13:51, 29 March 2019
Pulsa aquí para ver la versión en Español (ES)
Abstract
The change in classroom methodologies has in many cases come with the emergence of the Internet and 2.0 tools (mainly social networks). The development of a constructivist approach focused on group work means that students’ training can be improved by this type of resources as they foster important aspects such as socialization, information searching and the achievement of a common goal, etc. This work aims to analyze the information and communication technology (ICT) university learning processes and student preferences for working either inside or outside the classroom at the universities of Córdoba, Sevilla, Huelva and the Basque Country. Our objectives are focused on knowing: the students’ feelings on social software and its influence on collaborative and group work;) the social network tools they use and, if there are any differences between these universities in terms of collaborative work perceptions. The instrument for data gathering was a four-dimensional questionnaire. The main results are: students are interested in group work as a type of classroom methodology; students have little knowledge of technology tools (except for social networks). These results provide a reliable diagnostic instrument for the variables that comprise this tool.
1. Theoretical approach
Recent times have seen universities transformed by events ranging from joining the European Higher Education Area (EHEA), the extension of methodologies and collaborative work or case studies, and the incorporation of Information and Communication Technologies (ICT) in general, and the Internet and Web 2.0, in particular.
As noted by Shang et al. (2011), the arrival of Web 2.0 in education means that the learning processes developed by students are now of a more social, dynamic and personal nature whereby explicit knowledge is produced and interacting with others is an ongoing process. Thus, education is more creative, participatory and socializing. We share Túñez and Sixto’s opinion (2012: 78-79) that «Web 2.0 is not a technological change occurring in isolation, but falls within a model that understands learning as the result of the interaction and collaboration of people and places, with the student at the center of the process; so, it has to be understood as an instrument that facilitates model change in the learning process».
Among the Web 2.0 tools, «social media» and social networks in the university context have the potential to increase student participation, enhance their creativity and add a new perspective to the process of socialization. As Imbernón, Silva and Guzman (2011) state, they tend to provide a space for more interactive and dynamic learning.
As several studies (Marquis, 2011; Callaghan & Bower, 2012; De-Gouveia, 2012; Barajas & Fabiola, 2013, Alvarez & Lopez, 2013; Bernal & Angulo, 2013) have pointed out, these possibilities have led to social networks increasingly embedding themselves in student learning processes, with particular reference to cooperative and collaborative work.
With respect to collaborative work, different studies (Cabero, 2003; Gros, 2008, Martin, Dominguez & Parallel, 2011) have shown that social media yield a number of advantages such as: improving social relationships, increasing tolerance within the group, enhancing student participation, developing intrinsic motivation and self-esteem, advancing social skills and supporting group integration and cohesion, as well as fomenting democratic participation and the acquisition of leadership skills. .
However, the use of social networks for collaborative work depends on whether the student has a positive attitude towards this phenomenon, or adequate levels of interpersonal intelligence (Gardner, 2001). As indicated by Shen, Cho and others (2013), students’ perceived self-efficacy with regard to group work conditioned the way such work developed; and this is related to their attitude towards teamwork and social presence, showing subjects in mediated communication environments (Kim, 2011). One cannot forget that students’ negative attitude towards technology or mode of use impacts on the type of interactions established and the goals achieved by means of the same (Hung & Cheng, 2013), and that not all students have a positive attitude towards the use of social networks in their academic training (Irwin, Ball & al., 2012). The research we have developed deals with student perceptions on working in groups and collaborative and social networking. Technologies, collaborative environments and social media will, according to several Horizon reports, figure prominently in training centers (García, Peña-López & al., 2010; Durall, Gros & al., 2012).
2. Method
2.1. Starting objectives
This research is part of a more extensive investigation being carried out internationally. The results obtained are taken from a Faculty of Education Sciences study at the universities of Córdoba, Huelva, Sevilla and the Basque Country among Primary Education undergraduates. These universities were selected as a result of the positive response and willingness to collaborate among professors at these institutions, hence the choice of this study population.
The objectives were:
• To know students’ perceptions of social software and collaborative group work versus individual work.
• To know whether there are differences between each university regarding perceptions of group and individual work.
• To know which social software tools students prefer to use.
2.2. Research methodology
The type of sample used is non-probability incidental, meaning the researcher selects the sample directly and intentionally, because it is easily accessible and is representative of the population (Sabariego, 2004). The sample consisted of 525 subjects from an initial population of 728 at the four universities.
The methodological approach is quantitative, with a non-experimental and non-correlational descriptive design. To gather the information, a questionnaire designed by Anderson, Poellhuber & McKerlich (2010) called Social Software survey with unpaced undergrad was adapted to consist of 91 items distributed across the following dimensions: identification, learning preference, technical and technological skills, experience in social software, social software for learning, confidence in the ability to perform distance learning and conclusion.
The adaptation of the instrument involved the incorporation of an identification variable, university of origin, and the deletion of the last two dimensions of the original questionnaire, because they did not conform to the objectives we pursued. The final instrument was composed of 67 items, divided into: General (college, gender...) (6 items), preference for working in groups or individually (27 items), technical and technological skills (15 items), experience with Web 2.0 tools (10 items) and use of different social software tools in distance learning (9 items).
The questionnaire was distributed via the Internet, and is available on: www.sav.us.es/surveys/redsocial/index.htm. It offers a Likert-type construction with five response options (SD=strongly disagree, D=disagree, N=neither agree nor disagree, A=agree, SA= strongly agree).
In order to determine the internal consistency of the instrument, Cronbach’s alpha reliability test was applied both to the questionnaire as a whole and to each of its dimensions. The following values were obtained: total Cronbach’s alpha instrument: 0.860; Cronbach’s alpha dimension «learning preference»: 0.800; Cronbach’s alpha dimension «technical and technological skills»: 0.902; Cronbach’s alpha ‘social software experience’: 0.818; Cronbach’s alpha dimension ‘social software for learning’»: 0.835.
According to Mateo (2004), these scores can be considered high and show that the instrument is reliable. We also performed the item-total correlation (the results are not published here to avoid making the reading of this paper tedious), but the values obtained clearly indicated that eliminating any of the instrument’s items would not increase its reliability.
3. Results of the study
3.1. Dimension 1: Descriptive data
The first thing we highlight is that the vast majority of students who filled in the questionnaire were women (76.76%, versus 23.24% who were men); the proportion was almost identical for the four universities.
In regard to age, the majority was aged between 17 and 20 (58.90%), followed by 21- to 24-year-olds (26.33%). These data are not uniform at the four universities since the survey majority at the Basque Country university was aged 21 to 24 (36.09%). When asked about whether they had received training on the Internet the figures were fairly similar at the four universities, with 54.21% stating they had and 45.79% stating they had not.
Significantly, the vast majority of students indicated that they regularly accessed the Internet for educational purposes (93.54%), a figure that was similar in samples from the four universities. This confirms that the usage of the Internet as an educational tool is now common in higher education institutions. We also point out that most students are well-equipped, with 41.63% owning an integrated headset and 88.99% a webcam. This equipment facilitates their use of ICT tools in training programs, which incorporate remote videoconferencing.
3.2. Dimension 2: Learning preferences
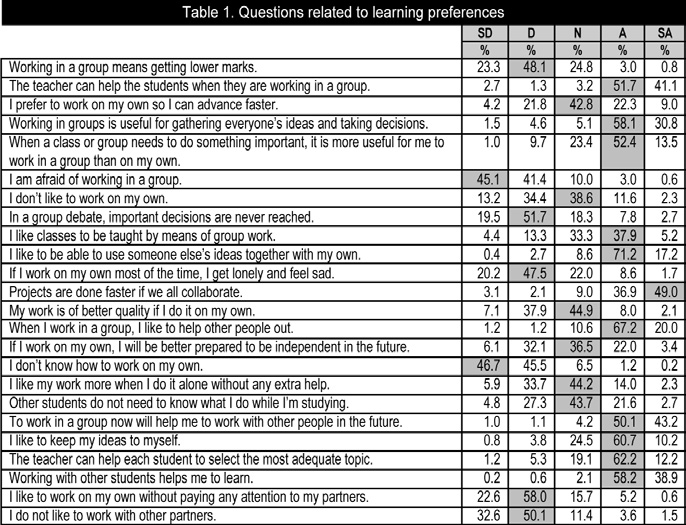
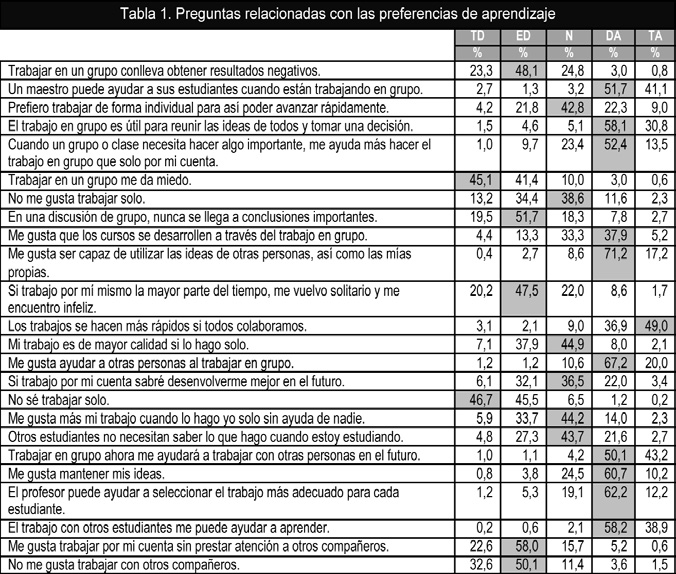
The second part of the questionnaire was designed to understand the students’ learning preferences (table 1).
It is evident that although the vast majority of students surveyed know how to work individually, 92.2% stated that they «strongly agree» or «disagree» with the statement: «I do not know how to work on my own». The study clearly indicates that students prefer to work in groups, since the percentage of «agree» and «strongly agree» clearly exceeds the other options:
• Working in groups is useful for gathering everyone’s ideas and taking decisions (88.9%).
• I like to be able to use someone else’s ideas together with my own (88.4%).
• Projects are done faster if we all collaborate (85.9%).
• Working with other students helps me to learn (97.1%).
This is also evident in the items which were formulated in a negative way, where the options with higher percentages were those labeled as «totally agree» or «totally disagree»:
• Working in a group means getting lower marks (71.4%).
• I am afraid of working in a group (86.5%).
• I don’t like to work on my own (47.6%).
• In a group debate, important decisions are never reached (70.2%).
• I like to work on my own without paying any attention to my partners (80.6%).
• I do not like to work with other partners (82.7%).
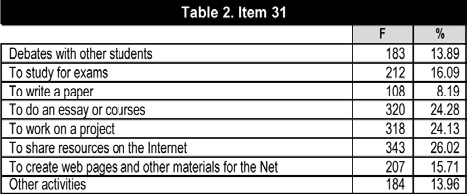
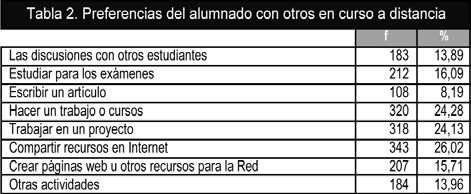
It seems significant that when presented with the option «I prefer to work individually in order to move on quickly», the preferred choice of answer (with 42.8%) was «neither agree nor disagree», so the options that referred to favorable and unfavorable attitudes were on a par. It is also revealing that students perceived that the role teachers played in order to set groups in motion was very important, as the high number of positive answers denote (81.3%). The answers also help us to infer that students perceive that one of the most important elements when learning in the 21st century will be collaborative work. One of the items was meant to ascertain the preferences that students had for working with other students in a distance education environment; the results are presented in table 2.
When asked how they would classify their experience of working in groups, a large percentage of the students (60.38%) considered it to be positive, followed by the neutral option (24.23%). We highlight the fact that the sum of the negative ratings did not exceed 3%. These data were similar at the four universities and globally the positive ratings are above 52%. The last question in this part of the questionnaire was designed to determine whether the students were interested in collaborating with other students. In this case, 63.17% said they were very interested, followed by 23.09% who indicated being interested. There are no major differences in regard to students from the four universities in the sample.
3.3. Dimension 3: Technical and technological skills
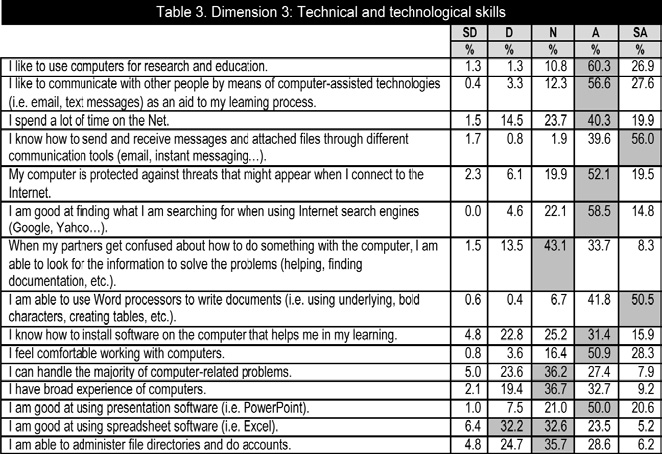
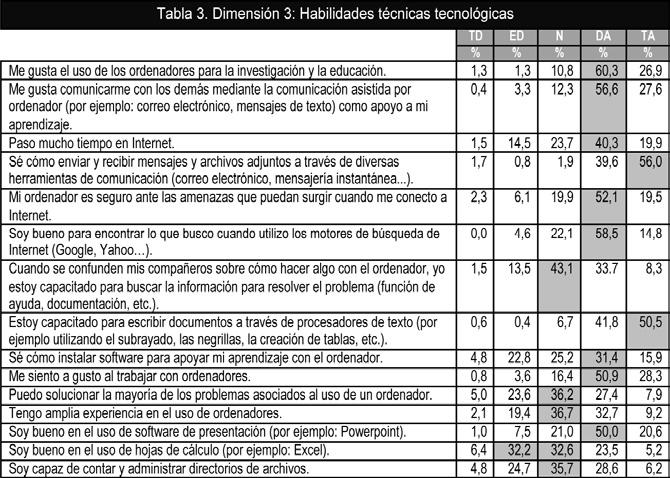
The third part of the questionnaire is aimed at gathering information about the level of technical skills needed to manage the various technologies the students have at their disposal (table 3).
As we can see, the perceptions that students have of ICT are very positive. In some cases, the sum of the choices «agree» and «completely agree» equals 80% of the distribution, as in the following cases:
• I like to use computers for research and education (87.1%).
• I like to communicate with other people by means of computer-assisted technologies (i.e. email, text messages) as an aid to my learning process (83.2%).
• I feel comfortable working with computers (79.2%).
At the same time, students reveal that they felt qualified to perform different tasks:
• I know how to send and receive messages and attached files through different communication tools (email, instant messaging…) (95.6%).
• I am good at finding what I am searching for when using Internet search engines (Google, Yahoo…) (73.3%).
• I am able to use Word processors to write documents (i.e. using underlying, bold characters, creating tables, etc.) (92.3%).
• I am good at using presentation software (i.e. PowerPoint) (70.6%).
It is worth noting that the students who acknowledged that «I spend a lot of time on the Net» is evident if we add the «agree» and «totally agree» answers to reach a total of 60.2% of the distribution.
3.4. The social software experience dimension
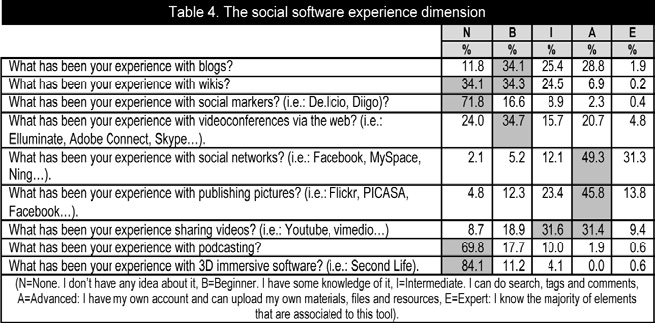
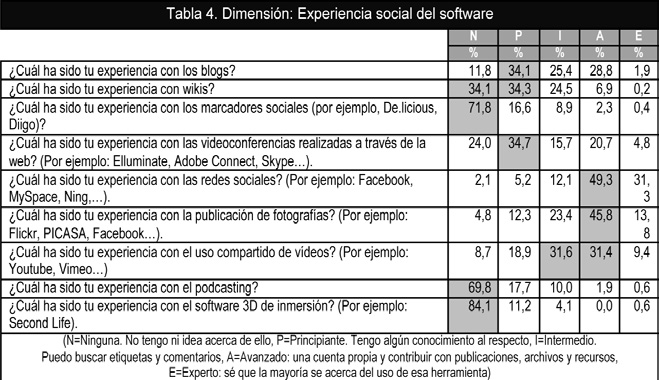
In regard to the experience that students have regarding social software (table 4) we find three levels of training. Firstly, those technologies in which students state they have an «advanced-(A)» level of training: social networks (49.3%), uploading photographs (45.8%) and video sharing (31, 4%); and secondly, the technology level of training in which the majority is «no-(N)» or «beginner-(B)»: wikis (34.1%, «beginner»), social bookmarking (71.8 %, «N»), podcasting (69.8%, «n») and 3D immersive experience software (84.1%, «no»). Finally, we found some cases where the beginner and advanced options have very similar rates: blog (34.1% and 28.8%) and video conferencing via the web (34.7% and 20.7%). We must emphasize the case of social networks because this is the only one in this part of questionnaire where the sum of the options «advanced» and «expert-(E) » reach 50%.
In terms of the social networks, one of the survey questions focused on collecting information on the most actively used social networks, offering four options: Facebook, Twitter, LinkedIn and Hi5. These data showed that 54.1% chose Twitter and 45.3% Facebook, while the other two options, LinkedIn and Hi5, obtained a response rate of less than 1%. However, these results varied depending on the university. In particular, students at the universities of Huelva and the Basque Country prefer to use Facebook, approximately 74% each, and students at Sevilla and Córdoba opt for Twitter, with 70.1% and 53.1% respectively.
3.5. The social software for learning purposes dimension
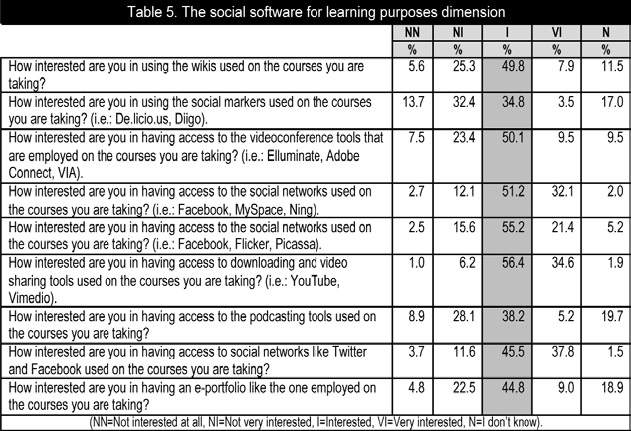
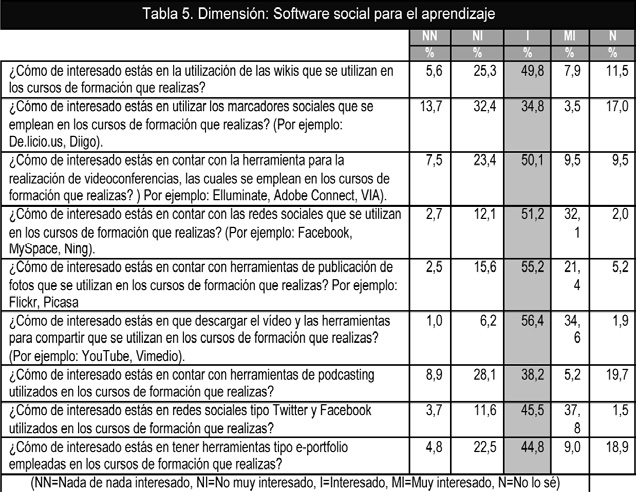
The last part of the questionnaire was designed to determine the extent to which the students were interested in using social software in their classes. Table 5 shows the results.
The results are somewhat contradictory since the «interested» option was chosen in all the cases but, nevertheless, to two of the question, («How interested are you in using the social markers used on the courses you are taking? (i.e.: De.licio.us, Diigo)» and «How interested are you in having access to the podcasting tools used on the courses you are taking?»), the response rates for «not very interested» were somewhat higher: 32.4% and 28.1%, respectively, although the percentage for «do not know» was 17.0% and 19.7% respectively. This shows for the fact that there is a certain lack of interest in these technologies.
One of the goals of our study was to find if there were any statistically significant differences between the university students comprising our sample. In order to achieve this objective we considered the four main dimensions that constitute the questionnaire: «learning preference», «technical and technological skills», «social software experience» and «social software for learning purposes». In all cases the hypotheses we formulated were:
• H0 (null hypothesis): there are no significant differences between the students from the different universities, with an alpha risk of 0.005.
• H1 (alternative hypothesis): there are significant differences between students from the different universities, with an alpha risk equal or less than 0.05.
The statistic used for this was the Kruskal-Wallis test (Gibbons & Chakraborti, 2003) for independent samples, carried out using the SPSS program, version 18. Table 6 presents the results.
The results allow us to reject H0 formulated for the «technical and technological skills» and «social software experience» dimensions, and also for «learning preference» and «social software for learning», with an alpha margin of error of 0.05. In the case of rejection, we would accept H1, referring to the existence of differences.
In order to find out which universities presented differences after rejecting H0, we applied the Kruskal-Wallis statistical multiple comparison test, specifically the Dunn test (1964). The results obtained are in table 7.
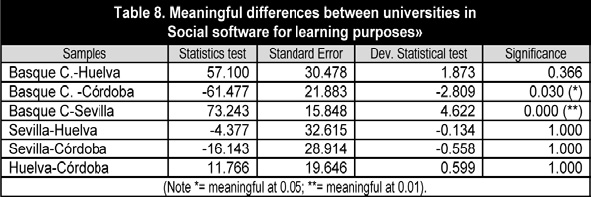
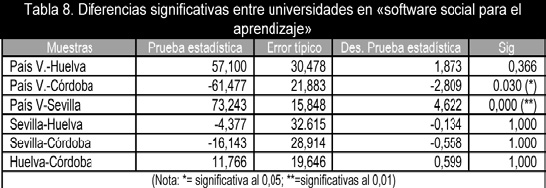
As we can see, the only significant differences appeared between the students of the University of Sevilla and the Basque Country, with the latter showing a greater preference for work group (average = 3.5646). In the case of social software for learning purposes, the results are presented in Table 8.
In this case, the differences were established between the students of the University of the Basque Country with those of Córdoba and Sevilla. The highest scores occurred in the Basque Country (average = 3.1011), compared to those of Córdoba (average = 3.0666) and Sevilla (average = 2.8672).
4. Conclusions
The study shows that students, regardless of their university of origin, show considerable interest in working together and collaboratively. This is of utmost importance since we are constantly talking about the potential of networked collaborative work and networked collaborative virtual training. But this would not be possible if students held negative attitudes toward teamwork and collaborative work, as our research shows.
As noted by various studies (Holcomb & Beal, 2010; Rollet, Lux & al., 2011), this paper shows that students are not as competent in handling technologies as certain sectors have been saying, and that they show notable shortcomings with regard to digital competences for the educational management of Web 2.0 tools. This leads us to affirm that those teachers who want to apply these technologies to their classes must first set up training for students to achieve at least an adequate technological-instrumental level of competence in the use of these tools. The teachers would be justified in their decision since the data found in this study indicate that students are certainly interested in learning how to handle and use ‘social media’ and they are willing to incorporate them into their educational practice.
The stated objectives were to know whether there were significant differences among Primary Education undergraduates in terms of their university of origin. In this regard it can be concluded that the data found, except for certain nuances, are similar in the four universities both in terms of significant insights into teamwork their mastery of Web 2.0.
On the other hand, this work validates the experiences being carried out in order to incorporate the Facebook and Twitter social networks into university education since these are the networks students most commonly use, as is also shown in other studies (Holcomb & Beal, 2010). The preponderance of one network over the other depends on the universities where the students study, possibly as a consequence of their own experiences with the individual network. At the same time we find that the experiences that students have of social networks is far greater than their knowledge of professional networks, which is virtually non-existent. In that case, teachers should make an effort to familiarize students with them.
We believe that this work provides a useful tool for the diagnosis of students’ perceptions of teamwork, collaborative work and the skills that need to be incorporated into Web 2.0 teaching tools.
References
Álvarez, G. & López, M. (2013). Análisis del uso de Facebook en el ámbito universitario desde la perspectiva del aprendizaje colaborativo a través de la computadora. Edutec, 43 (http://edutec.rediris.es/Revelec2/Revelec43/analisis_facebook_ambito_universitario_aprendizaje_colaborativo.html) (12-05-2013).
Anderson, T., Poellhuber, B. & McKerlich, R. (2010). Social Software Survey Used with Unpaced Undergrad (http://auspace.athabascau.ca/handle/2149/2771?mode=full) (21-12-2012).
Barajas, F. & Álvarez, C. (2013). Uso de Facebook como herramienta de enseñanza del área de naturales en el grado undécimo de educación media vocacional. Pixel Bit, 42, 143-156.
Bernal, C. & Angulo, F. (2013). Interacciones de los jóvenes andaluces en las redes sociales. Comunicar, 40, 25-30. (DOI: http://dx.doi.org/10.3916/C40-2013-02-02).
Cabero, J. (2003). Principios pedagógicos, psicológicos y sociológicos del trabajo colaborativo: su proyección en la teleenseñanza. In F. Martínez (Ed.), Redes de comunicación en la enseñanza (pp.129-56). Barcelona: Paidós.
Callaghan, N. & Bower, M. (2012). Learning Through Social Networking Sites. The Critical Role of the Teacher. Educational Media International, 49, 1, 1-17. (DOI:10.1080/09523987.2012.662621).
De-Gouveia, L. (2012). Comunidades virtuales y el aprendizaje estratégico de cálculo en ingeniería. Pixel Bit, 40, 101-113.
Durall, E., Gros, B. & al. (2012). Perspectivas tecnológicas: educación superior en Iberoamérica 2012-17. Austin, Texas (USA): The New Media Consortium.
García, I.; Peña-López, I. & al. (2010). Informe Horizon: Edición Iberoamericana, 2010. Austin, Texas (USA): The New Media Consortium.
Gardner, H. (2001). La inteligencia reformulada. Las inteligencias múltiples en el siglo XXI. Barcelona: Paidós.
Gros, B. (2008). Aprendizajes, conexiones y artefactos. Barcelona: Gedisa.
Holcomb, L.B. & Beal, C.M. (2010). Capitalizing on Web 2.0 in the Social Studies Context. TechTrends, 54, 4, 28-32. (DOI: 10.1007/s11528-010-0417-0).
Hung, S-H. & Cheng, M.J. (2013). Are you Ready for Knowledge Sharing? An Empirical Study of Virtual Communities. Computers & Education, 62, 8-17. (DOI: http://-dx.doi.org/10.1016/j.compedu.2012.09.017).
Imbernón, F., Silva, P. & Guzmán, C. (2011). Competencias en los procesos de enseñanza-aprendizaje virtual y semipresencial. Comunicar, 36, 107-114. (DOI: http://dx.doi.org/10.3916/C36-2011-03-01).
Irwin, Ch., Ball, L. & al. (2012). Students’ Perceptions of Using Facebook as an Interactive Learning Resource at University. Australasian Journal of Educational Technology, 28, 7, 1221-1232. (www.ascilite.org.au/ajet/ajet28/irwin.html) (10-04-2013).
Kim, J. (2011). Developing an Instrument to Measure Social Presence in Distance Higher Education. British Journal of Educational Technology, 42, 5, 763-777. (DOI: 10.1111/j.1467-8535.2010.01107.x).
Marqués, L. (2011). La creación de una comunidad aprendizaje en una experiencia de blended learning. Pixel Bit, Revista de Medios y Educación, 39, 55-68.
Martín, A.M., Dominguez, M. & Paralera, C. (2011). El entorno virtual: un espacio para el aprendizaje colaborativo. Edutec, 35 (http://edutec.rediris.es/revelec2/revelec35) (12-05-2013).
Mateo, J. (2004). La investigación ex post-facto. In R. Bisquerra (Coord.), Metodología de la investigación educativa (pp.195-230). Madrid: La Muralla.
Rollet, H., Lux, M. & al. (2011). The Web 2.0 Way of Learning with Technologies. International Journal of Learning Technology, 3(1), 87-107. (DOI: 10.1504/IJLT.2007.012368).
Sabariego, M. (2004). El proceso de investigación. In R. Bisquerra (Coord), Metodología de la investigación educativa (pp. 127-163). Madrid. La Muralla.
Shang, S. SC.; Li, E. Y. & al. (2011). Understanding Web 2.0 Service Models: a Knowledge-Creating Perspective. Information & Management, 48, 178-184. (DOI: http://dx.doi.org/10.1016/j.im.2011.01.005).
Shen, D., Cho, M.H. & al. (2013). Unpacking Online Learning Experiences: Online Learning Self-ef?cacy and Learning Satisfaction. Internet and Higher Education, 19, 10-17. (DOI: http://dx.doi.org/10.1016/j.iheduc.2013.04.001).
Túñez, M. & Sixto, J. (2012). Las redes sociales como entorno docente: análisis del uso de Facebook en la docencia universitaria. Pixel Bit, 41, 77-92.
Click to see the English version (EN)
Resumen
El cambio en las metodologías de aula viene de la mano, en muchos casos, de Internet y de las herramientas de la Web 2.0. Por otra parte, el desarrollo de una perspectiva de corte constructivista apoyado en el trabajo en grupo, suponen que la formación de los estudiantes puede ser alimentada a través de este tipo de recursos, dado que potencia, entre otros aspectos la socialización, la búsqueda de información, el logro de una meta común, etc. La investigación que aquí se presenta versa sobre la realidad de los procesos de aprendizaje universitario con TIC y las preferencias para trabajar dentro y fuera del aula de los estudiantes de las universidades de Córdoba, Huelva, Sevilla y País Vasco. Los objetivos se centran en conocer las percepciones que los alumnos tienen sobre el software social y el trabajo en grupo y colaborativo, cuáles son las herramientas de software social que emplean y si hay diferencias en función de la universidad de procedencia. Se empleó como instrumento de recogida de datos un cuestionario conformado por cuatro dimensiones. Se concluye que el alumnado está interesado en el empleo del trabajo en grupo como metodología de aula, así como su escaso conocimiento de las herramientas tecnológicas, salvo de las redes sociales. Al mismo tiempo, estos resultados aportan un instrumento fiable para el diagnóstico de las variables que lo conforman.
1. Aproximación teórica
En los últimos tiempos la universidad se está transformando debido a diferentes acontecimientos, que van desde su incorporación al Espacio Europeo de Educación Superior (EEES), la extensión de metodologías como el trabajo colaborativo o el estudio de casos, y la incorporación de las tecnologías de la información y comunicación (TIC), de forma general, y de Internet y la Web 2.0, en particular.
Como señalan Shang y otros (2011), la incorporación de la Web 2.0 a la educación supone que los procesos de aprendizaje que los estudiantes desarrollan tienen un carácter más social, dinámico y personal, donde el conocimiento producido será explicito e interactúe con otros dentro de un proceso continuo, y que la educación sea más creativa, participativa y socializadora. Compartimos con Túñez y Sixto (2012: 78-79) que «la Web 2.0 no consiste en un cambio tecnológico aislado, sino en un modelo que concibe el aprendizaje como el resultado de la interacción y colaboración de las personas y que sitúa al estudiante en el centro del proceso, por lo que ha de entenderse como un instrumento facilitador del cambio de modelo en los procesos de aprendizaje».
Dentro de las herramientas de la Web 2.0, los «social media» y las redes sociales están penetrando en la universidad gracias a las posibilidades que ofrecen para aumentar la participación de los alumnos, potenciar su creatividad y dotar al proceso de socialización de una nueva perspectiva. Como afirman Imbernón, Silva y Guzmán (2011), suelen propiciar un espacio de aprendizaje más interactivo y dinámico
Estas posibilidades llevan, como señalan varias investigaciones (Marqués, 2011; Callaghan & Bower, 2012; De-Gouveia, 2012; Barajas & Álvarez, 2013; Bernal & Angulo, 2013) a que las redes sociales estén cada día más imbricadas en los procesos formativos del alumnado, teniendo como perspectiva el trabajo cooperativo y colaborativo.
Con respecto al trabajo colaborativo, diferentes estudios (Cabero, 2003; Gros, 2008; Martín, Domínguez & Paralela, 2011) han señalado que su utilización aporta una serie de ventajas: mejora de las relaciones sociales, acrecienta la tolerancia respecto a las personas del grupo, aumenta la participación del estudiante, favorece el desarrollo de la motivación intrínseca y la autoestima, mejora de la habilidad de apoyo social y de la integración y la cohesión de los grupos, y adquisición de habilidad de liderazgo democrático y participación.
Ahora bien, la utilización de las redes sociales para el trabajo colaborativo demanda que el estudiante tenga una actitud positiva, o unos adecuados niveles de inteligencia interpersonal (Gardner, 2001). Como señalan Shen, Cho y otros (2013), la autoeficacia percibida que los alumnos tenían para trabajar en grupo condicionaba la forma en la cual esta se desarrollaba, y ello está relacionado con su actitud hacia el trabajo en grupo y la presencia social que muestran los sujetos en los entornos de comunicación mediada (Kim, 2011). No olvidemos que la actitud negativa mostrada por los alumnos hacia una tecnología o forma de utilización, repercute sobre el tipo de interacciones que establecen y los rendimientos que alcanzan con la misma (Hung & Cheng, 2013), así como que no todos ellos muestran actitudes positivas para la incorporación de las redes sociales a la formación (Irwin, Ball & al., 2012). En torno a estos componentes, las percepciones que los alumnos tienen hacia el trabajo en grupo y colaborativo y las redes sociales, gira la investigación que a continuación presentamos. Tecnologías, entornos colaborativos y medios sociales, los cuales según señalan diversos informes Horizon tendrán una gran presencia en los centros de formación (García, Peña-López & al., 2010; Durall, Gros & al., 2012).
2. Método
2.1. Objetivos de partida
La investigación presentada forma parte de una mayor que se está llevando a cabo a nivel internacional. Aquí se ofrecen los resultados alcanzados en un estudio realizado en las Facultades de Ciencias de la Educación de las universidades de Córdoba, Huelva, Sevilla y País Vasco en los Grados de Educación Infantil y Primaria. La selección de estas universidades obedece a la respuesta positiva que mostraron a colaborar en este trabajo los profesores, de ahí que la población/muestra esté referida a dichos grados.
Los objetivos perseguidos fueron:
• Conocer las percepciones que los alumnos tienen respecto al software social y el trabajo en grupo y colaborativo frente al trabajo individual.
• Conocer si existen diferencias en función de la universidad de procedencia respecto a las percepciones que tienen en relación al trabajo grupal e individual.
• Y conocer qué herramientas de software social utilizan preferentemente los alumnos.
2.2. Metodología de investigación
El tipo de muestreo utilizado es el no probabilístico-incidental, que es aquel en el cual el investigador selecciona directa e intencionalmente la muestra, debido a que tiene fácil acceso a la misma y es representativa de la población (Sabariego, 2004). La muestra fue de 525 sujetos, pertenecientes a una población inicial de 728 de los estudios anteriormente indicados.
El enfoque metodológico seguido ha sido de corte cuantitativo, empleando para ello un diseño descriptivo no experimental y no correlacional. Para la recogida de la información se realizó una adaptación del cuestionario de Anderson, Poellhuber y McKerlich (2010) (Social Software survey used with unpaced undergrad), que está conformado por 91 ítems, distribuidos en las siguientes dimensiones: identificación, preferencia de aprendizaje, habilidades técnicas-tecnológicas, experiencia en software social, software social para el aprendizaje, confianza en las habilidades de la educación a distancia y conclusión.
La adaptación del instrumento supuso la incorporación de una variable de identificación, universidad de procedencia, y la supresión de las dos últimas dimensiones del cuestionario original, ya que no se adecuaban a los objetivos que perseguíamos. El instrumento final quedó compuesto por 67 ítems, distribuidos en: Aspectos generales (universidad, género…) (6 ítems), Preferencia por trabajar en grupo o individualmente (27 ítems), Habilidades técnicas-tecnológicas (15 ítems), Experiencia con herramientas de la Web 2.0 (10 ítems) y Uso de distintas herramientas de software social en la formación a distancia (9 ítems).
El cuestionario se administró vía Internet (www.sav.us.es/encuestas/redsocial/index.htm). Tiene una construcción tipo Likert con cinco opciones de respuesta (TD=totalmente en desacuerdo, ED=en desacuerdo, N=ni de acuerdo ni en desacuerdo, DA=de acuerdo y TA=totalmente de acuerdo).
Con la intención de determinar la consistencia interna del instrumento, se aplicó la prueba de fiabilidad Alfa de Cronbrach, tanto al cuestionario en su totalidad, como a cada una de sus dimensiones obteniéndose los siguientes valores: Alfa de Cronbach total del instrumento: 0,860; Alfa de Cronbach dimensión «preferencia de aprendizaje»: 0,800; Alfa de Cronbach dimensión «habilidades técnicas-tecnológicas»: 0,902; Alfa de Cronbach dimensión «experiencia software social»: 0,818; Alfa de Cronbach dimensión «software social para el aprendizaje»: 0,835.
Puntuaciones que, de acuerdo con Mateo (2004), podríamos considerar de elevadas y que denotarían altos niveles de fiabilidad del instrumento. También se realizó la correlación ítem-total, aunque los resultados encontrados no los presentaremos para no hacer tediosa la lectura del artículo, pero los valores alcanzados indicaban que la eliminación de ningún ítem aumentaba la fiabilidad del instrumento.
3. Resultados del estudio
3.1. Dimensión 1: Datos descriptivos
Lo primero a señalar es que la gran mayoría de los alumnos que respondieron al cuestionario eran mujeres; en concreto el 76,76% frente al 23,24%, que eran hombres; datos que seguían casi la misma proporción en las cuatro universidades donde recogimos la información.
En lo que se refiere a su edad la gran mayoría se encontraba entre 17 y 20 años (58,90%), seguidos de los de 21-24 años (26,33%). Dato en el cual no coincidían todos los alumnos de las universidades presentándose las discrepancias en los del País Vasco, donde los de 21-24 años ocupaban la mayoría (36,09%). Interrogados sobre si habían realizado acciones formativas a través de Internet, los datos encontrados nos llevaron a un cierto paralelismo, el 54,21% señalaron que afirmativamente y el 45,79% que negativamente; circunstancias que eran similares en los alumnos de nuestras cuatro universidades.
Resulta significativo que la gran mayoría de los estudiantes, indicaron que sí accedían de forma regular a Internet con fines educativos (93,54%), dato que se presentó de forma similar en las muestras de las cuatro universidades. Esto confirma que Internet como medio educativo se ha extendido en las instituciones de educación superior. Se puede también señalar que los equipos utilizados por los alumnos son bastante completos, ya que el 41,63% tenían auriculares con micrófono integrado, y el 88,99% tenían webcam. Ello facilitaría su utilización en acciones formativas a distancia donde se incorporara la videoconferencia.
3.2. Dimensión 2: Preferencias de aprendizaje
La segunda parte del cuestionario iba destinada a conocer las preferencias de aprendizaje que tenían los alumnos (ver tabla 1 en la págima anterior).
En primer lugar, hay que indicar que la gran mayoría de los alumnos participantes saben trabajar individualmente. El 92,2% señalaron que no estaban «totalmente de acuerdo» o «en desacuerdo» con la frase: «No sé trabajar solo». El estudio señala con claridad que los estudiantes prefieren trabajar en grupo, como podemos observar en contestaciones a ítems como los que a continuación presentamos, donde el sumatorio de los porcentajes a las contestaciones «de acuerdo» y «totalmente de acuerdo», destaca sobre las demás:
• El trabajo en grupo es útil para reunir las ideas de todos y tomar una decisión (88,9%).
• Me gusta ser capaz de utilizar las ideas de otras personas, así como las mías propias (88,4%).
• Los trabajos se hacen más rápidos si todos colaboramos (85,9%).
• El trabajo con otros estudiantes me puede ayudar a aprender (97,1%).
Ello también se observa en los ítems que estaban formulados de manera negativa, donde las opciones que obtenían porcentajes más altos eran las referidas a estar «totalmente en desacuerdo» o «en desacuerdo»:
• Trabajar en un grupo conlleva obtener resultados negativos (71,4%).
• Trabajar en un grupo me da miedo (86,5%).
• No me gusta trabajar solo (47,6%).
• En una discusión de grupo, nunca se llega a conclusiones importantes (70,2%).
• Me gusta trabajar por mi cuenta sin prestar atención a otros compañeros (80,6%).
• No me gusta trabajar con otros compañeros (82,7%).
Parece significativo que en la pregunta «Prefiero trabajar de forma individual para así poder avanzar rápidamente», la opción de respuesta «ni de acuerdo ni en desacuerdo», ha sido la que alcanzaba un porcentaje mayor con un 42,8%, estando niveladas las opciones de respuestas que hacían referencia a lo favorable y desfavorable. Es revelador que el alumnado percibe de forma significativa el papel que el docente puede desempeñar en la dinamización de los grupos de trabajo junto con la puesta en acción de los mismos, como así lo denota la alta tasa de respuestas positivas (81,3%) encontradas. También permite inferir que los alumnos participantes comprueben que una de las condiciones de aprender y trabajar en el siglo XXI será el trabajo en grupo y colaborativo. Uno de los ítems estaba destinado a conocer las preferencias que tenía el alumnado para trabajar con otros estudiantes en un curso de educación a distancia, encontrándonos las valoraciones que presentamos en la tabla 2.
Preguntados los estudiantes sobre cómo calificarían su experiencia al trabajar en equipo en acciones de formación, encontramos que un gran porcentaje (60,38%) la consideró de forma positiva, seguida por la opción de neutral (24,23%). Señalar que la suma de las valoraciones negativas no excedió del 3%. Estos datos fueron similares en las diferentes universidades participantes, y en todas las valoraciones positivas se superó el 52%. La última pregunta de esta parte del cuestionario iba destinada a conocer si los alumnos estaban interesados en la colaboración con otros estudiantes. En este caso el 63,17% señalaron que estaban muy interesados, seguidos del 23,09% que indicaron estar interesados. Datos respecto a los cuales no había grandes diferencias en lo que se refiere a los alumnos de las diferentes universidades que componían la muestra.
3.3. Dimensión 3: Habilidades técnicas tecnológicas
La tercera parte del cuestionario pretendía recoger información de las habilidades técnicas que poseían para el manejo de distintas tecnologías (ver tabla 3).
Como observamos las percepciones que los alumnos tienen hacia las TIC son altamente positivas. Superando en algunos casos el sumatorio de las opciones de respuestas de acuerdo y completamente de acuerdo, el 80% de la distribución, como ocurre en los siguientes casos:
• Me gusta el uso de los ordenadores para la investigación y la educación (87,1%).
• Me gusta comunicarme con los demás mediante la comunicación asistida por ordenador (por ejemplo, correo electrónico, mensajes de texto) como apoyo a mi aprendizaje (83,2%).
• Me siento a gusto al trabajar con ordenadores (79,2%).
Al mismo tiempo, los alumnos revelan que se encontraban capacitados para realizar diferentes actividades:
• Sé cómo enviar y recibir mensajes y archivos adjuntos a través de diversas herramientas de comunicación (correo electrónico, mensajería instantánea, etc.) (95,6%).
• Soy bueno para encontrar lo que busco cuando utilizo los motores de búsqueda de Internet (Google, Yahoo…) (73,3%).
• Estoy capacitado para escribir documentos a través de procesadores de texto (por ejemplo utilizando el subrayado, las negrillas, la creación de tablas, etc.) (92,3%).
• Soy bueno en el uso de software de presentación (por ejemplo: Powerpoint) (70,6%).
Resulta llamativo que los alumnos en la opción de respuesta: «Paso mucho tiempo en Internet», reconocen que pasan mucho tiempo, de forma que sumando las opciones de respuesta «de acuerdo» y «totalmente de acuerdo» se alcanza el 60,2% de la distribución.
3.4. Dimensión: Experiencia social del software
En lo que se refiere a la experiencia que los alumnos tienen respecto al software social (ver tabla 4), encontramos tres niveles de formación. Por una parte estarían las tecnologías en las que nos señalan tener un avanzado (A) nivel de formación: las redes sociales (49,3%), la publicación de fotografías (45,8%), y compartir vídeos (31,4%); y por otro, las tecnologías donde su nivel de formación mayoritario es ninguno- (N) o principiante (P): wikis (34,1%), «principiante», marcadores sociales (71,8%, ninguna), podcasting (69,8%, ninguna) y experiencias en software en 3D de inmersión (84,1%, ninguna). Finalmente encontramos algunos casos donde las opciones principiante y avanzada, ocupan porcentajes muy similares: blog (34,1% y 28,8%) y videoconferencia a través de la web (34,7% y 20,7%). Destacar que el caso de las redes sociales, es el único de esta parte del cuestionario donde la suma de las opciones «avanzado» y «experto- (E)», llegan al 50%.
En este último caso -el referido a las redes sociales-, una de las preguntas del cuestionario se centraba en recabar información sobre la red social que más empleaban, ofreciéndoles un abanico de cuatro opciones: Facebook, Twitter, Linkedin y Hi5. En cuanto a a este dato encontramos que el 54,1% señaló Twitter y el 45,3% Facebook, mientras que las otras dos opciones ofrecidas, Linkedin y Hi5, obtuvieron un porcentaje de respuesta inferior al 1%. Ahora bien, estos resultados eran diferentes en función de la universidad de procedencia de los estudiantes; en concreto, los alumnos de la universidad de Huelva y del País Vasco, utilizaban preferentemente Facebook con un 74% aproximadamente en cada una de ellas, y en las universidades de Sevilla y Córdoba, Twitter, con un 70,1% y 53,1% respectivamente.
3.5. Dimensión: Software social para el aprendizaje
La última parte del cuestionario, estaba diseñada para conocer el grado de interés que tenían los estudiantes en el manejo y uso de específicos software sociales. En la tabla 5 presentamos los resultados alcanzados.
Los resultados encontrados son un poco contradictorios, ya que por una parte indican que la opción más seleccionada en todos los casos ha sido la de «interesado», pero tenemos que señalar que en dos de ellas: «¿Cómo de interesado está en utilizar los marcadores sociales que se emplean en los cursos de formación que realizas? (Por ejemplo: De.licio.us, Diigo)» y «¿Cómo de interesado está en contar con herramientas de podcasting utilizados en los cursos de formación que realizas?», los porcentajes de respuesta en la opción «no muy interesado» eran en cierta medida elevados: 32,4% y 28,1%, respectivamente, aunque el porcentaje alcanzado en la opción «no lo sé» era en el primero de los casos del 17,0% y 19,7% respectivamente, lo que sugiere un cierto desconocimiento de los alumnos de estas tecnologías.
Uno de los objetivos de nuestro estudio era conocer si había diferencias estadísticamente significativas entre los estudiantes de las universidades que comprendían nuestra muestra, y ello se hizo considerando las cuatro grandes dimensiones que constituían el cuestionario: «preferencia de aprendizaje», «habilidades técnicas-tecnológicas», «experiencia software social» y «software social para el aprendizaje». En todos los casos las hipótesis que formulamos fueron:
• H0 (hipótesis nula): no hay diferencias significativas entre los estudiantes de las diferentes universidades, con un riesgo alfa de equivocarnos del 0,05 o inferior.
• H1 (hipótesis alternativa): sí hay diferencias significativas entre los estudiantes de las diferentes universidades, con un riesgo alfa de equivocarnos del 0,05 o inferior.
El estadístico utilizado para ello fue la prueba de Kruskal-Wallis para muestras independientes, realizado bajo el programa SPSS en su versión 18. En la tabla 6, se presentan los resultados alcanzados.
Los resultados obtenidos permiten rechazar la H0 formulada para las dimensiones de «habilidades técnicas-tecnológicas» y «experiencia software social», y sí en el caso de «preferencia de aprendizaje» y «software social para el aprendizaje», en ambos casos con un riesgo alfa de equivocarnos del 0,05. En el caso de rechazo aceptamos la H1, que hacía referencia a la existencia de diferencias.
Con el objeto de conocer entre qué universidades se daban las diferencias cuando habíamos rechazado la H0, aplicamos la prueba estadística de comparaciones múltiples de Kruskal-Wallis, concretamente el test de Dunn y en el primero de los casos obtuvimos los resultados que se presentan en la tabla 7.
Como podemos observar, las únicas diferencias significativas que se producen se encuentran entre los alumnos de la universidad del País Vasco y de Sevilla, mostrando los últimos preferencias más altas hacia el trabajo grupal (media=3,5646), que los del País Vasco (media=3,5070). En el caso de software social para el aprendizaje, los resultados se presentan en la tabla 8.
En este caso las diferencias se establecieron entre los alumnos de la universidad del País Vasco con los de Córdoba y Sevilla. Las puntuaciones más altas se produjeron en los del País Vasco (media=3,1011), respecto a los de Córdoba (media= 3,0666) y de Sevilla (media=2,8672).
4. Conclusiones del estudio
El trabajo pone de manifiesto que los alumnos, independientemente de su universidad de procedencia, muestran altas percepciones para trabajar en grupo y de manera colaborativa. Ello es de máxima importancia, pues constantemente hablamos de las posibilidades que ofrecen el trabajo colaborativo en red y la formación virtual cooperativa; ello exige que el estudiante tenga actitudes positivas, como se refleja en nuestra investigación, hacia el trabajo en grupo y colaborativo.
Como han apuntado diferentes investigaciones (Holcomb & Beal, 2010; Rollet, Lux & al., 2011), el trabajo pone de manifiesto que los alumnos no son tan competentes en el manejo de las tecnologías como desde ciertos sectores se ha ido diciendo, y muestran unas notables carencias en lo referido a la competencia digital para el manejo educativo de las herramientas de la Web 2.0. Ello nos lleva a señalar que el docente que desee aplicar estas tecnologías en la enseñanza, debe en primer lugar indagar sobre la capacitación de sus alumnos en el manejo, como mínimo tecnológico-instrumental, de las mismas. Y para ello cuenta con una buena base, pues los datos encontrados apuntan que están interesados en aprender su manejo y utilización, así como también a incorporar en la práctica educativa las tecnologías incluidas dentro de los «social media».
Los objetivos formulados trataban de conocer si en los estudiantes de Grado de Educación Infantil y Primaria se producían diferencias significativas en función de su universidad de procedencia. Se puede concluir que los datos encontrados, salvo matices, son similares en las cuatro universidades, tanto en lo que se refiere hacia las percepciones significativas hacia el trabajo en grupo, el dominio mostrado por las herramientas de la Web 2.0, como hacia su interés formativo en cuanto al manejo de estas herramientas.
Por otra parte, el trabajo valida las experiencias que se están llevando a cabo para incorporar las redes sociales Facebook y Twitter a la formación universitaria, pues son las redes que más suelen utilizar los estudiantes, como también han puesto de manifiesto otros estudios (Holcomb & Beal, 2010). Aunque la preponderancia de una sobre otra depende de las universidades donde han cursado los estudios, posiblemente como consecuencias de las experiencias recibidas. Al mismo tiempo nos encontramos que las experiencias que los alumnos tienen sobre las redes sociales se centran fundamentalmente en las generalistas, mostrando un gran desconocimiento respecto a las redes profesionales. Ahí los docentes deberían hacer un esfuerzo para su aprendizaje y participación.
Por último, hay que señalar que el trabajo aporta, en su traducción y fiabilización, un instrumento útil para el diagnóstico de las percepciones que los alumnos muestran hacia el trabajo en grupo y colaborativo, y el dominio para ser incorporadas a la enseñanza de las herramientas de la Web 2.0.
Referencias
Álvarez, G. & López, M. (2013). Análisis del uso de Facebook en el ámbito universitario desde la perspectiva del aprendizaje colaborativo a través de la computadora. Edutec, 43 (http://edutec.rediris.es/Revelec2/Revelec43/analisis_facebook_ambito_universitario_aprendizaje_colaborativo.html) (12-05-2013).
Anderson, T., Poellhuber, B. & McKerlich, R. (2010). Social Software Survey Used with Unpaced Undergrad (http://auspace.athabascau.ca/handle/2149/2771?mode=full) (21-12-2012).
Barajas, F. & Álvarez, C. (2013). Uso de Facebook como herramienta de enseñanza del área de naturales en el grado undécimo de educación media vocacional. Pixel Bit, 42, 143-156.
Bernal, C. & Angulo, F. (2013). Interacciones de los jóvenes andaluces en las redes sociales. Comunicar, 40, 25-30. (DOI: http://dx.doi.org/10.3916/C40-2013-02-02).
Cabero, J. (2003). Principios pedagógicos, psicológicos y sociológicos del trabajo colaborativo: su proyección en la teleenseñanza. In F. Martínez (Ed.), Redes de comunicación en la enseñanza (pp.129-56). Barcelona: Paidós.
Callaghan, N. & Bower, M. (2012). Learning Through Social Networking Sites. The Critical Role of the Teacher. Educational Media International, 49, 1, 1-17. (DOI:10.1080/09523987.2012.662621).
De-Gouveia, L. (2012). Comunidades virtuales y el aprendizaje estratégico de cálculo en ingeniería. Pixel Bit, 40, 101-113.
Durall, E., Gros, B. & al. (2012). Perspectivas tecnológicas: educación superior en Iberoamérica 2012-17. Austin, Texas (USA): The New Media Consortium.
García, I.; Peña-López, I. & al. (2010). Informe Horizon: Edición Iberoamericana, 2010. Austin, Texas (USA): The New Media Consortium.
Gardner, H. (2001). La inteligencia reformulada. Las inteligencias múltiples en el siglo XXI. Barcelona: Paidós.
Gros, B. (2008). Aprendizajes, conexiones y artefactos. Barcelona: Gedisa.
Holcomb, L.B. & Beal, C.M. (2010). Capitalizing on Web 2.0 in the Social Studies Context. TechTrends, 54, 4, 28-32. (DOI: 10.1007/s11528-010-0417-0).
Hung, S-H. & Cheng, M.J. (2013). Are you Ready for Knowledge Sharing? An Empirical Study of Virtual Communities. Computers & Education, 62, 8-17. (DOI: http://-dx.doi.org/10.1016/j.compedu.2012.09.017).
Imbernón, F., Silva, P. & Guzmán, C. (2011). Competencias en los procesos de enseñanza-aprendizaje virtual y semipresencial. Comunicar, 36, 107-114. (DOI: http://dx.doi.org/10.3916/C36-2011-03-01).
Irwin, Ch., Ball, L. & al. (2012). Students’ Perceptions of Using Facebook as an Interactive Learning Resource at University. Australasian Journal of Educational Technology, 28, 7, 1221-1232. (www.ascilite.org.au/ajet/ajet28/irwin.html) (10-04-2013).
Kim, J. (2011). Developing an Instrument to Measure Social Presence in Distance Higher Education. British Journal of Educational Technology, 42, 5, 763-777. (DOI: 10.1111/j.1467-8535.2010.01107.x).
Marqués, L. (2011). La creación de una comunidad aprendizaje en una experiencia de blended learning. Pixel Bit, Revista de Medios y Educación, 39, 55-68.
Martín, A.M., Dominguez, M. & Paralera, C. (2011). El entorno virtual: un espacio para el aprendizaje colaborativo. Edutec, 35 (http://edutec.rediris.es/revelec2/revelec35) (12-05-2013).
Mateo, J. (2004). La investigación ex post-facto. In R. Bisquerra (Coord.), Metodología de la investigación educativa (pp.195-230). Madrid: La Muralla.
Rollet, H., Lux, M. & al. (2011). The Web 2.0 Way of Learning with Technologies. International Journal of Learning Technology, 3(1), 87-107. (DOI: 10.1504/IJLT.2007.012368).
Sabariego, M. (2004). El proceso de investigación. In R. Bisquerra (Coord), Metodología de la investigación educativa (pp. 127-163). Madrid. La Muralla.
Shang, S. SC.; Li, E. Y. & al. (2011). Understanding Web 2.0 Service Models: a Knowledge-Creating Perspective. Information & Management, 48, 178-184. (DOI: http://dx.doi.org/10.1016/j.im.2011.01.005).
Shen, D., Cho, M.H. & al. (2013). Unpacking Online Learning Experiences: Online Learning Self-ef?cacy and Learning Satisfaction. Internet and Higher Education, 19, 10-17. (DOI: http://dx.doi.org/10.1016/j.iheduc.2013.04.001).
Túñez, M. & Sixto, J. (2012). Las redes sociales como entorno docente: análisis del uso de Facebook en la docencia universitaria. Pixel Bit, 41, 77-92.
Document information
Published on 31/12/13
Accepted on 31/12/13
Submitted on 31/12/13
Volume 22, Issue 1, 2014
DOI: 10.3916/C42-2014-16
Licence: CC BY-NC-SA license
Share this document
Keywords
claim authorship
Are you one of the authors of this document?
