Affiliations:
1,2,3,4Cagayan State University, Carig Campus, College of Engineering and Architecture, Civil Engineering Department, Tuguegarao City, Philippines
ORCID:4*![]()
1. Introduction
1.1 Background
In civil engineering practice, the failure of construction projects is rarely the result of a single error but often the cumulative effect of lapses in quality management. These lapses—ranging from poor supervision and use of substandard materials to weak communication and cost-driven bidding—can snowball into delays, cost overruns, structural defects, or even catastrophic failures. Ensuring quality in construction is therefore both a contractual obligation and a moral imperative, given the direct implications for public safety and the long-term reliability of infrastructure. The evolution of Total Quality Management (TQM) has transformed how organizations perceive and pursue quality. Originating in the manufacturing sector, TQM is a comprehensive, organization-wide philosophy that integrates all processes and stakeholders in the pursuit of continuous improvement and customer satisfaction (Besterfield et al., 2019). For construction companies, where projects are highly variable, site-dependent, and labor-intensive, adopting TQM helps establish systematic practices that minimize variability and enhance project outcomes.
Globally, research has shown that the application of TQM practices improves organizational performance by strengthening operational efficiency, productivity, client satisfaction, and safety. However, there is limited empirical evidence focusing on the construction industry in regional Philippine contexts, particularly in rapidly developing urban centers like Tuguegarao City. The unique challenges faced by local construction firms—such as resource constraints, dependence on government infrastructure programs, and gaps in advanced technology—make it essential to assess how TQM can be strategically implemented to optimize performance.
This study examines the impact of TQM practices on the organizational performance of construction companies in Tuguegarao City. It addresses knowledge gaps in local construction quality management and provides a framework to guide practitioners and policymakers toward sustainable improvement in the sector.
1.2 State of the Problem
Despite the recognized benefits of TQM in enhancing quality outcomes and organizational performance, many construction companies—particularly in emerging urban centers—struggle with inconsistent implementation. Several firms prioritize meeting immediate project deadlines and budgets over establishing systematic quality management, resulting in delays, disputes, client dissatisfaction, and long-term maintenance issues.
While national regulations and PCAB licensing provide baseline standards for construction quality, they do not guarantee consistent adoption of TQM principles across firms of varying sizes and capacities. Moreover, there is limited empirical research on the specific predictive relationship between TQM practices and organizational performance in Tuguegarao City, where increasing urbanization heightens the need for high-quality, resilient infrastructure.
This study seeks to address the following general problem:
How do Total Quality Management (TQM) practices influence the organizational performance of construction companies in Tuguegarao City?
Specifically, it aims to respond to the following questions:
1. What is the demographic profile of construction companies in Tuguegarao City in terms of:
- Operating years
- Type of PCAB License or IAC Category
- IAC Classification of Projects
2. What are the top two implemented TQM practices in each TQM dimension among the construction companies?
3. How do construction companies perceive their organizational performance in terms of operational, employee, and other relevant performance indicators?
4. Is there a significant difference in the level of TQM practices implemented when grouped by:
- Operating years
- Type of PCAB License or IAC Category
5. Is there a significant relationship between TQM practices and the organizational performance of construction companies?
6. Which TQM dimensions serve as key predictors of organizational performance?
7. What framework can be proposed to guide the strategic implementation of TQM in the construction companies of Tuguegarao City?
1.3 Objective
1.3.1 General Objective
To evaluate the influence of Total Quality Management (TQM) practices on the organizational performance of construction companies in Tuguegarao City.
1.3.2 Specific Objectives
1. To describe the demographic profile of construction companies in terms of:
- Operating years
- Type of PCAB License or IAC Category
- IAC Classification of Projects
2. To identify the top two implemented TQM practices in each TQM dimension.
3. To assess the perceived organizational performance of construction companies with respect to operational and employee performance.
4. To determine the significant differences in the level of TQM implementation when grouped by:
- Operating years
- Type of PCAB License or IAC Category
5. To determine the relationship between TQM practices and organizational performance.
6. To identify which TQM dimensions significantly predict organizational performance.
7. To develop a strategic implementation framework for TQM tailored to the local construction industry.
1.4 Conceptual Framework
The idea behind this study leans on Total Quality Management, or TQM. It examines an input-process-output picture.
Input:
What a construction firm does, like its TQM habits, counts as input. Those habits may mean things such as:
- Leadership commitment – managers trying to keep quality high and set direction.
- Customer focus – trying to know what the client wants and give it.
- Continuous improvement – always tweaking methods, tools, and supplies.
- Employee involvement – letting workers have a say in choices.
- Process management – lining up tasks and checks in a way.
- Supplier and partner relations – working with vendors to keep material quality steady.
Process:
The extent to which a company utilizes these TQM habits may be influenced by its age, the type of license it holds, and the nature of its projects, which can impact both daily operations and major decisions.
Output
The result is reflected in the firm's performance. This can be seen in:
- Operational performance – speed, on-time delivery, cost control.
- Employee performance – skill level, motivation, output.
- Client satisfaction – how happy buyers are and how good the work looks still.
Overall, even so, the picture suggests TQM pieces are linked, not standalone, and together they might lift a firm’s total performance.
1.5 Scope and Delimitation
This study focuses on construction companies operating in Tuguegarao City, Cagayan, including both locally based firms and external companies with ongoing projects in the city. It limits its investigation to firms with valid PCAB licenses or IAC registration, as these are officially recognized to engage in construction activities.
The scope covers:
- 1. The key dimensions of TQM are leadership commitment, customer focus, continuous improvement, employee involvement, process management, and supplier relations.
- 2. The organizational performance indicators most relevant to construction settings include operational efficiency, project quality, timeliness, employee productivity, and client satisfaction.
- 3. The study does not include informal contractors or construction firms without official registration. It also excludes other external factors such as government procurement processes, macroeconomic policies, or unforeseen disruptions (e.g., natural disasters), except where these directly relate to the implementation of TQM practices.
1.6 Significance
This study makes a new contribution to both academic literature and practical work in building. For construction firms, the results could help managers pick which total quality management ideas are most useful. That might make projects run smoother and last longer. Government agencies could review the data and consider new rules or training initiatives that enhance quality standards. Still, pushing policy can be slow and sometimes misses local needs. Engineers, site supervisors, and quality officers may see clearer ways to cut rework, defects, and delays, although changing habits is never easy. Academic circles gain a rare glimpse into how quality is linked to performance in a Philippine metro, filling a gap that many scholars previously overlooked. Future researchers could build on this, maybe comparing other cities. Ultimately, clients and everyday users may benefit from safer and more reliable structures, provided that firms actually adopt the recommended practices. Hope is for significantly better infrastructure for the whole community.
2. Methodology
2.1 Research Design
A quantitative research design was employed in this study to investigate the formulated hypotheses, as shown in Table 1. The quantitative approach involved the use of a mixed and modified survey questionnaire from two relevant studies to collect data, and statistical tools to analyze the numerical data.

2.2 Sampling Technique
The study population consisted of top management personnel (owners), project engineers, site engineers, and selected employees (foremen) from the twenty-six (26) registered construction companies in Tuguegarao City, Cagayan. A purposive sampling technique was employed to select the respondents for the study, due to factors such as time availability and permission from top management. Thus, the researchers were able to survey twenty (20) willing respondents.
2.3 Locale of the study
The study examined the total quality management (TQM) practices and organizational performance of construction companies in the local construction industry of Tuguegarao City, Cagayan, Philippines.
2.4 Research Instruments
The researchers used a questionnaire to collect data from the study's respondents. The questionnaire comprises modified, adopted constructs from two relevant studies. In part 1 of the questionnaire, which was focused on TQM practices, twenty-eight (28) constructs were adopted from the study questionnaire of Jong et al. (2018), and thirty-seven (37) constructs were from the study questionnaire of Androwis et al. (2017). In part 2, which was focused on organizational performance, four (4) constructs were from Jong et al. (2018), and twenty-one (21) constructs were from Androwis et al. (2017). The questionnaire comprised closed-ended questions and a five-point Likert Scale. The scale dimensions are specified in the table below.

A survey using the mixed and modified questionnaire was also conducted among fifteen (15) respondents from a similar population to that of the study, as suggested by the analysis of Hassan et al. (2006), to collect data testing the reliability of the questionnaire. The researchers utilized the functions of Microsoft Excel to determine Cronbach’s Alpha (∝α), which measures the internal consistency of the instrument. Interpretation of the values of Cronbach’s Alpha (∝) is shown below.

A value higher than 0.95 may indicate redundancy among items; hence, in this study, the range of acceptable values for Cronbach’s Alpha is 0.70 – 0.94. If the value is not within this range, that specific item may need revision or removal.
As shown in Table 4, the Cronbach’s Alpha value for each variable is within the range of accepted values. This indicates that the modified questionnaire exhibits good internal consistency and is reliable for data collection in the study.

2.5 Data Gathering Procedure
A survey was conducted among the respondents from the construction companies in Tuguegarao City. After obtaining permission from the top management of each construction company, including the respondents, through duly signed request letters, and ensuring the confidentiality of information, the researchers administered and collected the questionnaire. The data acquired was subjected to analysis and interpretation in the next chapter.
2.6 Analysis of the Data
Descriptive statistics were primarily used to summarize categorical data from the demographic profile of respondents. Using the computation for the mean, the average score for each TQM practice was determined, thereby providing a basis for ranking the TQM practices of the study sample. This was also used in evaluating the mean score of each IAC main category in terms of TQM practices and organizational performance.
Meanwhile, inferential statistics, specifically the independent samples t-test, were used to test the null hypotheses 1 and 2 of the study. In the correlation analysis of TQM practices and organizational performance, Pearson’s Correlation Coefficient was used to describe the direction and strength of the linear relationship.
Furthermore, multiple regression analysis was used to determine specific TQM practices that have a significant relationship with organizational performance. Lastly, the multiple regression analysis method and analysis of variance (ANOVA) were employed to test the central hypothesis (Hypothesis 3) of the study, where a p-value less than 0.05 indicates rejection of the null hypothesis.
3. Results and Discussion
3.1 Demographic Profile of Respondents
Out of the twenty-six (26) construction companies registered in Tuguegarao City, seven (7) companies have permitted their employees to participate in this study. The researchers conducted a survey and collected data from twenty (20) employees from these seven (7) respective companies.

Table 5 shows the distribution of the respondents according to the years of operation of the construction companies where they are employed. The majority of the twenty (20) respondents, which accounts for seventy percent (70.00%) of the study population, work in construction companies that have been operating for five (5) to ten (10) years now. Meanwhile, the remaining thirty percent (30.00%) of the sample works in construction companies with below five (5) years of operation. The participating construction companies in this study have been operating for ten years or below, none of which has operated for more than ten (10) years.

As shown in Table 6, half of the study sample (50.00%), equivalent to ten (10) respondents, works in construction companies that fall within the small category of the Inter-Agency Committee. Construction companies that fall under the small category can only undertake construction-related projects with a total cost of three million pesos (3M) or less. Meanwhile, the other fifty percent (50.00%) of the sample works in construction companies that are categorized as medium. In this category, the construction company is permitted to undertake a construction-related project with a total cost of up to thirty million pesos (30M). Among the participating construction companies in the study, none qualified for the large category.

From Table 7, it can be concluded that the study sample comprises respondents employed in construction companies that engage in all types of IAC Project Classification. The participating construction companies undertake projects in general engineering, general building, and various specialties.
3.2 Top Two Implemented Total Quality Management (TQM) Practices per TQM Dimension
Table 8 presents the implemented TQM practices in each dimension, which obtained mean scores in the top two highest categories. The TQM practice with the highest mean score (4.75) among all other practices was under the Customer Focus (CF) dimension. This practice aligns with identifying customers, understanding their needs, and tailoring organizational processes to meet these needs. According to Irannejad et al. (2022), this practice is essential for achieving customer satisfaction and represents a manifestation of managerial flexibility.
Meanwhile, the practice of having a well-prepared disaster and emergency preparedness system to ensure continuity of operations, which falls under the Process Control and Improvement (PC) dimension, gained the second-highest mean score (4.70). Considering that Tuguegarao City frequently experiences weather disturbances that cause temporary suspension of construction activities, this TQM practice signifies organizational resiliency. Consistent with this, Jong et al. (2018) conclude that a well-prepared operation enhances the productivity of the entire organization.

3.3 Operating Years and TQM Practices Implementation
This section presents and discusses the results of testing Null Hypothesis 1: there is no significant difference in the level of Total Quality Management (TQM) practices implementation among the participating construction companies in terms of operating years. Since there were only two groups to be compared, an independent samples t-test was conducted using IBM SPSS Statistics software to determine whether Null Hypothesis 1 (H01) should be rejected.
As shown in Table 9, the result of Levene’s Test for the null hypothesis of equal variances yielded an F-statistic of 0.016, signifying a little difference in the variances of the two compared groups. Moreover, the p-value (0.901) is greater than 0.05, which indicates that the null hypothesis cannot be rejected. Therefore, the variances of the two groups are equal, and the results obtained under the assumption of equal variances are used to interpret the hypothesis testing.
Moving on to the result of the independent samples t-test, the t-statistic value (-3.922) indicates a strong negative difference between group means. Meanwhile, the mean difference between the two groups yielded a value of -0.2304, indicating that Group B (5–10 years of operation) has a higher mean score than Group A (below 5 years). This result suggests that construction companies with fewer years of operation (less than 5 years) tend to have lower TQM scores. Finally, the two-sided p-value (0.001) is less than 0.05, which means that the observed difference between group means is unlikely to have occurred by chance and is statistically significant. In addition, the confidence interval for the mean difference (-0.3538 to -0.1070) does not include zero (0), implying a statistically significant difference between the groups. These results reject null hypothesis 1, indicating a substantial difference in the implementation of Total Quality Management (TQM) practices across construction companies with varying operating years.

3.4 IAC Category and TQM Practices Implementation
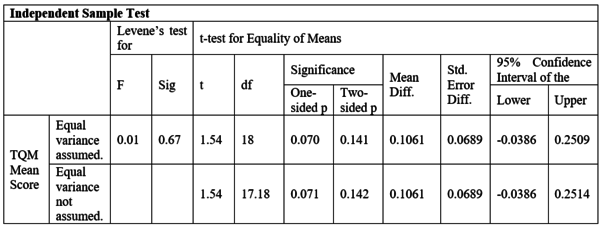
This section presents and discusses the results of testing Null Hypothesis 2: there is no significant difference in the level of Total Quality Management (TQM) practices implementation among the participating construction companies in terms of the IAC category (type of PCAB license). In parallel with Hypothesis 1, only two groups were compared, as shown in Table 4-2 in Section 4.1. Therefore, an independent samples t-test was conducted using the IBM SPSS Statistics software to determine whether Null Hypothesis 2 should be rejected.
As shown in Table 10, the result of Levene’s Test for the null hypothesis of equal variances yielded an F-statistic of 0.185, signifying a little difference in the variances of the two compared groups. Moreover, the p-value (0.672) is greater than 0.05, which indicates that the null hypothesis cannot be rejected. Therefore, the variances of the two groups are equal, and the results in the row of equal variances assumed will be used for interpreting the hypothesis test.
The result of the independent samples t-test in Table 10 shows that the t-statistic value (1.540) is relatively small compared to the value expected under the null hypothesis. Meanwhile, the mean difference yielded a value of 0.1062, indicating that Group A (small) has a higher mean score than Group B (medium). This mean difference indicates that participating construction companies in the small IAC category have higher TQM scores than those in the medium IAC category. Finally, the two-sided p-value (0.141) is greater than 0.005, indicating that the observed difference between the group means is not statistically significant. In line with this, the confidence interval for the mean difference (-0.0387 to 0.2510) includes zero (0), which negates the existence of a statistically significant difference between the groups. These results support null hypothesis 2; hence, there is no significant difference in the level of Total Quality Management (TQM) practices implementation among the IAC categories of the participating construction companies.
3.5 TQM Practices Implementation and Organizational Performance
It further presents the TQM dimensions that have significant relationships with Organizational Performance. Finally, it presents the results for testing null hypothesis 3 and justifies its acceptance or rejection. At the end of this section is the framework for the strategic implementation of Total Quality Management in construction companies of Tuguegarao City’s construction industry.
3.6 Correlation between each TQM Dimension and Organizational Performance
Based on the data collected from the respondents, a bivariate analysis was conducted using IBM SPSS Statistics software to determine Pearson’s Correlation Coefficient (r), which describes the linear relationship between each Total Quality Management (TQM) dimension, such as Employee Participation (EP), and Organizational Performance. Table 11 shows the Pearson’s Coefficient (r) for each TQM dimension mentioned in this study, along with the corresponding direction and strength of correlation.
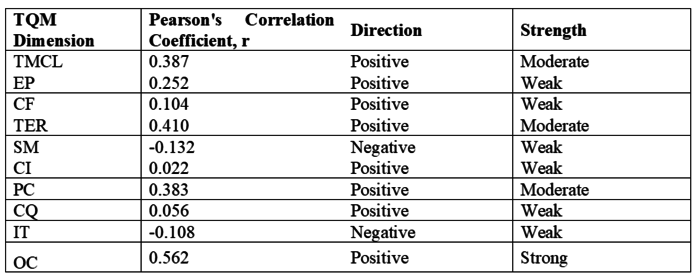
Among all the TQM dimensions, Organizational Culture (OC) has the highest value of r (0.562), indicating a strong positive correlation with Organizational Performance. It signifies that construction companies with higher scores in organizational culture practices tend to perform better in terms of organizational performance. An improvement in organizational culture is strongly linked to performance enhancements. The result further implies that a strong organizational culture that supports the TQM principles comes in hand with better performance outcomes. Azis et al. (2019) found that their study's results support this, emphasizing that organizational culture is a determinant of effective TQM implementation, which is correlated with organizational performance.
Meanwhile, other TQM dimensions — top management commitment and leadership (TMCL), training, education, and reward (TER), and process control and improvement (PC) — were found to have a moderate positive correlation with organizational performance. Although these do not correlate with organizational performance as strongly as organizational culture (OC) does, an increase in the scores of these TQM dimensions still tends to equate to a moderate increase in the organizational performance score. For instance, construction companies with higher levels of top management commitment and leadership (TMCL) support for TQM practices tend to have better performance as well. This applies equally to training, education, and reward (TER), as well as process control and improvement (PC).
In addition, TQM dimensions such as employee participation (EP), customer focus (CF), continuous improvement (CI), and cost of quality (CQ) have a positive but weak correlation with organizational performance. This translates to a slight increase in organizational performance when any of the mentioned TQM dimensions increase.
In contrast with the aforementioned TQM dimensions, supplier management (SM) and information and technology (IT) showed a weak negative correlation with organizational performance. This illustrates that as the score in supplier management (SM) increases, the organizational performance score decreases minimally. Higher scores in these mentioned TQM dimensions are slightly associated with lower scores in organizational performance. The results suggest a weak inverse relationship between these TQM dimensions and organizational performance.
3.7 Multiple Linear Regression Analysis for Testing Null Hypothesis 3
Null Hypothesis 3 assumes that there is no significant relationship between the Total Quality Management (TQM) practices and the organizational performance of the participating construction companies. Since TQM practices were grouped into ten (10) dimensions, such as customer focus (CF), and represent the independent variables potentially predicting the dependent variable (organizational performance), multiple linear regression was employed. It was also used to identify the specific TQM dimensions that are statistically significant predictors of Organizational Performance. This statistical tool allowed the researchers to investigate the collective and individual relationship of the ten (10) TQM dimensions with organizational performance.

As shown in Table 12 above, the multiple regression model revealed a strong positive linear relationship between TQM practices and organizational performance, with the value of R (.919). The model also suggests that 67.20% of the variance in the organizational performance of the participating construction companies is explained by the TQM practices. Additionally, the standard error (0.1288) is low, which increases the model’s reliability. This value suggests that the predictions of the regression model are close to actual values, therefore manifesting good accuracy and consistency. The F-statistic value (4.896) of the model, as shown in Tables 12 and 13, suggests that the variation explained by the model is significantly greater than the unexplained variation. This indicates that the TQM dimensions collectively account for a substantial portion of the variance in organizational performance.

Furthermore, the p-value (0.013) is less than the 0.05 threshold, indicating that the overall regression model is statistically significant. This result suggests that there is only a 1.30% chance that the observed strong linear relationship between TQM practices and organizational performance occurred by random chance. The p-value (0.013) supports the notion that the combination of TQM practices as predictors has a statistically significant relationship with the performance of participating construction companies as an organization. Therefore, null hypothesis 3 is rejected.
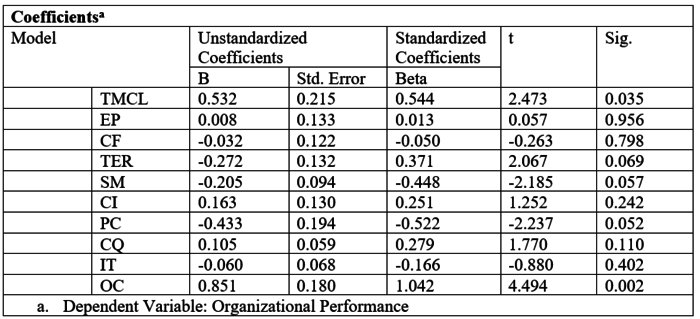
After evaluating the collective relationship between TQM practices and organizational performance, the researchers explored the individual relationship between each TQM dimension and the same dependent variable. This study aims to identify the specific TQM dimensions that have a significant positive relationship with organizational performance.
Table 14 reveals that among the ten (10) TQM dimensions examined, only Top Management Commitment and Leadership (TMCL) and Organizational Culture (OC) have a statistically significant relationship with organizational performance. This is supported by the p-values of these two TQM dimensions: 0.035 and 0.002, respectively, which are both less than the 0.05 limit.
Organizational Culture (OC) has the strongest and most statistically significant impact on organizational performance, as revealed by the unstandardized and standardized beta values. With a one-unit increase in Organizational Culture (OC), there is an equivalent 0.851-unit increase in organizational performance. Additionally, its standardized beta value (1.042) indicates that OC has the most significant influence among all predictors. The high standardized beta also suggests that organizational culture may act as a facilitating context, either amplifying or weakening the statistical impact of other TQM dimensions. For instance, even with strong top management commitment, results may fail to materialize if the organizational culture is resistant to change. This result signifies that organizational culture is the backbone of successful TQM implementation. A culture that values and integrates continuous improvement, instilling a quality culture among employees, creates an environment where TQM principles can thrive. This result solidifies the conclusion of Azis et al. in their 2019 study, emphasizing that an organization must provide a conducive environment (culture) for the effective implementation of Total Quality Management (TQM).
Top Management Commitment and Leadership (TMCL) also has a positive and statistically significant impact on organizational performance. The unstandardized beta value suggests that a one-unit increase in TMCL is associated with a 0.532-unit increase in organizational performance. Meanwhile, the standardized beta value (0.544) indicates a strong relative influence among the TQM dimensions, further implying that it makes a substantial contribution in predicting organizational performance. The significance of TMCL in the model aligns with the established findings of Teeradej et al. (2020), emphasizing that active and strong leadership from the top management is required in the successful implementation of TQM. The total quality initiative begins with the top management of any construction company. Leaders’ commitment sets the tone, defines priorities, and influences employees’ involvement in transitioning to a total quality culture. This is supported by the study findings of Rallang and Gutierrez (2024), which emphasize that top management is the highest policy-making body, thereby justifying the significance of their leadership practices in total quality management.
The results of this multiple linear regression suggest that to implement Total Quality Management strategically, specifically for construction companies in Tuguegarao City, they must focus on two key factors: top management commitment and leadership (TMCL), and organizational culture (OC). Both are statistically and theoretically supported; therefore, investing in these key factors ensures performance gains for the organization.
4. Conclusion and Recommendation
4.1 Conclusion
The level of Total Quality Management (TQM) Practices implementation among participating construction companies in Tuguegarao City varies significantly in terms of operating years. Participating construction companies that have been operating for more than five (5) years have a substantially higher level of TQM Practices implementation.
The level of Total Quality Management (TQM) Practices implementation of participating construction companies in Tuguegarao City does not significantly differ in terms of the Inter-Agency Committee category. Although small construction companies scored higher in TQM than medium-sized construction companies, the mean difference is not statistically significant.
The implementation of Total Quality Management (TQM) Practices has a significant relationship with the organizational performance of the participating construction companies. These TQM practices have a significant predictive value for the performance of the participating construction companies in Tuguegarao City.
Total Quality Management Practices within an organizational culture (OC), as well as top management commitment and leadership (TMCL), are statistically significant in predicting the organizational performance of participating construction companies in Tuguegarao City. Focusing on these two key factors allows strategic TQM implementation and optimized performance outcomes.
4.2 Recommendation
The results of the study are based on the perceptual data collected from the respondents; hence, the relationship between Total Quality Management (TQM) practices and organizational performance is emphasized as a correlation and has a predictive nature. The causative relationship between these two has not been investigated in this study; only correlations have been examined. Thus, the researchers recommend exploring empirical evidence for a potential causal relationship between TQM practices and the organizational performance of construction companies. The results of this study can serve as a basis for determining the variables to be included in future empirical investigations.
In addition, the researchers suggest expanding the study population and increasing the sample size for future similar studies. Instead of focusing on one municipality, future researchers can opt for a province-wide study. In line with this, the researchers recommend using probabilistic sampling to enhance the generalizability of the collected data.
The standardized beta coefficient of Organizational Culture (OC) in the multiple linear regression is relatively high compared to other TQM dimensions. Given the strongly significant predictive relationship with organizational performance, the researchers recommend investigating its potential impact on other TQM factors, such as employee participation. Future studies may investigate the organizational culture of construction companies in Tuguegarao City, for instance, and how it affects the implementation of TQM practices.
Acknowledgement:
The authors would like to extend their appreciation to the Local Government Unit of Tuguegarao City for providing a list of registered construction companies, to the respondents who took the time to complete the survey questionnaire, and to the faculty members of the Civil Engineering Department at Cagayan State University-Carig Campus for their guidance.
Funding:
The authors received no direct funding for this research.
Conflict of Interest:
The authors declare that there is no conflict of interest.
References
Aawag, Mohsen, Mohammed, Alawag, Wesam, Salah, Alaloul, Mohd, Shahir, Liew, Al-Hussein, M. H., Al-Aidrous, Syed, Saad, Syed, Ammad. (2020). Total Quality Management Practices and Adoption in Construction Industry Organizations: A Review. doi: 10.1109/IEEECONF51154.2020.9319992
Adulapuram, N. A., Annaladas, N. M., Allikanti, N. B., & Kausar, N. A. (2024). Achieving operational excellence: Key factors in total quality management for pharmaceutical industry. World Journal of Biology Pharmacy and Health Sciences, 18(2), 327–331.
Aggarwal, S., & Singh, A. K. (2022). "Mediating Role of Psychological Capital between Dimensions of Organisational Culture and Employees’ Performance: A Study of Select Organisations". Ramanujan International Journal of Business and Research, 7(1), 82–92.
Ahamat, A. (2022). View of Analysis of Total Quality Management Practices in the Construction Sector Performance.
Al-Ani, R. Z., & ALMashhadani, H. M. (2024). Total Quality Management. Journal of Engineering, 10(3), 345–358.
Alawag, A. M., Alaloul, W. S., Liew, M. S., Baarimah, A. O., Musarat, M. A., & Al- Mekhlafi, A. A. (2023). The Role of the Total-Quality-Management (TQM) Drivers in Overcoming the Challenges of Implementing TQM in Industrialized-Building-System (IBS) Projects in Malaysia: Experts’ Perspectives. Sustainability, 15(8), 6607.
Alghaseb, M., & Alshmlani, T. (2022). OSH Performance within TQM Application in Construction Companies: A Qualitative Study in Saudi Arabia. International Journal of Environmental Research and Public Health, 19(19), 12299.
Alsaqer, S., Katar, I. M., & Abdelhadi, A. (2024). Investigating Total Quality Management Strategies for Sustainable Customer Satisfaction in GCC Telecommunications. Sustainability, 16(15), 6401.
Ameer, M. S. (2018). Total Quality Management Practices and Supply Chain Management: Understanding Linkages from the Logistics Sector of Pakistan. SEISENSE Journal of Management, 1(4), 22–28.
Arikkök, M. & Kajaani University of Applied Sciences. (2016). Total Quality Management.
Aziz, A., Sumantoro, I. B., & Maria, D. (2019). Total Quality Management of Micro, Small, and Medium Enterprises (MSMES), and the Impact on Organizational Culture and Performance: Case in an Emerging Country. Polish Journal of Management Studies, 19(1), 32–45.
Bannor, R. K., Oppong-Kyeremeh, H., Boateng, A. O., Kyire, S. K. C., Bold, E., & Nimo, M. A. (2024). Total Quality Management Practices among Women Shea Processors: Implications for Job Performance and Household Expenditure. Cleaner and Circular Bioeconomy, 100118.
Bennegreg, S. P. (2023). A Critical Analysis of the Philippine Construction Industry: Current Trends, Forecast, and Business Focus for Engineering Design Firms.
Budayan, C., & Okudan, O. (2022). Roadmap for the implementation of total quality management (TQM) in ISO 9001-certified construction companies: Evidence from Turkey. Ain Shams Engineering Journal, 13(6), 101788.
Cagayan Valley’s Economy Grew by 6.2 percent in 2023; 7th Fastest Growing Economy among 17 Regions in the Country | Philippine Statistics Authority. (2024, April 25).
Document information

Published on 02/11/25
Submitted on 02/11/25
Volume 1, Issue Issue-2, December, 2025
DOI: https://doi.org/10.5281/zenodo.17563819
Licence: Other
Share this document
Keywords

claim authorship
Are you one of the authors of this document?