Abstract: Existing experimental methods or traditional numerical methods struggled to separate the resistance caused by a vessel's movement and the impact of waves. However, the impact of waves significantly affected the stability and safety of Unmanned Underwater Vehicles (UUVs). To summarize the influence of different attitudes and sea conditions on ocean wave impact, this work first proposed a method to separate the influence of ocean waves. This method used the unsteady finite volume method to analyze the forces on the vehicle in both wave and calm water environments. It also employed a separation formula to isolate the wave impact based on a separation equation. Then, this work selected a specific UUV as the research subject and applied this method to separate the wave impact under various attitudes and sea conditions. The results were then reconstructed. Finally, the effects of various factors on wave impact were summarized, including wave height, wave period, pitch angle, heading angle, velocity, and diving depth.
Keywords: UUV, wave influence, numerical method, characteristics
1 Introduction
Ocean waves are a type of periodic vibration that propagates in a certain direction to form waves. With an astonishing energy accumulation, it greatly affects the maneuverability and stability of ships. Therefore, the 28th ITTC conference in 2017 even established a special committee on maneuverability in waves [1], marking the impact of waves on ships as an important research direction in the future field of ship hydrodynamics [2]. Most current researches on the impact of wave environments on ships focuses on vessels with free surfaces, such as the work by Carrica et al., who achieved free turning and zigzag maneuvering movements of self-propelled ships under wave conditions [3]; Wang et al. extended the numerical simulation of self-propelled ship maneuvering movements to complex wave conditions using overlapping grid technology [4]. Submarines and other underwater vehicles can avoid the impact of free surface waves by diving below the ‘wave base’ [5-6]. Therefore, scholars both domestically and internationally have mainly focused their researches on the effects of internal waves on the attitude and load characteristics of submarines [7-9].
However, most UUVs have small displacement and small turning inertia, and due to their operational depth, they cannot completely avoid the impact of free surface waves below the ‘wave base’ in most cases. Especially in some harsh sea conditions, waves can even lead to mission failure for UUVs. Considering the force characteristics in the wave environment and responding to them in the control module of UUVs is the most important and economical method to improve their stability and safety [10]. However, existing experimental methods or traditional numerical methods find it difficult to separate the resistance generated by the motion of the vehicle from the influence of ocean waves. As a result, it is difficult to summarize the impact of different attitude conditions and sea conditions on the effect of waves
Therefore, this work takes a certain UUV as the research object, uses the unsteady finite volume method to analyze the forces on the vehicle in both wave and calm water environments. Subsequently, a separation formula for the impact of ocean waves was established, and based on this formula, the impact of the waves was isolated. At the same time, this work uses fitting methods to reconstruct the numerical results and studies the characteristics of UUVs being influenced by ocean waves, summarizing the influence of wave height, wave period, pitch angle, heading angle, velocity, and depth on the variation of ocean wave impact. Due to the low center of gravity of the unmanned underwater vehicle, the roll angle generated during the experiment is small and less than 8 degrees, which results in strong lateral stability. Therefore, the impact of the ocean wave impact caused by the roll angle is not significant.
2 Establishment of a separation model for wave influence
2.1 Mathematical model
In this work, a description of the gas-liquid two-phase flow, based on the VOF (Volume of Fluid) model, is implemented, where seawater is the primary phase and air is the secondary phase. The interface between the two phases is handled using the geometric reconstruction method. Since the purpose of this work does not involve the study of the temperature field, the finite volume method is used to solve mass-conservation Equation (1) and momentum conservation Equation (2), and the model is employed as the turbulence equation [11]:
|
|
(1) |
|
|
(2) |
Here, represents the volume fraction of seawater ( , represents the unit volume occupied by seawater, represents the total volume of seawater), represents the density of seawater, represents velocity vector, represents time, represents pressure, and represents gravity vector. In Equation (2), represents density and represents dynamic viscosity, both are calculated by Equation (3) and (4) respectively.
|
|
(3) |
|
|
(4) |
Here, represents the volume fraction of air ( ), represents the density of air, represents the dynamic viscosity of seawater, and represents the dynamic viscosity of air.
To study the influence of sea condition parameters, this work utilizes the fifth-order Stokes wave theory for wave generation. This theory accounts for the nonlinear effects induced by the free liquid surface, making it more complex and practical for engineering applications than the linear wave theory [12]. The wave surface equation and the potential function are shown as follows:
|
|
(5) |
|
|
(6) |
Here, is the wave velocity, and the coefficient and wave number are solved by combining the following equations:
|
|
(7) |
Here, represents the height of the ocean waves, represents wavelength, represents total depth, , represents the wave period, and the coefficients , , and can be referred to in references [13-14].
2.2 Calculation model
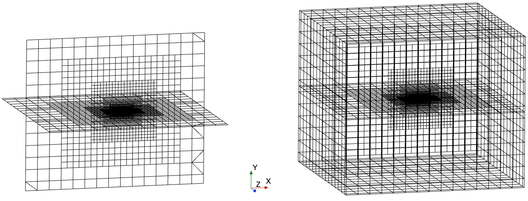
The subject of this work is a certain UUV, with an overall length of 10.6 m and a main body diameter of 1.18 m (Figure 1). To investigate the force characteristics of the main body under wave conditions, this work performs geometric cleanup on the rudder and propeller. Based on the geometric model, two sets of grid models are established using an identical grid division strategy (Figure 2). The grid model on the left is used to calculate the forces on the UUV under wave conditions, while the grid model on the right is for calculating the forces in a quiescent water state [15-16]. Both models use Cartesian grids for division, with a refined grid strategy applied to the surrounding area of the UUV, resulting in a total of 4 million grids.
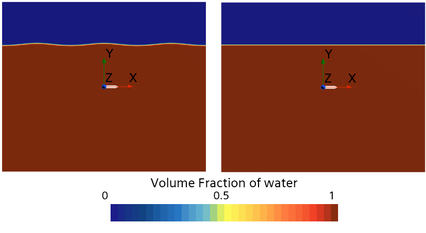
Subsequently, the mesh models are initialized based on the VOF (Volume of Fluid) model (Figure 3), where the gas-liquid interface in the wave environment model is described by the wave surface equation shown in Equation (5). For both environmental grid models, aside from the top boundary, the remaining boundary conditions are set as velocity inlet boundaries, with a horizontal velocity of and a vertical velocity of . The density of seawater is 1024 kg/m³, and the density of air is 1.18 kg/m³.
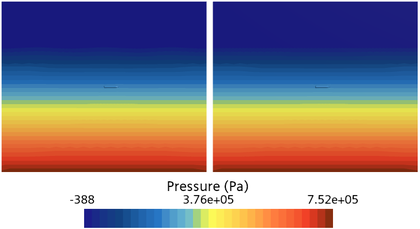
The bottom employs two sets of grid models with the top using pressure outlet boundary conditions, where the atmospheric pressure is set at 1 atm. The pressure fields for both environmental grid models are initialized using the hydrostatic pressure theory (Figure 4).
Subsequently, the SIMPLE algorithm is used to calculate the forces acting on the UUV under two different environments. The calculation timestep is 0.01 seconds, with a total computation time of 15 seconds. After each timestep's iterations are completed, the wave influence force and torque are separated using Equation (8).
|
|
(8a) |
|
|
(8b) |
|
|
(8c) |
|
|
(8d) |
Here, the superscript denotes the wave environment, and the superscript denotes the quiescent water environment, each corresponding to the models on the left and right of Figure 2, respectively. represents the flow field pressure of the UUV wall element , represents the normal direction vector of the UUV wall element in the local coordinate system , represents the shear stress experienced by the UUV wall element , represents the area of the wall element , and represents the moment arm distance vector from the centroid to the wall element in the local coordinate system .
To better analyze the characteristics of wave influence, the wave torque in Equation (8) is taken with the origin of the local coordinate system shown in Figure 3 as the center of moment. This local coordinate origin is located at the center of the bow of the vessel. The coordinates of the actual center of gravity of the UUV in the local coordinate system are (5.4, -1, 0). To obtain the torque at the actual center of gravity or to convert the torque at the center of gravity when the UUV mission changes, Equation (9) is used for the torque transformation.
|
|
(9) |
Here, , , and represent the components of the actual center of gravity torque in the hull coordinate system, while , , and are the components of in the hull coordinate system. , , and represent the distances from the actual center of gravity to the origin .
To ensure that the UUV remains centered in the mesh at all times, after each timestep calculation, the grid and local coordinates shown in Figure 2 are translated as a whole by displacement . Here, represents the horizontal projection vector of the UUV's velocity in the global coordinate system.
3. Analysis of the changes in wave influence
In order to obtain the influence of different wave heights, wave periods, UUV pitch angles, heading angles, velocities, and depths on the variation of wave forces, a uniform sampling method is adopted within the range of the aforementioned operational and sea condition parameters to establish a computational sample database in this work. (Table 1). Through various combinations, the number of samples reaches 511,758.
| Attitude parameters | Pitch angle (°) | -12,-9,-6,-3,0,3,6,9,12 |
| Heading angle (°) | 0,15,30,45,60,75,90,105,120,135,150,165,180 | |
| Velocity (kn) | 0,1,2,3,4,5 | |
| Submergence depth (m) | 5,7.5,10,12.5,15,17.5,20,22.5,25 | |
| Sea condition parameters | Wave height (m) | 0.5,0.75,1,1.25,1.5,1.75,2,2.25,2.5 |
| Wave period (s) | 5,5.5,6,6.5,7,7.5,8,8.5,9 |
After calculating the aforementioned samples, this work fits the results to obtain a fitting model, which enables the output of wave influence force and torque for any parameter combination. In actual engineering, variations in the UUV's internal mission modules can cause the actual center of gravity to differ from the initially designed one. The fitting results can also provide wave influence force and torque for any center of gravity, aiding in the balancing process [17].
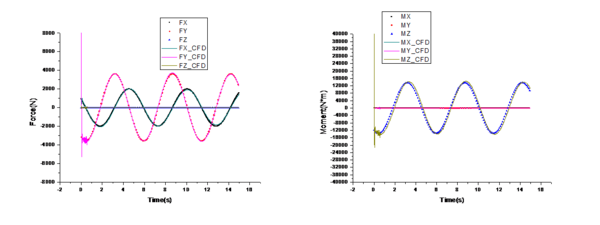
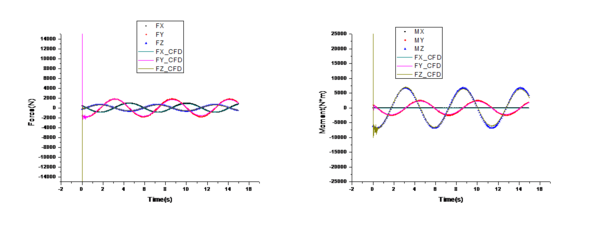
The computational results are compared with the fitting results in Figure 5, revealing a high degree of overlap between the fitting and CFD results. The CFD results show oscillations in the first second due to the flow field not having formed a stable structure yet. These oscillations are not conducive to the subsequent control module input or the synthesis of complex wave spectra for wave influence. Therefore, it is crucial to fit and reconstruct the fitting model for all the CFD results of the samples mentioned in Table 1. To verify the accuracy of the fitting model, any parameters within the range described in Table 1 are randomly selected for CFD calculations and are then compared with the fitting results in this work. The comparison shows that the results from the random test samples also highly coincide with the fitting model (Figure 6).
3.1 The effect of wave height
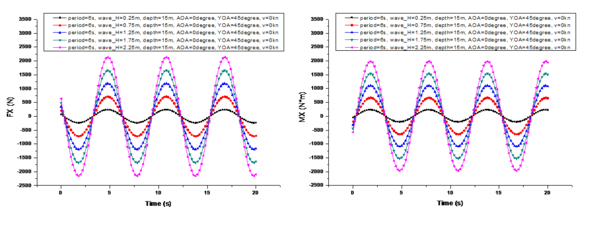
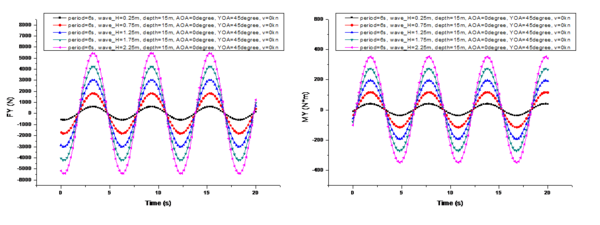
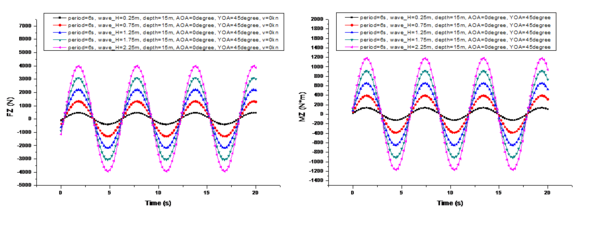
A comparison of the changes in the marine environmental influence under different wave heights is shown in Figure 7 (here, 's center of moment is the center of gravity of the UUV during a specific mission, and in subsequent analysis refers to the torque experienced by the center of gravity in the hull coordinate system). To facilitate comparison, the conditions shown in Figure 7 are as follows: is 6s, is 15m, is 0°, is 45°, and is 0kn. Thewave heights are 0.25m, 0.75m, 1.25m, 1.75m, and 2.25m, respectively.
From the comparison shown in Figure 7, it can be observed that when the UUV's velocity is 0 knots, the variation period of is not affected by the wave height. And its period is exactly the same as the wave period. However, the amplitude of the period variation of is linearly positively correlated with the change in wave height. Additionally, there is a phase difference in the periodic variation among the three components of . The phase difference in the period variation of is 1.5 seconds more than that of (i.e., ), and the phase difference in the period variation of is another 1.5 seconds more than that of (i.e., ).
After summarizing, the following equation can be obtained:
|
|
(10) |
Here, represents the initial phase difference, while , , and correspond to the phase differences in the periodic variations of , , and , respectively.
The three components of are influenced not only by but also by the difference between the force center ( ) and the actual center of gravity (Equation 9). Therefore, this paper only conducts qualitative and quantitative analysis on the variation pattern of .
3.2 The effect of wave period
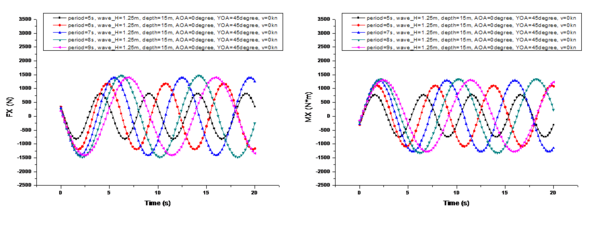
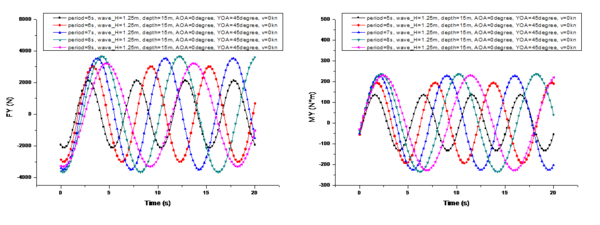
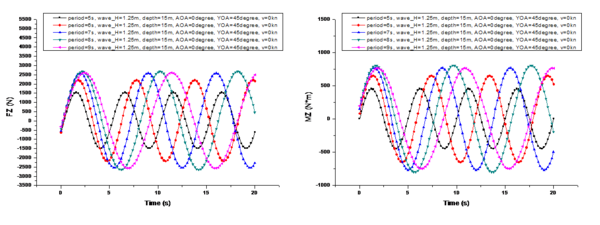
Figure 8 presents a comparison of the changes in the marine environmental impact under different wave periods, with the specific conditions as follows: is 1.25m, is 15m, is 0°, is 45°, and is 0 kn. The wave periods are 5s, 6s, 7s, 8s, and 9s, respectively.
From the comparison shown in Figure 8, it can be observed that when the UUV's velocity is 0 kn, the variation period of matches the wave period for each condition. The amplitude change of exhibits a strong nonlinear growth relationship with the wave period, with an inflection point occurring at a certain wave period value. The phase difference variations of the individual components of under different conditions shown in Figure 8 still comply with Equation (10).
3.3 The effect of pitch angle
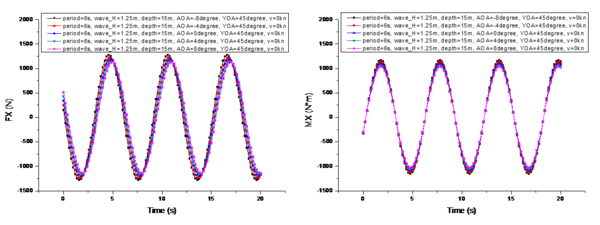
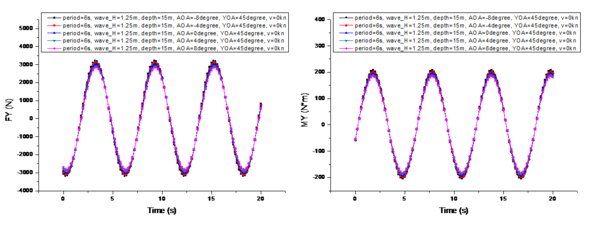
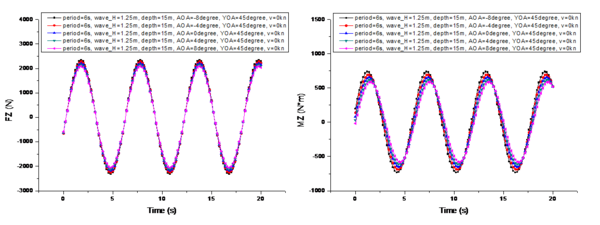
It presents a comparison of the changes in the marine environmental impact under different UUV pitch angles in figure 9 , with the specific conditions as follows: is 6s, is 1.25m, is 15m, is 45°, and is 0 kn. The pitch angles are -8°, -4°, 0°, 4°, and 8°, respectively.
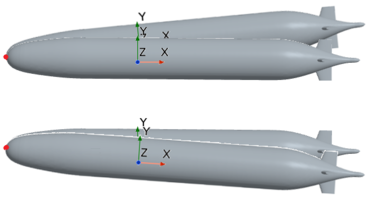
From the comparison shown in Figure 9, it can be observed that the pitch angle has a minimal effect on . The variation period for different is the same as the wave period, which is 6s. As the pitch angle changes from -8° to 8°, the amplitude variation of shows a monotonic decrease. This phenomenon is primarily due to the gradual decrease in the depth at which the UUV's actual center of gravity is located (with a depth change exceeding 8%) as the UUV's pitch angle varies from -8° to 8° around its bow center point, leading to a gradual decrease in the amplitude variation of (Figure 10). Additionally, apart from the change in depth, the horizontal position of the UUV's center of gravity also shifts forward with the change in pitch angle (Figure 10). This affects the initial phase difference in Equation (10), meaning decreases as the absolute value of the pitch angle increases. Since the horizontal forward shift caused by the UUV's pitch angle change is not significant, the initial phase difference does not change markedly. When the pitch angle is -8° or 8°, the initial phase difference is 0.28579s, and when the pitch angle is 0°, the initial phase difference is 0.28301s, with a difference of about 1%. The periodic phase differences of the three components of still satisfy Equation (10).
In actual engineering applications, the UUV's pitch angle changes are centered around its center of gravity. It has no change in the depth or relative horizontal position of the center of gravity. Therefore, the actual changes in the amplitude and initial phase difference of caused by pitch angle variations in engineering practice are smaller. Moreover, while the UUV's shape does not change during different missions, its center of gravity position varies with the equipment for each mission. To obtain environmental influence variation patterns independent of the center of gravity, this work can only consider pitch angle changes around the bow center (for the same reason, other attitude parameter variations in this work are also based on the bow center, meaning the conclusions drawn here are independent of the actual center of gravity. This is another reason why this work only summarizes the variation patterns of and only presents for demonstration purposes).
In short, the marine environmental impact varies minimally under different pitch angles.
3.4 The effect of heading angle
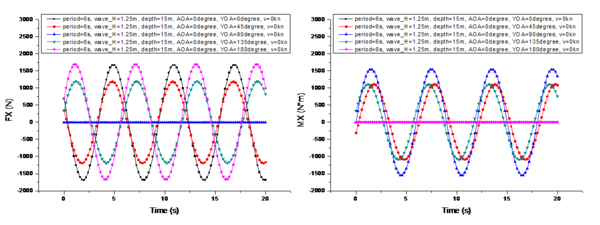
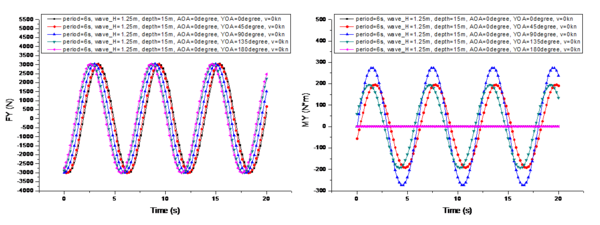
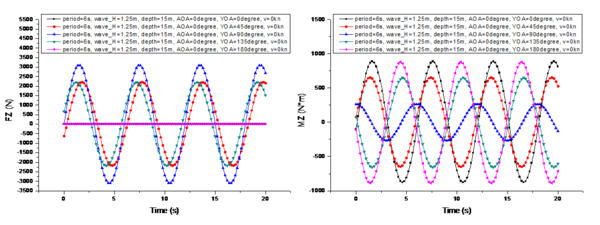
It presents a comparison of the changes in the marine environmental impact under different UUV heading angles in figure 11, with the specific conditions as follows: is 6s, is 1.25m, is 15m, is 0°, and is 0 kn. The heading angles are 0°, 45°, 90°, 135°, and 180°, respectively.
From the comparison shown in Figure 11, it can be observed that changes in the heading angle have no effect on the variation period of . Its variation period is the same as the wave period. The heading angle significantly affects the two horizontal components of , (Figure 11a) and (Figure 11e). When the heading angle is 0° or 180°, meaning the UUV is head-on or tail-on to the waves, the longitudinal force reaches its maximum amplitude variation, while the transverse force 's amplitude variation is zero. As the UUV begins to turn towards 90°, the amplitude variations of and start to inversely affect each other. When the UUV fully turns to 90°, the amplitude variation of becomes zero, while the amplitude variation of reaches its maximum. Moreover, the maximum amplitude variation of 's period is greater than that of 's period, as the UUV's frontal area is the largest at a heading angle of 90°, with the entire side exposed to wave forces. Regardless of the heading angle, the vertical component 's amplitude variation remains unchanged. Additionally, the heading angle also affects the initial phase difference of the period variation of . When is at 0° and 180°, the difference in the initial phase difference is 0.8s. Similarly, the different initial phase differences are also due to the paper's approach of using the bow center as the reference point for the UUV's heading angle changes.
3.5 The effect of velocity
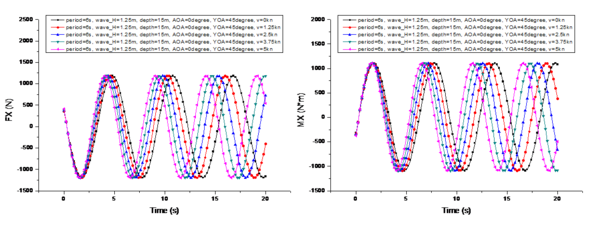
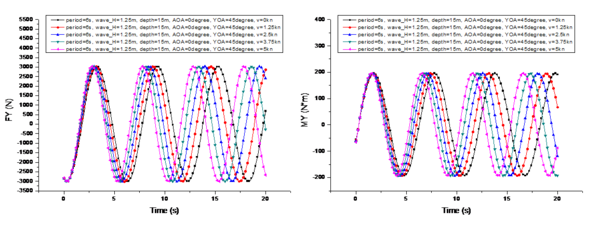
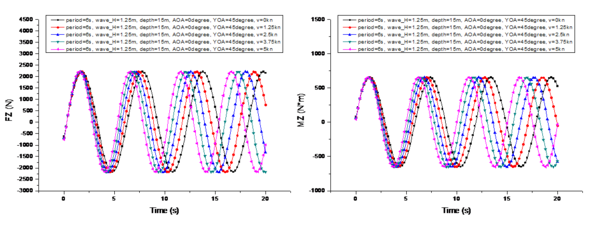
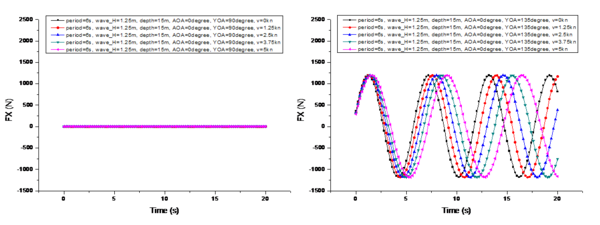
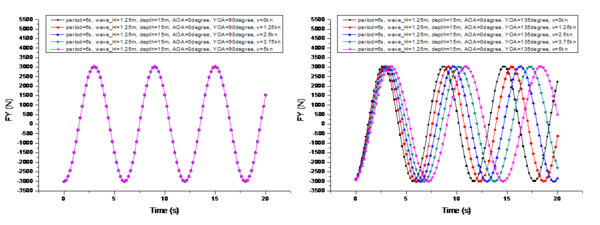
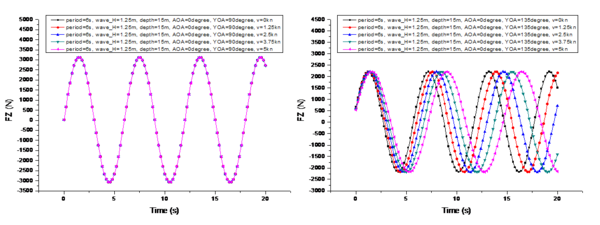
It presents a comparison of the changes in the marine environmental impact under different UUV velocities in figure 12, with the specific conditions as follows: is 6s, is 1.25m, is 15m, is 0°, and is 45°. The velocities are 0 kn, 1.25 kn, 2.5 kn, 3.75 kn, and 5 kn, respectively.
From the comparison shown in Figure 12, it can be observed that the velocity has no effect on the amplitude of the period variation of , but it significantly influences the period variation of . When the heading angle is 45°, the period variation of decreases as the velocity increases. When the heading angle is 0° (Figure 13), the period variation of is independent of the velocity. When the heading angle is 135° (Figure 13), the period variation of increases with the velocity. Similarly, under the same heading angle conditions, the velocity has no effect on the amplitude of the period variation of . The main reason for the above phenomena is that as the UUV's velocity increases. If the heading angle is less than 90°, the number of waves passed per unit time increases, meaning the relative wave period becomes smaller. Conversely, if the heading angle is greater than 90°, the number of waves passed per unit time decreases, meaning the relative wave period becomes larger. When the heading angle is 90°, the wave period remains relatively unchanged. Therefore, the variation period of the marine environmental impact is mainly influenced by three factors: the wave period , the velocity , and the heading angle . Combining the definition of the wave period in the fifth-order Stokes wave theory [11-12] with the conclusions of this work, the variation period of the marine environmental impact is summarized as follows:
|
|
(11) |
|
|
(12) |
Here, represents the wave number, and represents the relative wave velocity.
Additionally, based on the results shown in Figures 12 and 13, it can be observed that the phase differences of the three components of still satisfy a certain relationship. However, unlike Equation (10), in Equation (10) will be replaced by , that is:
|
|
(13) |
3.6 The effect of diving depth
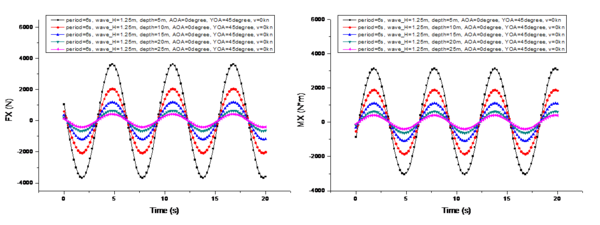
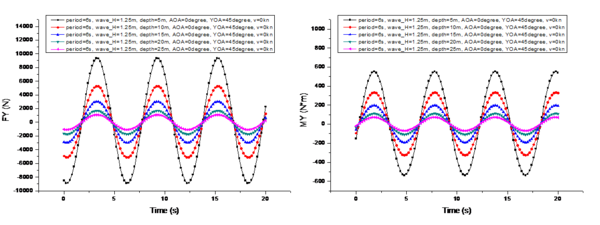
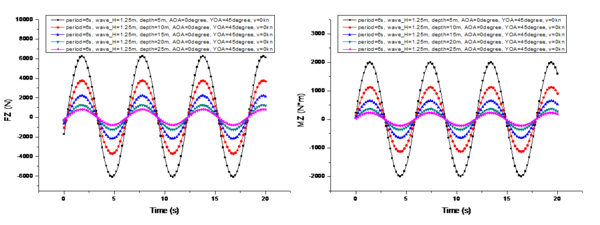
It presents a comparison of the changes in the marine environmental impact under different UUV depths in figure 14, with the specific conditions as follows: is 6s, is 1.25 m, is 0°, is 45°, and is 0 knots. The depths are 5 m, 10 m, 15 m, 20 m, and 25 m, respectively.
From the comparison shown in Figure 14, it can be observed that changes in depth have no effect on the variation period of and the phase differences of the component periods. However, there is a significant impact on the amplitude variation of , especially the vertical force . When the UUV's depth is 5 m, the amplitude of is 9346 N. As the UUV dives to 10 m, 15 m, 20 m and 25 m, the amplitude of decreases by 43.5%, 67.8%, 81.8% and 88.5%, respectively. Notably, when the UUV dives to 25 m, the amplitude variations of 's components are very small, which further leads to the amplitude variations of 's components being equally minimal. In practical engineering, the changes in the vehicle's attitude caused by can almost be neglected. The depth of 25 m is already close to the depth of the ‘wave base’ defined in references [5-6] (the diving depth of the ‘wave base’ is half of the wavelength of the waves, , which is 28 m).
4. Conclusions
To investigate the patterns of how UUVs are affected by waves, this work initially introduces a method for separating the influence of waves. Based on this method, the results of wave influence under various sea conditions and UUV operating scenarios are reconstructed, summarizing the effects of wave height, wave period, pitch angle, heading angle, velocity, and diving depth on the variation of wave influence.
(1) The influence of waves on UUVs is subject to changes in wave fluctuations and also exhibits periodic variations.
(2) The amplitude of the wave influence force is linearly positively correlated with wave height and non-linearly positively correlated with wave period (a certain period value can lead to an inflection point in amplitude growth), and non-linearly negatively correlated with the UUV's depth. Moreover, the heading angle affects the amplitude of the longitudinal and transverse wave influence components of the UUV, but has little effect on the vertical component.
(3) The variation period of the wave influence is positively correlated with the wave period, and both the heading angle and velocity can influence the variation period of the wave influence.
(4) There is a constant phase difference among the three components of the wave influence force.
References
[1] ITTC. Tasks and structure of the 29th ITTC technical committees and groups. Proceedings of the 28th International Towing Tank Conference. Wuxi, China, 1:393-408, 2017.
[2] Wang J.H. and Wang D.C.. CFD simulations of ship maneuvering motion. Journal of Harbin Engineering University, 39(5):813-824, 2018.
[3] P.M. Carrica, F. Ismail, M. Hyman et al. Turn and zigzag maneuvers of a surface combatant using a URANS approach with dynamic overset grids. Journal of marine science and technology, 18(2):166-181, 2013.
[4] Wang J.H. and Wang D.C.. CFD simulations of free running ship under course keeping control. Ocean engineering,141:450-464, 2017.
[5] H.V. Thurman and A.P. Trujillo. "Essentials of Oceanography", Edition 5, Prentice Hall, pp.240-243, 2001.
[6] F. Ghasemzadeh, A. Ursolov, M. Moonesun et al. Effective depth of regular wave on submerged submarine. Indian Journal of Geo Marine Sciences, 48(9):1476-1484, 2019.
[7] Li J., Zhang Q. and Chen T.. Numerical Investigation of Internal Solitary Wave Forces on Submarines in Continuously Stratified Fluids. Journal of marine science and engineering, 9(12):1374, 2021.
[8] Cui J., Dong S., Wang Z. et al. Kinematic response of submerged structures under the action of internal solitary waves. Ocean Engineering, 196:106814, 2020.
[9] Sun P., Li H.F. and Kang. X.B.. Numerical simulation on free motion response of a submarine induced by internal solitary wave. Revista Internacional de Métodos Numéricos para Cálculo y Diseño en Ingeniería, 39(4):1-12, 2023.
[10] Dezheng Z, Lijing Y, Xuanwei C, et al.Robust Identification Algorithm for Unmanned Underwater Vehicles Dynamics Model Parameters[J]. Journal of Physics: Conference Series, 2338(1), 2022.
[11] M. Ajmi, N. Hnaien, S. Marzouk et al. Numerical investigation of heat transfer enhancement of an inclined heated offset jet. International Communications in Heat and Mass Transfer, 116, 2020.
[12] On Stokes wave solutions[J]. Proceedings of the Royal Society A, 478(2258): 20210732-20210732, 2022.
[13] Zhu Y.R.. Analysis of the applicability of several wave theories. Coastal Engineering, 2(2):11-27, 1983.
[14] J.D. Fenton. A fifth-order Stokes theory for steady waves. Journal of Waterway, Port, Coastal, and Ocean Engineering, 111:216-234, 1985.
[15] Zekai Z, Weishi M, Jun D, et al.Design and Implementation of a Modular UUV Simulation Platform[J]. Sensors, 22(20): 8043-8043, 2022.
[16] Zhiyuan H, Zheng W and Yang Y. Research on Three Dimensional Global Path Planning of Unmanned Underwater Vehicle[J]. Journal of Physics: Conference Series, 1894(1), 2021.
[17] Yan Z, Wang L, Zhang W, et al. Polar Grid Navigation Algorithm for Unmanned Underwater Vehicles[J]. Sensors, 17(7): 1599, 2017.
Document information
Accepted on 25/04/24
Submitted on 11/03/24
DOI: 10.23967/j.rimni.2024.04.004
Licence: CC BY-NC-SA license
Share this document
Keywords
claim authorship
Are you one of the authors of this document?

