Abstract
Structural robustness, an index for structural geometrical agreement, is used to assess the alternative load paths of structures subjected to loads. Therefore, robustness can be extended to evaluate the robustness of bridges with local failure in individual members. In this work, a method that includes the use of a radar chart is proposed to assess the robustness of cable-stayed bridges by considering the mechanical performance of bridges with local failure in the cables and chords. Four plans regarding the truss girder and cables are designed to reinforce a damaged bridge. The results indicate that these two alternative path plans disperse the stress in the members in the truss girder, and the reduction of alternative path plan 2 (AP2) is greater than that of alternative path plan 1 (AP1). Similarly, the two plans regarding the cables are found to decrease the vertical displacement of the truss girder under gravity, and the reduction of the first plan is slightly greater than that of the second plan. Consequently, the two alternative load path plans improve the indexes of the truss girder, leading to an increase in the value of IRob to 0.74. Moreover, regarding the truss girder, the two alternative cable plans are used to increase the indexes, and the values are all found to be larger than the corresponding values of the intact cable-stayed bridge. The proposed method including the use of a radar chart, which is associated with several indexes, can be used to assess the structural robustness of intact and damaged bridges, thereby allowing for the development of reinforcement plans.
Keywords: Bridge engineering, structural robustness, alternative load path, cable-stayed bridges with a steel truss girder, damaged bridge, radar chart
1. Introduction
Cable-stayed bridges with a steel truss girder have been widely constructed to carry both vehicle and train loads over rivers and valleys, and are characterized by a super large span and sufficient stiffness due to the steel truss girder. However, due to their weak robustness, serious bridge collapses have occurred, leading to devastating damages in traffic systems and severe injuries. For example, due to the damage of its individual chords and joints by fatigue, the I-35W Highway Bridge over the Mississippi River in Minneapolis, Minnesota, USA, suddenly collapsed, causing the deaths of 13 people, and injuries to 145 others. Similarly, due to the sudden rapture of a single rod leading to the fracture of a series of rods, the Silver Bridge over the Ohio River between Ohio and West Virginia, USA, resulted in the collapse of the entire bridge and the deaths of 46 people. An overview of similar catastrophes has found that highway bridge collapses are caused by human error (2000–2014), including the inadvisable management of the engineering owner, design deficiencies, poor construction practice, dereliction of supervision, vehicle overloading, vessel collision, and a lack of maintenance and inspection [1]. There are three categories of existing approaches for structural robustness assessment, namely deterministic methods, probability and reliability methods, and risk-based approaches.
Deterministic methods are used to assess the robustness of structures under different loads via the system strain energy, load-carrying capacity, and structural stiffness. Based on reliability theory, the System Factor Table has been developed for simple and continuous bridges with multi-girders, and the step-by-step calculation procedure is recommended to assess the robustness of bridges with complex systems [2]. By investigating the collapse behavior of suspension and cable-stayed bridges in cable loss scenarios, Scheller revealed that a dynamic amplification factor of 2.0 is required to meet the safety requirements for cables and pylons; moreover, it was found that a cable-stayed bridge cannot bear simultaneous sudden failure in more than two of its cables [3,4]. To identify various possible collapse modes, Jiang established a topological hierarchy model of the collapsed bridge at Florida International University (FIU), Miami, Florida, USA, using the Improved Structural Vulnerability Theory (ISVT) clustering process. The findings revealed that the maximum vulnerability index of the bridge increased dramatically due to the failure of one of its components [5]. By investigating the collapse accident of the Heyuan Dongjiang Bridge, Heyuan, Guangdong Province, China, Sun found that the deck-type arch bridge was sensitive to the foundation displacement, and an overlarge foundation displacement may have caused the collapse of the bridge [6]. To explore the effect of collapse control on a continuous girder bridge, Li considered three collapse control systems, namely the Collapse High Damping Rubber (CHDR), Collapse Fluid Viscous Damper (CFVD), and Collapse Lock-Up Clutch (CLUC) systems, to analyze the respective collapse modes and collapse control strategies [7]. Khoei numerically simulated the progressive collapse of the Hongqi Bridge, Zhuzhou, Hunan Province, China, and found that the impacting force of the deck-to-pier collision was several times greater than the shear capacity of the piers; these findings were verified by field observations. Based on the results, it was suggested that collapse propagation or deck-to-pier collision be prevented using other alternatives [8]. Seyedkhoei investigated the collapse behavior of regular, semiregular, and irregular bridges under earthquake conditions, and the results indicated that progressive collapse occurs far more easily in regular bridges than in semiregular and irregular bridges due to the effects of the ground slope and different pier heights [9]. Lin proposed a digital twin-based collapse fragility assessment method for long-span cable-stayed bridges under the condition of strong earthquakes, and accordingly provided valuable information for the lifetime maintenance and management of this type of bridge in engineering practice [10]. Wang investigated the collapse process and failure mechanism of long-span cable-stayed bridges under strong seismic excitations, and the findings indicated that the piers and main pylons are critical components that contribute to the collapse of cable-stayed bridge structures [11]. Cao presented a computational forensic investigation of the collapse of the Skagit River Bridge, Mount Vernon, Washington, USA, and found that the bridge could not provide alternative load paths to transfer the dead and live loads after losing one of the upper chords [12].
Based on reliability and probability theory, reliability methods have been developed to assess the redundancy and robustness of bridges subjected to various loads while ensuring the reliability index. To determine the safety of bridge systems, a system reliability framework was constructed to assess the redundancy and robustness of multi-girder bridges under vehicle loads and some abnormal loads, and it was found that the system safety depends on the number of girders, the girder spacing, and the presence of diaphragms [2]. The indexes of redundancy and robustness have also been expanded to many infrastructure networks to assess system safety, and have revealed that the target index can provide a good balance between safety and cost in infrastructure networks [13,14]. It should be noted that the consequences of bridge collapses can take several forms in the range of structural damage and human injuries to functional downtime and environmental impacts, resulting in huge economic losses and social disasters [15]. The multi-dimensional and variable aspects of the “cost of failure” have been discussed, and various types of consequences arising from structural failure have been examined [16]. Based on a statistical analysis of past metallic bridge failures, it has been demonstrated that the decreasing trend of collapses can be attributed to limited knowledge, while there is an increasing trend in failures resulting from accidents and natural hazards [17]. Moreover, a categorization procedure via which consequences arising from potential bridge failures can be estimated has been developed.
Many significant methodologies have been developed for the assessment of structural robustness, and promising results have been obtained; however, more research must be conducted to propose more methodologies applicable to long-span bridges, such as arch bridges and cable-stayed bridges. In this study, an approach adopting the radar chart is proposed to assess the robustness of the cable force of a double-pylon cable-stayed bridge with a steel truss girder. Via this approach, plans are developed to optimize the robustness of this bridge, and reflect the response of loads to transfer along alternative paths.
2. Description of the cable-stayed bridge
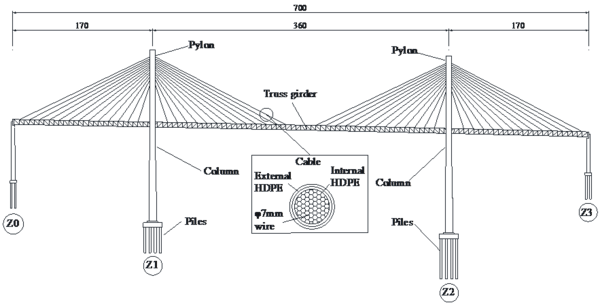
The cable-stayed bridge considered in this study had three spans with a total length of 700 m, including two 170-m side spans and a 360-m main span, as shown in Figure 1. The beam was comprised of two truss girders with a height of 6 m and a spacing of 26 m. Moreover, the steel truss had chords with box sections, and vertical and diagonal bars with H-shaped sections. One hundred and four cables composed of steel wires were anchored in the joints to connect the truss girder and the pylons. The material properties of this cable-stayed bridge are reported in Table 1.
|
| Figure 1. The double-pylon cable-stayed bridge with a steel truss girder (unit: m) |
| Member | Material | Specific gravity (kN/m3) | Elastic modulus (MPa) | Sectional area (m2) |
|---|---|---|---|---|
| Pylon | Concrete ( MPa) | 25 | ||
| Deck | Concrete ( MPa) | |||
| Truss girder | Steel ( MPa) | |||
| Horizontal and lateral bars | Steel ( MPa) | |||
| Cables (per) | 7-mm wire ( MPa) |
3. Numerical model
Robustness is the ability of a structure to resist progressive or disproportionate collapse, depending on the alternative load paths in the structure. For cable-stayed bridges with a steel truss girder under vehicle load, robustness is assessed using some deterministic indexes in consideration of the performance of the bridge.
3.1 Analysis details
Composed of a steel truss girder and cables, a cable-stayed bridge will collapse entirely when the girder fails, indicating that there are insufficient alternative load paths along which the absorbed load can transfer. In contrast, the rupture of an individual cable will not lead to the collapse of a cable-stayed bridge, meaning that the adjacent cables, as alternative load paths, bear the absorbed load from the failing cable, as illustrated in Figure 2.

|
| Figure 2. Failures in individual members of a cable-stayed bridge |
Five deterministic indexes associated with the stress and deformation of the structural members have been proposed to assess the robustness of double-pylon cable-stayed bridges with a steel truss girder. These deterministic indexes include (1) the truss tension/compression stress redundancy factor (), (2) the cable stress redundancy factor (), (3) the pylon compression stress redundancy factor (), (4) the displacement redundancy factor (), and (5) the robustness factor (), as respectively given by Eqs. (1)-(5). As the target index, the robustness factor is calculated based on the radar chart associated with these five indexes
|
(1) |
where and are respectively the maximum principal tension and compression stresses of the elements, regarding steel truss girder of the bridge under gravity, and and are respectively the limit stresses of the steel truss girder. The values of and are in the range of 0 to 1; otherwise, the bridge would be damaged due to the stress being larger than the limit value
|
(2) |
where is the maximum tension stress in the elements of the cables caused by gravity, and is the yield stress of the cable. The value of is in the range of 0 to 1; otherwise, the bridge would be damaged due to the stress being larger than the yield stress
|
(3) |
where is the maximum principal stress in the elements regarding the pylons of the bridge under gravity, and is the limit stress of concrete. The value of is in the range of 0 to 1; otherwise, the bridge would be damaged due to the stress being larger than the yield stress
|
(4) |
where is the maximum vertical displacement in the elements regarding the truss girder of the bridge under gravity, and is 1% of the main span. The value of is in the range of 0 to 1; otherwise, the bridge would be unable to serve its function due to the displacement being larger than the limit value.
To obtain the structural robustness index, a radar chart is introduced, and the five indexes are considered as the axes in the chart
|
(5) |
where is the area of the radar chart, is the perimeter of the radar chart, and is the area of the region surrounded by the outside line. The radar chart, the axes of which are the five indexes, is used to assess the redundancy of individual members and the robustness of the entire bridge in the scenario of member loss.
3.2 Numerical discretization
A 3D finite element model was constructed in ANSYS software to study the structural collapse behavior of the cable-stayed bridge.
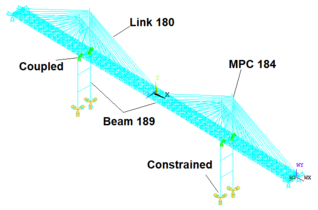
For structural analysis, the pylons and truss girder were discretized using BEAM189 elements, the cables were modeled with LINK180 elements, and MPC184 rigid link/beam elements were used to connect the cables and pylons. BEAM189 is defined by three nodes with six degrees of freedom at each node, i.e., three translations in the nodal -, -, and -directions, and three rotations about the -, -, and axes. This element is based on Timoshenko beam theory, which includes the shear-deformation effects; thus, it is suitable for the analysis of 3D slender to moderately stubby/thick beam structures. LINK180 is defined by two nodes with three degrees of freedom per node, i.e., translations in the nodal -, -, and -directions. This element has no bending or rotation, which makes it is well-suited for application to the modeling of 3D sagging cables, links, and springs. Finally, the MPC184 rigid link/beam is defined by two nodes with six degrees of freedom at each node, i.e., three translations in the nodal -, -, and -directions, and three rotations about the -, -, and -axes.
This element models a rigid constraint or a rigid component, and material stiffness properties are not required; thus, it can be used to simulate a rigid constraint between two deformable bodies, or as a rigid component used to transmit forces and moments. To simplify the supports on the pylons, the nodes in the tie-beam of the pylons and the close nodes of the truss girder were translationally coupled in the nodal - and -directions. The ends of the pylons were constrained in all degrees of freedom, i.e., three translations in the nodal -, -, and -directions, and three rotations about the -, -, and -axes. The supports at the ends of the truss girder were simulated by constraining some degrees of freedom, i.e., translations in the nodal - and -directions with an allowance of mm.
To account for the common action of the cable-stayed bridge, node-to-node interaction modeling was utilized to discretize the structural model. The same nodes were shared between the beam elements of the truss girder and the link elements of the cables, between the link elements of the cables and the rigid link/beam elements of the rigid connections, and between the beam elements of the pylons and the rigid link/beam elements of the rigid connections. The 3D structural model and the meshing and support applied for structural analysis are shown in Figure 3.
|
| Figure 3. The finite element model of the cable-stayed bridge |
The material inelastic properties were adopted in the finite element model for the analysis of the structural collapse behavior of the bridge under extremely heavy vehicle loads. The ideal elastic-plastic material property was used in the cables and truss girder, and the exact corresponding yield strengths were respectively 1670 and 370 MPa, as shown in Table 2. Moreover, the instability, a critical potential factor that could lead to the collapse of the entire bridge, of the chords and bars in the steel truss girder subjected to considerable compression was also considered in the analysis. And the failed members, regarding chords and cables, are numerically killed to simulate the damaged bridge with initial failures in members.
| Load scenario | AP1 | AP2 | ||||
|---|---|---|---|---|---|---|
| A8-A9 | 65.1 | 63.8 | 63.2 | 62.4 | 1.9 | 1.4 |
| A29-A30 | 63.3 | 72.5 | 65.5 | 63.8 | -2.2 | 8.7 |
| A44-A45 | 65.3 | 63.8 | 63.4 | 62.3 | 1.9 | 1.5 |
| A59-A58´ | 65.3 | 65.1 | 63.4 | 62.4 | 1.9 | 2.7 |
4. Analysis of alternative load paths of the cable-stayed bridge
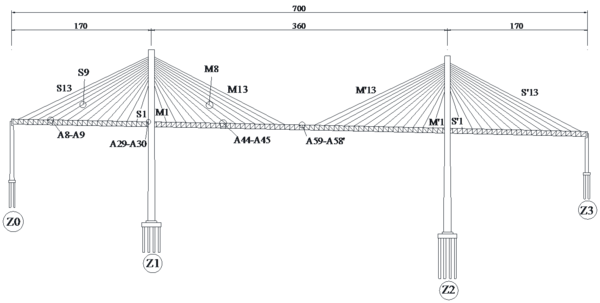
To improve structural safety, alternative load paths were adopted to decrease the force density, thereby increasing the resistance to progressive collapse. The chords A8-A9, A29-A30, A44-A45, and A59-A58’, and the cables S9, M8, and M13 were the critical members of the cable-stayed bridge, as shown in Figure 4; thus, alternative path plans are proposed for the loss of these individual members.
|
| Figure 4. Failed members (unit: m) |
4.1 Alternative load paths for the truss girder
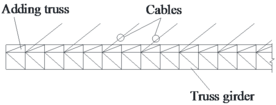
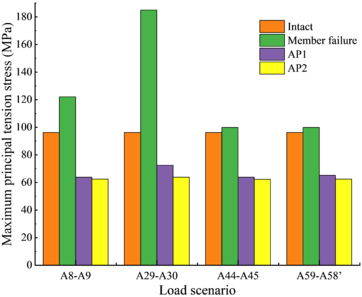
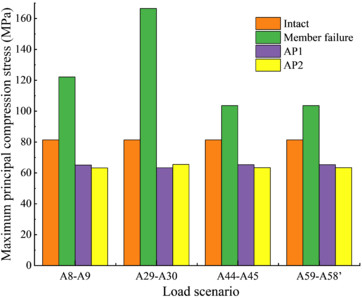
To add alternative load paths for the truss girder, the following two plans were developed: (1) Bars, which were the same as the origin decline bars, were used to connect the other two joints in the chords, shown in Figure 5(a). (2) New trusses were built on the truss girder, and the bars were the same as the members of the deck, as depicted in Figure 5(b). The two alternative load path plans changed the stress in the truss girder with the losses of chords A8-A9, A29-A30, A44-A45, and A59-A58’, as shown in Figure 6.

|
|
| (a) Alternative load path 1 | (b) Alternative load path 2 |
| Figure 5. Alternative load paths for the truss girder | |
|
|
| (a) Maximum principle tension stresses | (b) Maximum principle compression stresses |
| Figure 6. Maximum principle tension and compression stresses in truss girder | |
The maximum principle tension and compression stresses increase significantly in the truss girder, caused by failures in chords A8-A9, A29-A30, A44-A45 and A59-A58’. And the stresses grow more obviously in the scenarios of chords loss in side span, resulted by the no constrain in the longitude direction at the end of truss girder. Noticeably, the maximum principle tension and compression stresses increase sharply from 96.2 MPa and 81.4 MPa to 166.5 MPa and 185 MPa in the scenario of chord A29-A30 loss, as shown in Figure 6. In the other hand, by adding members for the truss girder, the two alternative load path plans offered more alternative load paths for the absorption of load from the failure of chords, thus decreasing the maximum principle tension and compression stresses significantly.
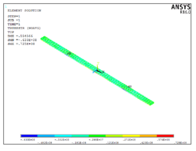
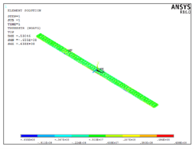
In the scenario of chord A29-A30 loss, the alternative load path 1 (AP1) was found to decrease the maximum compression and tension stresses to 63.3 and 72.5 MPa, respectively, while alternative load path 2 (AP2) decreased the two values to 65.5 and 63.8 MPa, respectively, as depicted in Figure 7.
|
|
| (a) Alternative load path 1 | (b) Alternative load path 2 |
| Figure 7. Stress in the truss with the loss of chords A29-A30 under the two alternative load path plans | |
For the degraded truss girder with two alternative path plans, most of the members were compressed; the maximum principle compression stress occurred in the bottom chord near the pylon, and the maximum principle tension stress occurred in the bottom chord in the middle span. Compared to AP1, AP2 was found to more effectively reduce the compression and tension stresses ( and ) in the truss members, with a decrease in compression stress of about 2 MPa and a decrease in tension stress in the range of 1.4 to 8.7 MPa. This indicates that AP2 provided more effective paths for load absorption, especially in the scenario of the loss of the chords near the pylon, as exhibited in Table 2.
4.2 Alternative load paths for cables
The failures in cables S9, M8, and M13 would cause the load to transfer to adjacent cables; thus, the following two alternative cable plans are proposed to offer more paths for the absorbed load. (1) Cables were added for S/M1, S/M4, S/M7, S/M10, and S/M13 to connect the joint in the truss girder and the same anchorage in the pylon. (2) Cables were added for S/M1, S/M4, S/M6, S/M8, and S/M10 to connect the joint in the truss girder and the same anchorage in the pylon, as depicted in Figure 8.

| |
| (a) Alternative cable plan 1 | |

| |
| (b) Alternative cable plan 2 | |
| Figure 8. Alternative load paths for the cables | |
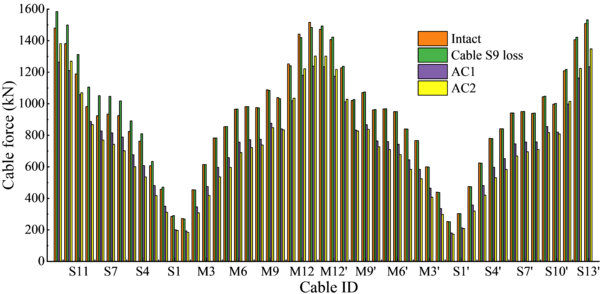
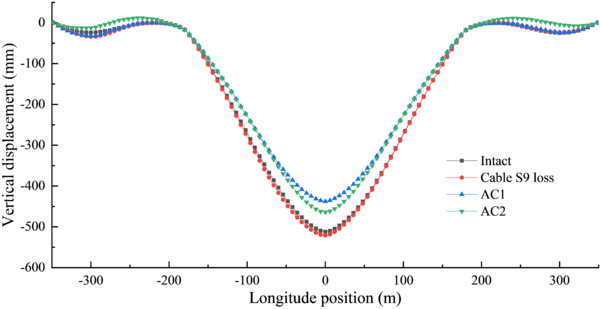
The cable forces increase significantly in side span, with the maximum value of 127.17 kN in cable S8, caused by the rapture in cable S9. By adding more cables to this cable-stayed bridge, the two plans offered more load paths for the transfer of absorbed load in the scenario of the failure of cable S9. Alternative cable plan 1 (AC1) reduced the maximum force in cable S1 by 30.9%, while alternative cable plan 2 (AC2) led to a 34.1% reduction in the maximum force in cable S3, as depicted in Figure 9(a). Similarly, the two plans reduced the maximum vertical displacement of the truss girder by 16.7% and 16.1%, respectively, as shown in Figure 9(b).
| |
| (a) Cable forces | |
| |
| (b) Vertical displacement of the truss girder | |
| Figure 9. Cable forces and vertical displacement of the truss girder in the scenario of the loss of cable S9 | |
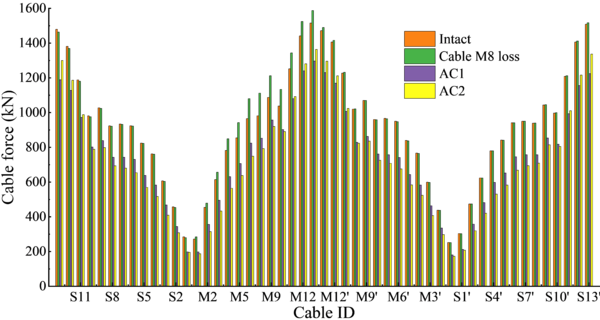
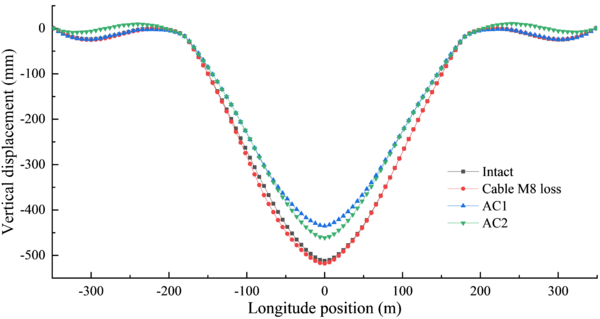
The cable forces increase significantly in the vicinity of cable M8 in main span, with the maximum value of 130.54 kN in cable M7, caused by the rapture in cables. By adding more cables to this cable-stayed bridge, the two plans offered more load paths for the transfer of absorbed load in the scenario of the failure of cable M8. AC1 reduced the maximum force in cable M1 by 30.4%, while AC2 led to 34.3% and 34.2% reduction in the maximum force in cable M1 and M2 respectively, as depicted in Figure 10(a). The two plans also reduced the maximum vertical displacement of the truss girder by 18.3% and 5.7%, respectively, indicating that AC1 more effectively decreased the vertical displacement of the truss girder in the scenario of the loss of cable M8, as shown in Figure 10(b).
| |
| (a) Cable forces | |
| |
| (b) Vertical displacement of the truss girder | |
| Figure 10. Cable forces and vertical displacement of the truss girder in the scenario of the loss of cable M8 | |
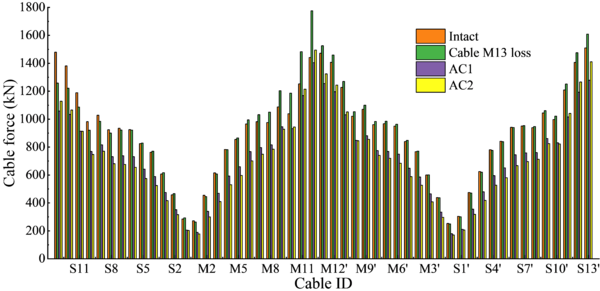
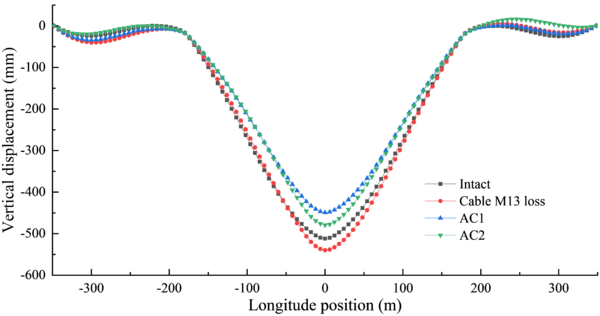
Similarly, the cable forces increase significantly in main span, with the maximum value of 334.2 kN in cable M12, caused by the rapture in cable M13. The two plans offered more load paths for the transfer of absorbed load in the scenario of the failure of cable M13. AC1 reduced the maximum force in cable S1 by 30.1%, while AC2 led to 32.6% reduction in the maximum force in cable M2 and M3, as depicted in Figure 11(a). The two plans also effectively reduced the maximum vertical displacement of the truss girder by 18.2% and 17.5%, respectively, as shown in Figure 11(b).
| |
| (a) Cable forces | |
| |
| (b) Vertical displacement of the truss girder | |
| Figure 11. Cable forces and vertical displacement of the truss girder in the scenario of the loss of cable M8 | |
Both alternative cable plans were found to reduce the cable forces, and the maximum reduction was in the cables near the pylons, namely cables S1, M1 and M2. The forces of these cables were effectively decreased in the range of 30.1% to 30.9% in AC1 and in the range of 32.6 to 34.3% in AC2, as exhibited in Table 3. Compared to AC2, most of the cable forces in AC1 were larger, with the exception of the forces in some long cables. Similarly, the two alternative cable plans effectively reduced the vertical displacement of the truss girder in the middle span in the range of 16.7% to 18.3% for AC1, and in the range of 5.7% to 17.5% for AC2. Compared to AC2, AC1 more effectively reduced the vertical displacement of the truss girder in the middle span, and the maximum reduction was 18.3% in the scenario of the loss of cable M8. However, the vertical displacement in the side span was also effectively reduced by AC2, with a maximum value of 23 mm.
| Load scenario | Cable forces | Vertical displacement in the middle span | ||
|---|---|---|---|---|
| AC1 | AC2 | AC1 | AC2 | |
| S9 | 30.9% (S1) | 34.1% (S3) | 16.7% | 16.1% |
| M8 | 30.4% (M1) | 34.3% (M1) | 18.3% | 5.7% |
| M13 | 30.1% (S1) | 32.6% (M2) | 18.2% | 17.5% |
5. Assessment of the robustness of the cable-stayed bridge
To assess the robustness of this cable-stayed bridge with the initiation of damage under the two alternative path plans, the values of , , , , , and were calculated by Eqs. (1)-(5). Then, the radar charts associated with these indexes were obtained to study the structural robustness of the cable-stayed bridge with a steel truss girder. By the comparison with intact bridge, it is investigated the negative and positive impacts of member failures and alternative load paths on structural robustness of the damaged bridges and the bridges with alternative load paths.
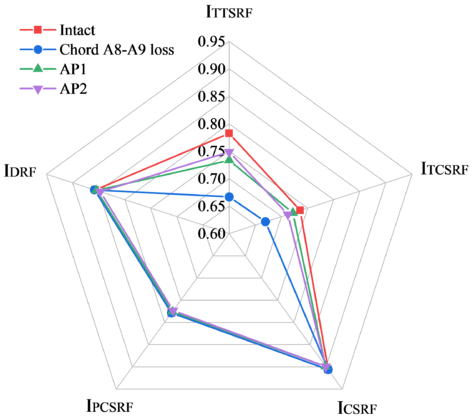
As illustrated in Figure 12, the failure in chords A8-A9 led to reductions in the values of and from 0.78 and 0.74 to both 0.67, thereby causing a decrease in the value of from 0.75 to 0.72. By providing more paths for the absorbed load from the loss of chords A8-A9, AP1 increased the values of and to 0.73 and 0.72, respectively, thereby increasing the value of to 0.75. Similarly, AP2 increased the values of and to 0.75 and 0.71, respectively, thereby increasing the value of to 0.74. In contrast, the failure of chords A8-A9 did not affect the other indexes, just as the two alternative load path plans do.
|
| Figure 12. Radar chart for the two alternative load path plans in the scenario of the loss of chords A8-A9 |
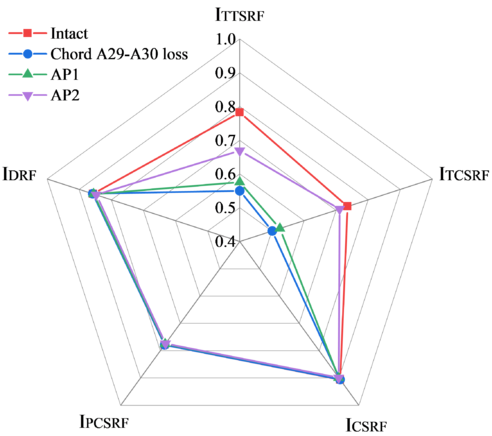
As illustrated in Figure 13, The failure of chords A29-A30 led to reductions in the values of and from 0.78 and 0.74 to 0.55 and 0.50, respectively, thereby causing a decrease in the value of from 0.75 to 0.66. By providing more paths for the absorbed load from the loss of chords A29-A30, AP1 increased the values of and to 0.58 and 0.53, respectively, thereby increasing the value of to 0.74. Similarly, AP2 increased the values of and to 0.67 and 0.71, respectively, thereby increasing the value of to 0.72. The failure of chords A29-A30 did not affect the other indexes, as the two alternative load path plans do.
|
| Figure 13. Radar chart for the two alternative load path plans in the scenario of the loss of chords A29-A30 |
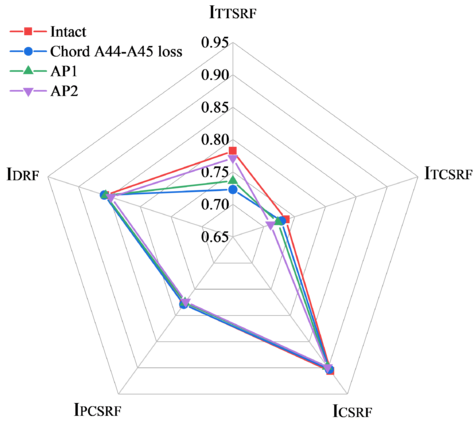
As illustrated in Figure 14, The failure of chords A44-A45 led to reductions in the values of and from 0.78 and 0.74 to 0.72 and 0.73, respectively, thereby causing a decrease in the value of from 0.75 to 0.74. By providing more paths for the absorbed load from the loss of chords A44-A45, AP1 increased the values of and to 0.74 and 0.72, respectively, while the value of remained 0.74. Similarly, AP2 increased the values of and to 0.77 and 0.71, respectively, while the value of was not obviously improved.
|
| Figure 14. Radar chart for the two alternative load path plans in the scenario of the loss of chords A44-A45 |
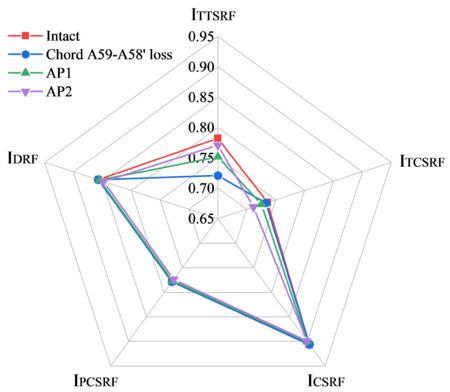
As illustrated in Figure 15, The failure of chords A59-A58’ led to reductions in the values of and from 0.78 and 0.74 to 0.72 and 0.73, respectively, thereby causing a decrease in the value of from 0.75 to 0.74. By providing more paths for the absorbed load from the loss of chords A59-A58’, AP1 increased the values of and to 0.75 and 0.73, respectively, and the value of remained 0.74. Similarly, AP2 increased the values of and to 0.77 and 0.71, respectively, which did not obviously improve the value of .
|
| Figure 15. Radar chart for the two alternative load path plans in the scenario of the loss of chords A59-A58’ |
In comparison with the other load scenarios, the loss of chords A29-A30 sharply reduced the value of from 0.74 to 0.50, leading to the reduction of the value of from 0.75 to 0.66. Similarly, the loss of chords A8-A9 reduced the value of from 0.78 to 0.67, thereby causing a reduction in the value of from 0.75 to 0.72. In contrast, AP2 increased the value of to 0.71 in the scenario of the loss of chords A29-A30, and effectively increased the value of to 0.72. AP2 also increased the value of to 0.75 in the scenario of the loss of chords A8-A9, leading to the obvious increase of the value of to 0.74. Thus, the alternative load path plans enhanced the structural robustness of the truss girder and the cable-stayed bridge. However, both plans had only a slight effect on the other indexes, namely , , and . The values of these indexes and the radar charts are reported in Table 4.
| Load scenario | Index | Intact | Damaged | AP1 | AP2 |
|---|---|---|---|---|---|
| A8-A9 | 0.78 | 0.67 | 0.73 | 0.75 | |
| 0.74 | 0.67 | 0.72 | 0.71 | ||
| 0.91 | 0.91 | 0.9 | 0.9 | ||
| 0.78 | 0.78 | 0.78 | 0.77 | ||
| 0.86 | 0.86 | 0.85 | 0.85 | ||
| 0.75 | 0.72 | 0.74 | 0.74 | ||
| A29-A30 | 0.78 | 0.55 | 0.58 | 0.67 | |
| 0.74 | 0.5 | 0.53 | 0.71 | ||
| 0.91 | 0.91 | 0.9 | 0.9 | ||
| 0.78 | 0.78 | 0.78 | 0.77 | ||
| 0.86 | 0.86 | 0.86 | 0.85 | ||
| 0.75 | 0.66 | 0.74 | 0.72 | ||
| A44-A45 | 0.78 | 0.72 | 0.74 | 0.77 | |
| 0.74 | 0.73 | 0.72 | 0.71 | ||
| 0.91 | 0.9 | 0.9 | 0.9 | ||
| 0.78 | 0.78 | 0.78 | 0.77 | ||
| 0.86 | 0.86 | 0.86 | 0.85 | ||
| 0.75 | 0.74 | 0.74 | 0.74 | ||
| A59-A58’ | 0.78 | 0.72 | 0.75 | 0.77 | |
| 0.74 | 0.73 | 0.73 | 0.71 | ||
| 0.91 | 0.91 | 0.9 | 0.9 | ||
| 0.78 | 0.78 | 0.78 | 0.77 | ||
| 0.86 | 0.86 | 0.85 | 0.85 | ||
| 0.75 | 0.74 | 0.74 | 0.74 |
Compared with chord losses, due to the surplus alternative load paths in adjacent cables, cable losses only affect the values of , , and . In addition, other indexes, including , , and , are not changed by the failures of cables, whereas the two alternative cable plans increased the values of these indexes to be larger than those of an intact bridge.
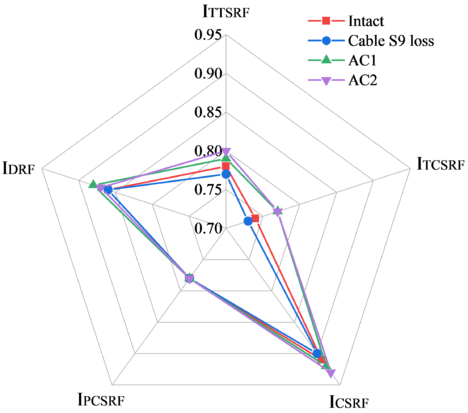
By decreasing the longitudinal force in the truss girder, the loss of cable S9 decreased the values of and from 0.78 and 0.74 to 0.77 and 0.73, respectively, and the value of was slightly reduced from 0.91 to 0.90, as illustrated in Figure 16. Regarding the truss girder and cables, AC1 increased the values of the three indexes to 0.79, 0.77, and 0.92, respectively, which were all larger than the corresponding values of the intact bridge. Similarly, AC2 increased the three values of the three indexes to 0.80, 0.77, and 0.93, respectively, which were all larger than the corresponding values of the intact bridge. Consequently, the two plans effectively increased the value of from 0.75 to 0.77, which was also larger than the corresponding value of the intact bridge.
|
| Figure 16. Radar chart for the two alternative cable plans in the scenario of the loss of cable S9 |
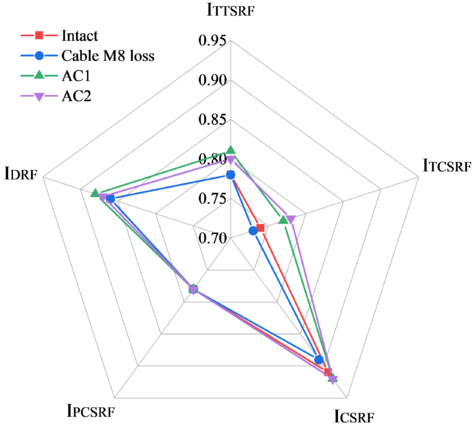
Similarly, the loss of cable M8 decreased the value of from 0.74 to 0.73, and the value of decreased from 0.91 to 0.89, as illustrated in Figure 17. Regarding the truss girder and cables, AC1 increased the values of the three indexes to 0.81, 0.77, and 0.92, respectively, which were all larger than the corresponding values of the intact bridge. Moreover, AC3 increased the values of the three indexes to 0.80, 0.78, and 0.92, respectively, which were all larger than the corresponding values of the intact bridge.
|
| Figure 17. Radar chart for the two alternative cable plans in the scenario of the loss of cable M8 |
By decreasing the longitudinal force in the truss girder, the loss of the long cable M13 decreased the values of , , and from 0.78, 0.74, and 0.91 to 0.75, 0.73, and 0.90, respectively, and the value of was decreased from 0.75 to 0.74, as illustrated in Figure 18. Regarding the truss girder and cables, AC1 increased the values of the three indexes to 0.78, 0.76, and 0.92, respectively, two of which were larger than the corresponding values of the intact bridge. Similarly, AC2 increased the values of the three indexes to 0.74, 0.77, and 0.92, respectively, two of which were larger than the corresponding values of the intact bridge. The values of these indexes and the radar charts regarding the cable loss scenarios are reported in Table 5.
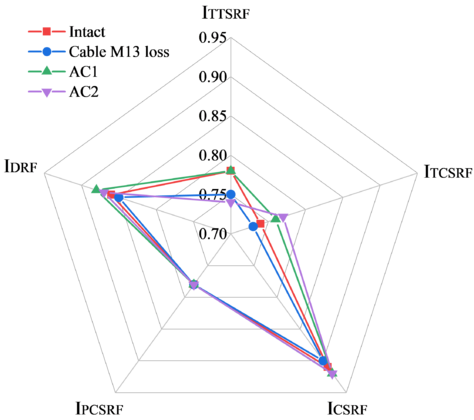
|
| Figure 18. Radar chart for the two alternative cable plans in the scenario of the loss of cable M13 |
| Load scenario | Index | Intact | Damaged | AC1 | Ac2 |
|---|---|---|---|---|---|
| S9 | 0.78 | 0.77 | 0.79 | 0.8 | |
| 0.74 | 0.73 | 0.77 | 0.77 | ||
| 0.91 | 0.9 | 0.92 | 0.93 | ||
| 0.78 | 0.78 | 0.78 | 0.78 | ||
| 0.86 | 0.86 | 0.88 | 0.87 | ||
| 0.75 | 0.75 | 0.77 | 0.77 | ||
| M8 | 0.78 | 0.78 | 0.81 | 0.8 | |
| 0.74 | 0.73 | 0.77 | 0.78 | ||
| 0.91 | 0.89 | 0.92 | 0.92 | ||
| 0.78 | 0.78 | 0.78 | 0.78 | ||
| 0.86 | 0.86 | 0.88 | 0.87 | ||
| 0.75 | 0.75 | 0.77 | 0.77 | ||
| M13 | 0.78 | 0.75 | 0.78 | 0.74 | |
| 0.74 | 0.73 | 0.76 | 0.77 | ||
| 0.91 | 0.9 | 0.92 | 0.92 | ||
| 0.78 | 0.78 | 0.78 | 0.78 | ||
| 0.86 | 0.85 | 0.88 | 0.87 | ||
| 0.75 | 0.74 | 0.76 | 0.75 |
Similarly, the loss of cable M13 reduced the values of and from 0.78 and 0.91 to 0.75 and 0.89, respectively, and the value of was decreased from 0.75 to 0.74. In contrast, the two types of alternative cable plans improved the value of from 0.73 to 0.76 and 0.77, respectively, and increased the value of from 0.9 to 0.92, thereby respectively increasing the value of from 0.74 to 0.76 and 0.75. However, the loss of cable M13 had only slight effects on the values of and .
The losses of chords and cables reduced the values of some of the indexes of the streel truss girder, which decreased the structural robustness. The failures in the chords effectively reduced the values of and , and did not effectively change the values of , , and . By adding more paths for the transfer of absorbed loads in the truss girder, the two alternative path plans were found to effectively improve the values of and , thereby increasing the structural robustness of the entire cable-stayed bridge. Similarly, the losses of cables reduced the values of , , and , and did not effectively change the values of and . However, the alternative cable plans improved the values of , , , and due to the addition of many alternative paths for the absorbed load in the damaged cable-stayed bridge.
6. Conclusions
This research launched an investigation of the mechanical performance and robustness of a cable-stayed bridge with a steel truss girder. Some plans regarding alternative paths and cables were designed to offer more paths for the transfer of absorbed load in the damaged bridge. Consequently, radar charts associated with five indexes were proposed to assess the structural robustness of the cable-stayed bridge:
- For the cable-stayed bridge with the failure of individual members in the steel truss girder, the loss of chords A29-A30 was found to be the most critical scenario for the damaged bridge under gravity. In this scenario, the largest compression stress of 65.5 MPa in the truss girder was generated in the lower chords near the pylons, while the largest tension stress of 72.5 MPa was generated in the lower chords in the middle of the main span. By adding more load transfer paths, two alternative path plans (AP1 and AP2) were used to disperse the stress in the members in the truss girder, and the maximum reduction of AP2 (8.7 MPa) was larger than that of AP1.
- Alternative cable plans AC1 and AC2 were designed to effectively decrease the cable forces, and the maximum reductions were respectively 30.1% and 34.3%. The forces in the long cables in AC2 were larger than those in AC1 with a maximum value of 9.4%. Similarly, with a maximum reduction of 28.2% in the main span, both plans were found to decrease the vertical displacement of the truss girder under gravity, and the reduction of AC1 was slightly larger than that of AC2.
- For the truss without sufficient load transfer paths, the loss of chords was found to decrease the values of and ; in the scenario of the loss of chords A29-A30, these values were sharply decreased from 0.78 and 0.74 to 0.55 and 0.50, respectively. Consequently, the value of decreased from 0.75 to 0.66. By adding more transfer paths for absorbed loads, the two alternative load path plans increased the values of and of the truss girder to 0.67 and 0.71, respectively, leading to the increase in the value of to 0.74.
- Due to the existing load paths of cables, the cable loss scenarios were found to reduce the values of and , but not as effectively as the chord loss scenarios. In the scenario of the loss of cable M13, the values of and decreased from 0.78 and 0.74 to 0.75 and 0.73, respectively, and the value of decreased from 0.91 to 0.9. The two alternative cable plans increased the value of to 0.76 and 0.77, respectively, and the value of was increased to 0.92; these values were larger than the corresponding values of the intact cable-stayed bridge.
Acknowledgments
The authors wish to acknowledge the support of the support of the Shaanxi Communication Science and Technology Project no. 20-45K and the Natural and Science Foundation of Shaanxi no. 2021JQ-266 and 2022JQ-415.
References
[1] Xu F.Y., Zhang M.J., Wang L., Zhang J.R. Recent highway bridge collapses in China: Review and discussion. Journal of Performance of Constructed Facilities, 30(5):04016030, 2016.
[2] Ghosn M., Moses F. Redundancy in highway bridge superstructures. Transportation Research Board, Report 406, 1998.
[3] Scheller J., Starossek U. A new energy-efficient device for active control of bridge vibrations. International Association for Bridge and Structural Engineering, 17(12):310-311, 2008.
[4] Yan D., Chang C.C. Vulnerability assessment of single-pylon cable-stayed bridges using plastic limit analysis. Engineering Structures, 32(8):2049-2056, 2010.
[5] Jiang L., Ye J., Zheng H. Collapse mechanism analysis of the FIU pedestrian bridge based on the improved structural vulnerability theory (ISVT). Engineering Failure Analysis, 104:1064-1075, 2019.
[6] Sun J., Zhang J., Huang W., et al. Investigation and finite element simulation analysis on collapse accident of Heyuan Dongjiang Bridge. Engineering Failure Analysis, 115:104655, 2020.
[7] Li Y., Zong Z., Yang B., et al. Research on longitudinal collapse mode and control of the continuous bridge under strong seismic excitations. Applied Sciences, 10(17):6049, 2020.
[8] Khoei A.S., Akbari R., Maalek S., et al. Assessment of design and retrofitting solutions on the progressive collapse of Hongqi Bridge. Shock and Vibration, 2020:1-13, 2020.
[9] Seyedkhoei A., Akbari R., Maalek S. Earthquake-induced domino-type progressive collapse in regular, semiregular, and irregular bridges. Shock and Vibration, 2019(PT.2):1-18, 2019.
[10] Lin K., Xu Y.L., Lu X., et al. Digital twin-based collapse fragility assessment of a long-span cable-stayed bridge under strong earthquakes. Automation in Construction, 103547(2):103547, 2021.
[11] Wang X., Zhu B., Cui S. Research on collapse process of cable-stayed bridges under strong seismic excitations. Shock and Vibration, 2017(PT.4):1-18, 2017.
[12] Cao R., Agrawal A.K., El-Tawil S., et al. Overheight impact on bridges: A computational case study of the Skagit River bridge collapse. Engineering Structures, 237(3):112215, 2021.
[13] Ghosn M., Frangopol D.M., McAllister T.P. et al. Reliability-based performance indicators for structural members. Journal of Structural Engineering, 142(9):F4016002, 2016.
[14] Ghosn M., Dueñas-Osorio L., Frangopol D.M. et al. Performance indicators for structural systems and infrastructure networks. Journal of Structural Engineering, 142(9):F4016003, 2016.
[15] Imam B.M., Chryssanthopoulos M.K. Causes and consequences of metallic bridge failures. Structural Engineering International, 22(1):93-98, 2012.
[16] Zhu B., Frangopol D.M. Risk-based approach for optimum maintenance of bridges under traffic and earthquake loads. Journal of Structural Engineering, 139(3):422-434, 2012.
[17] Chen C.C., Wu W.H., Liu C.Y., Lai G. Diagnosis of instant and long-term damages in cable-stayed bridges based on the variation of cable forces. Structure and Infrastructure Engineering, 14(5):565-579, 2018.Document information
Published on 16/03/22
Accepted on 05/03/22
Submitted on 16/10/21
Volume 38, Issue 1, 2022
DOI: 10.23967/j.rimni.2022.03.009
Licence: CC BY-NC-SA license
Share this document
Keywords
claim authorship
Are you one of the authors of this document?