Abstract: The aim of this study is to explore a method that combines Digital Twins (DTs) with Convolutional Neural Network (CNN) algorithms to analyze the attractiveness of historical and cultural exhibits in museums and humanistic care, in order to achieve intelligent and digital development of exhibitions under museum humanistic care. The concept of "Health Museum and Health Management" has received initial attention and rapid response from the nursing community in Europe and America. Its essence emphasizes the intervention of museum intelligence in medical and health care and the role of improving the medical and health system, creating the medical service function of museums. Firstly, using DTs technology to digitally model the historical and cultural exhibits of the museum, achieving the display and interaction of virtual exhibits. Then, the Mini_Xception network was proposed to improve the CNN algorithm and combined with the ResNet algorithm to construct a facial emotion recognition model. Finally, using this model, the attractiveness of museum historical and cultural DTs exhibits was accurately predicted by recognizing people's facial expressions. The comparative experimental results show that this recognition method can greatly improve recognition accuracy and scalability. Compared with traditional recognition methods, the recognition accuracy can be improved by 5.53%, and 2.71s can reduce the data transmission delay of the model. The scalability of enhanced recognition types can also meet real-time interaction requirements in a shorter amount of time. This study has important reference value for the digital and intelligent development of museums combined with nursing exhibitions.
Keywords: Digital Twins; Neural Network; Museum; Nursing Exhibits; Mini_Xception Network
1. Introduction
There is current research on creating ‘nostalgic environments’ of exhibits for audiences in museums and institutional care settings to support visitors' memory and recognition. This research identifies care as a ‘curatorial’ practice: museums act as ‘curators’, re-establishing and reorganising the ‘meaning’ of the visit by retaining the audience's personal biographies and sense of social belonging. ‘. As curatorial care in nursing homes preserves not only individual but also collective memories of what it takes to be human and to belong to a society, these institutions should be considered important places in society in relation to the production of meaning, value and cultural heritage. Recently, Augmented Reality (AR) has been used in many museum exhibitions to display virtual objects in videos captured from the real world.
The integration of museum intelligence and care is a relatively new direction, and museums can be uniquely effective, particularly in the areas of cultural sensitivity, mental health and emotional healing. Digital twins (DTs) can map entities or systems from the real world to the digital world and perform modeling, simulation, and analysis [1]. Applying this technology in cultural exhibit attraction assessment can help evaluators understand the characteristics, strengths, and weaknesses of cultural exhibits more intuitively.
In order to give full play to the educational function of museums and better adapt to the rapid development of the industry, relevant policy documents need to be effectively implemented. Development, construction, and resource advantages are transformed into market advantages, enriching spiritual connotations, avoiding single-product content, and overcoming the problem of insufficient creativity. The presentation of core culture and the development of cultural products must pay attention to product development and guide cultural opening through cultural creation [2, 3]. This study analyses the current situation of product development in museums and analyses the existing production system and consumer demand. The results of the study can not only guide the intelligent practice of museums and promote design upgrading, but also enrich the theoretical system of design evaluation for nursing exhibits and overcome the randomness of subjective experience evaluation, so as to nourish the practice and promote the development of intelligent museums combined with medical and nursing exhibits.
The purpose of this study was to investigate the appeal of historical and cultural displays to patient audiences with a humanistic orientation. The approach involves several key steps. Firstly, DTs are employed to digitally model historical and cultural museum exhibits, enabling virtual presentation and interaction. Subsequently, enhancements are made to the Convolutional Neural Network (CNN) algorithm, and a visitor facial emotion recognition model is developed by combining Mini_Xception with ResNet. Lastly, a cultural exhibit attractiveness assessment model is established using facial emotion recognition. The innovation of this research lies in the application of DTs technology for the digital modeling ofhistorical and cultural museum exhibits, enabling virtual display and interaction. This represents a significant stride in digital and intelligent advancement. In addition, this study introduces the Mini-_Xception network to refine the CNN algorithm and merges it with the ResNet algorithm to construct a facial emotion recognition model for spectators (care patients), thus improving the prediction accuracy of spectator attraction to exhibits. The overall organisation of this study is described as described below. Section I outlines the historical background of the museum under humanistic care and the intelligent functions of this museum. Section II arranges the database according to the characteristics of the museum's cultural exhibits by referring to the relevant literature on CNN algorithms. Section 3 combines CNN and facial emotion recognition strategies to build an evaluation model for the attractiveness of cultural exhibits. Section 4 presents the results of the experimental data obtained through data transfer and experiments. Section 5 concludes the experiment by analysing and organising the experimental data. This study has practical value in improving the attractiveness of historical and cultural exhibits within museums and humanities care.
2. Related work
In the context of relevant CNN research, Sakai et al. (2021) [4] employed graph CNN to anticipate the pharmacological behavior of chemical structures, utilizing the constructed model for virtual screening and the identification of a novel serotonin transporter inhibitor. The efficacy of this new compound is akin to that of in-vitro- marketed drugs and has demonstrated antidepressant effects in behavioral analyses. Rački et al. (2022) [5] utilized CNN to investigate surface defects in solid oral pharmaceutical dosage forms. The proposed structural framework is evaluated for performance, demonstrating cutting-edge capabilities. The model attains remarkable performance with just 3% of parameter computations, yielding an approximate eight fold enhancement in drug property identification efficiency. Yoon et al. (2022) [6] employed CNN and generative adversarial networks to synthesize and explore colonoscopy imagery through the development of a proficiently trained system using imbalanced polyp data. Generative adversarial networks were harnessed to synthesize high-resolution comprehensive endoscopic images. The findings reveal that the system augmented with synthetic image enhancement exhibits a 17.5% greater sensitivity in image recognition. Benradi et al. (2023) [7] introduced a hybrid approach for facial recognition, melding CNN with feature extraction techniques. Empirical outcomes validate the method's efficacy in facial recognition, significantly enhancing precision and recall. Ahmad et al.(2023) [8] proposed a methodology for recognizing human activities grounded in deep temporal learning. The amalgamation of CNN features with bidirectional gated recurrent units, along with the application offeatureselection strategies, enhances accuracy and recall rates. Experimental results underscore the method's substantial practicality and accuracy in human activity recognition.
Furthermore, certain scholars have conducted relevant studies into museum exhibit attributes. Ahmad et al. (2018) [9] investigated the requisites of museums as perceived by the public, deriving insights from museum scholars and experts to outline the trajectory for developing museum exhibitions in Malaysia aimed at facilitating public learning. The results highlight the unique role of museum exhibits in residents' lifelong learning journey. Ryabinin et al. (2021) [10] harnessed a scientific visualization system to explore cyber- physical museum displays rooted in a system-on-a-chip architecture with a customized user interface. This research introduced an intelligent scientific visualization module capable of interactive engagement with and display of museum exhibits. Shahrizoda (2022) [11] delved into architectural and artistic solutions for museum exhibitions, clarifying architectural matters based on existing scientific and historical documents, and assessing prevailing characteristics of architectural and artistic solutions aligned with museum objectives.
These pertinent studies offer valuable points of reference and thought-provoking insights for the current research. They exemplify the diverse applications of CNN across domains such as drug research, image synthesis and recognition, and facial identification. These investigations underscore CNN's robust modeling and predictive capabilities, indicating its potential significance within the realm of cultural exhibits. They present intriguing concepts for image synthesis and enhancement within the museum exhibit domain. Additionally, in the arena of museum product development, the exploration of the integration of deep learning with other technologies holds promise for elevating the precision and effectiveness of product design.
2.2 An overview of the attractiveness of museum historical and cultural exhibits for humanistic care
Developing cultural tolerance in patient audiences based on the appeal of museum historical and cultural exhibits has been shown to be effective. In one study, an art museum educator instructed learners to observe museum artworks using the Visual Thinking Strategies (VTS) method. Of 407 students, 211 responded to a post-session survey (52%). 80% of respondents agreed or strongly agreed that ‘observing the art of the event was an effective means of initiating discussion with the interprofessional team’. Qualitative analysis of learner gains identified themes of open-mindedness, listening to other views and perspectives, collaboration/teamwork, patient-centredness and bias awareness [12]. The review also showed that art visualisation training through a local art museum hosted by an arts and culture educator was better able to improve the teaching of: facilitated observation, diagnostic skills, empathy, team building, communication skills, resilience and cultural sensitivity for medical students [13]. The limitations of these studies are that they are single-institution reports, short-term, involve small numbers of students, and often lack control. An analysis of 31 schools in the medical humanities at US medical schools found that 52% of the institutions surveyed had centres/departments focused on the humanities [14]. 65% offered 10 or more medical humanities-assisted courses per year, but only 29% offered a full immersion experience in the medical humanities. The study also found that the number of students in the medical humanities was not sufficiently high to justify a full immersion experience. Thus museum-based training has proven to be effective in the training of medical students, yet the amount of research and implementation is still lacking and is still in the beginning stages of exploration.
The cultural communication and emotional healing functions of museums are highly effective in caregiving. A study of 20 patients with cognitive disabilities (PWCI) and caregivers participated in a focus group at the Andy Warhol Museum of Art in an art engagement programme that included guided tours and art projects [15]. Research has revealed that patient humour and laughter in museum interventions, (Further study may reveal roles of humor and laughter in adaptation to cognitive decline and holistic interventions for improved quality of life.) can improve patients' ability to adapt to cognitive decline and holistic interventions for improved quality of life. Another study examined the feasibility of art museum trips as an intervention for chronic pain patients [16]. The art museum offered 1-hour docent-led tours to 54 individuals with chronic pain. 57% of participants reported pain relief during the tour, with an average pain relief of 47%. Subjects reported less social disconnection and pain unpleasantness before and after the trip. Respondents spoke of the isolating effects of chronic pain and how negative experiences with the healthcare system often exacerbate this sense of isolation. Participants viewed the art museum trip as a positive and inclusive experience with potential lasting benefits. Art museum trips are feasible for people with chronic pain, and participants reported positive effects on perceived social disconnection and pain.
Research related to the attractiveness of historical and cultural exhibits in museums has shown different developments in many fields, but there are serious gaps in combining intelligent environments to mitigate the impact of nurse audiences. With the development of information technology, the development and improvement of CNN algorithms have enabled the practical implementation of facial expression recognition technology in real life.The utilisation of DTs has facilitated the digital modelling of cultural displays. By applying attractiveness analysis models and artificial intelligence algorithms centred on historical and cultural exhibits, the attractiveness of historical and cultural exhibits in museums targeting humanistic contexts has been analysed, and with this foundation more directions of exploration and research can be expanded. This endeavour aims to increase the attractiveness of cultural exhibits while expanding the museum's cross-disciplinary reach and visibility to other fields.
3. Model research on the attractiveness of historical and cultural exhibits in the National Museum based on CNN
3.1 Functional analysis of cultural products in the National Museum of China
Viewed from a cultural design standpoint, the National Museum of China encompasses a historical journey spanning 5,000 years of traditional Chinese culture. Consequently, cultural products should meticulously select representative elements from the wealth of cultural resources, aligning with their distinctive historical significance. Through these cultural products, one can propagate informational culture within the cultural heritage, uphold esteemed traditional practices, and fortify the educational role of cultural offerings [17-19]. Firstly, the design of museum exhibition booths can consider isolating certain popular exhibits to disperse visitor traffic effectively. Additionally, in booth design, efforts should be made to encourage visitor engagement in interactive activities, fostering experiences deeply rooted in cultural impact. Regularly rotating less popular exhibits can align with the concept of catering to visitors. Given the subjective and challenging nature of exhibit evaluation, different visitors have varying cultural content preferences, inevitably leading to differences. A broader audience can be attracted by contemplating and crafting cultural art works, cultural attributes, and innovative choices, thus cultivating a positive feedback loop. The cultural products and functional attributes of the museum are delineated in Figure 1. 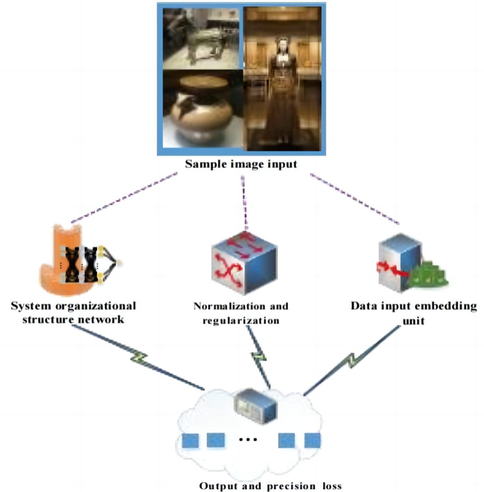
|
| Figure 1. Structure of the cultural product features of the National Museum |
3.2 Analysis of DTs applied to digital modeling of museum historical and cultural exhibits
DTs can provide more realistic simulations of exhibition venues and exhibits, enabling visitors to understand better the context and meaning of exhibits [20,21]. This research applies DTs to the digital modeling of museum historical and cultural exhibits, including key element entity modeling, DTs virtual modeling, and virtual-real mapping association modeling.
In solid modeling, the elements involved in the activities include exhibit characteristics, functions, performance, etc. Considering the above factors, this research uses a formal modeling language to model the key elements of the exhibit digitization process. The model definition is shown in Eq. (1):
|
|
(1) |
DTs volume modeling needs high modularity, good scalability, and dynamic adaptability, which can be completed in information space using the parametric modeling method. Virtual models of physical entities are established in Tecnomatrix, Demo3D, Visual Components, and other software [22,23]. In addition to describing the geometric information and topological relationship of the automated production line, the virtual model also contains the complete dynamic engineering information description of each physical object [24,25]. The multiple- dimensional attributes of the model are parametrically defined to realize the real-time mapping of the digital modeling process of exhibits. The specific definition of DTs volume modeling is shown in Eq. (2):
|
|
(2) |
Finally, the virtual-real mapping association is modeled. The virtual-real mapping relationship between the two is further established based on establishing the physical space entity model and the information space twin model . The formal modeling language is used to model its virtual-real mapping relationship. The model definition is shown in Eq. (3):
|
|
(3) |
3.3 Design and research of facial emotion recognition strategy based on CNN
Emotion refers to the subjective emotional experience and internal psychological state that humans have in response to external stimuli. It encompasses various complex experiences and reactions such as happiness, sadness, surprise, anger, fear, and more. Facial expressions are the outward manifestation of emotions, reflecting the emotional states of individuals through muscle movements and neural transmission. Facial expressions can be automatically recognized and classified using computer vision and image processing techniques, helping people gain a more accurate understanding of visitors' emotional states and responses in front of historical and cultural exhibits in museums. Facial recognition technology can identify facial expressions automatically by analyzing the changes and combinations of facial features, such as the eyes, mouth, eyebrows, and more. For example, when visitors appreciate an exhibit in a museum, they may display different emotions and attitudes, such as liking, disliking, or surprise. By utilizing facial recognition technology, people can monitor visitors'emotional changes and responses in real-time and connect this information with the knowledge and stories related to the displayed historical and cultural artifacts. This enhances visitors' experience and cultural awareness. In conclusion, facial expressions are the outward manifestation of emotions, and facial recognition technology can infer visitors'emotional states and responses by analyzing these expressions. By employing these technologies, people can better understand visitors' emotional experiences and responses in front of historical and cultural exhibits in museums, providing a more scientific and effective reference for exhibition planning and cultural heritage preservation in museums.
Since the input data source of tourist facial expressions is image sequence information collected by surveillance cameras, the model must maintain high recognition accuracy while maintaining high recognition speed [26]. The mini_xception model boasts a lightweight design, enabling it to maintain relatively high accuracy while reducing the network's parameter count and computational load. This lightweight structure makes the mini_xception network well-suited for integration into practical applications, particularly in resource- constrained scenarios [27,28]. Therefore, mini_xception is chosen as the basic network structure. Firstly, layers are added in batches after each convolution to speed up training and improve the model's generalization ability. A regularized dropout rate is used in the model to randomly eliminate some nodes in the network with a given probability. While the network structure is simplified, over-adjustment of the network is avoided. The classification ability of the network is improved. The principle is that in forwarding propagation, some neurons'activation values are randomly stopped in a certain proportion. Therefore, the model is less dependent on some local features. The actual visitors ofthe museum are different, and the lighting intensity of the booth is also different. The main pre-processing methods adopted include grayscale, normalization, and histogram processing. Based on CNN, the structural framework of the designed facial emotion recognition model is shown in Figure 2. 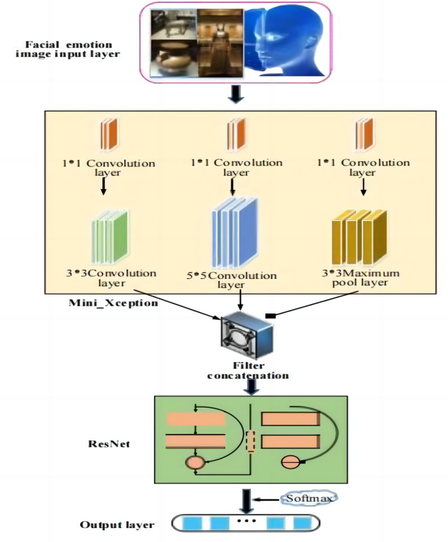
|
| Figure 2. Framework of facial emotion recognition model structure based on Mini_Xception and ResNet |
In this model, and represent one network layer's weight tensor and input tensor, respectively. Among them, represents the channel, represents the width and height, respectively. The network approximates through a binary tensor and a scaling factor , as shown in Eq. (4):
|
|
(4) |
In order to obtain the best approximation, it is assumed that vectors w and b represent weights and binarized weights, respectively, as shown in Eq. (5):
|
|
(5) |
|
|
(6) |
|
|
(7) |
|
|
(8) |
|
|
(9) |
|
|
(10) |
|
|
(11) |
|
|
(12) |
|
|
(13) |
|
|
(14) |
|
|
(15) |
|
|
(16) |
|
|
(17) |
The expression of the approximate point product between and is shown in Eq. (18):
|
|
(18) |
|
|
(19) |
In order to solve the optimization problem defined by Eq. (19) using swarm intelligence optimization algorithms, the steps are as follows:
Step 1: Randomly generate a set of particles, where each particle represents a possible solution in the solution space. Each particle has its own position and velocity, initialized with appropriate values.
Step 2: Calculate the fitness value of each particle based on the objective function defined in Eq. (19). The fitness value indicates the quality of the solution corresponding to the particle.
Step 3: For each particle, update its individual best position based on its current fitness value and historical best fitness value.
Step 4: Update the global best position of the swarm based on the fitness values of all particles. Record the optimal solution and its fitness value.
Step 5: Update the velocity and position of each particle based on its current velocity, individual best position, and global best position.
Step 6: Check if the termination condition is met, such as reaching the maximum number of iterations or the fitness value reaching a predetermined threshold. If the condition is met, proceed to step 8; otherwise, continue with steps 2 to 6.
Step 7: Repeat steps 3 to 6 until the termination condition is met.
Step 8: The optimal solution recorded during the iteration process is the optimization result of the problem.
3.4 Evaluation model of the attractiveness of cultural exhibits based on face recognition algorithm
The data recognized by the face recognition algorithm is mainly used to associate the subsequent facial expression information with character recognition. The residence time of each visitor in the current state can also be calculated through identity recognition information. Since the representation of features in consecutive images is difficult to change in the actual computational process, continuous recognition inevitably leads to many repeated expression results. The facial expression network information is extracted every 15 frames. Facial expression classification theory and created datasets are used as the basis. The client's facial expressions are divided into six categories. Simple results from facial expression recognition may not accurately reflect visitors' satisfaction with an exhibit. Therefore, information about the expressions of tourists is provided in the index. The attractiveness evaluation model of cultural exhibits is analyzed. The evaluation process of the attractiveness of cultural products is shown in Figure 3. 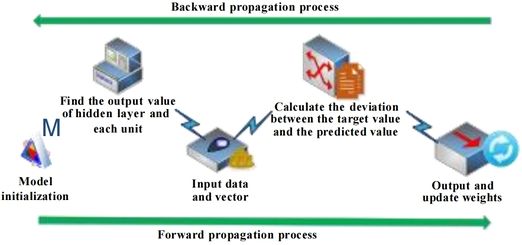
|
| Figure 3. Evaluation process of the attraction of museum historical and cultural products |
3.5 Data transmission and experimental research
The experiment is conducted in a museum located in City B. The duration of the experiment is one month. Firstly, a random sample of 500 visitors who visited the museum was selected as the subjects. Then, cameras are installed in various exhibition halls to collect facial expression data of the visitors using facial recognition technology in front of different exhibits. The data is acquired by installing cameras in the museum's ten booths. When the file is saved, the identification information ofthe exposure point in the filename is used to distinguish the video data of each exposure point. Ifthe traffic is high, it is limited to the amount of data to be considered, and 10 minutes of exposure input data plus traffic is selected for each program. The CNN algorithm detects faces in each frame of video data. Then, a 160*160-pixel face image is cut out, and the face edge is output at a specific position ofthe frame image. After the visitor obtains the collected face image, each point is input with an identification code. From the data in the MySQL database, quantitative scoring information, human identification information, residence time information, and exposure point information of the program representation labels are imported. Front- end code is used to connect to the back-end. Then, JavaScript is used to access the database data. Finally, an object library that displays attractiveness metrics is used to display the data.
In addition, in order to further analyze the attractiveness of the museum's historical and cultural exhibits, the proposed model algorithm is compared with the performance of Mini_Xception, ResNet, and Benradiet al. (2023). The recognition accuracy, scalability rate, data transmission delay of the system, and the recognition speed of tourists' emotions are analyzed using the human-computer interaction (HCI) system. Additionally, the higher the attraction ofthe exhibits, the longer the visitors stay in the exhibition area. The system analyzes the facial expression scores of tourists in front of different numbered exhibits and the visitor's stay time. It compares the attractiveness of different numbered exhibits according to the facial expression score and the visitor's stay time.
4. Results and discussion
4.1 Comparison of recognition accuracy and expansion rate of DTs system
In order to analyze the performance of each algorithm, different algorithms are used in the DTs system to analyze the accuracy of tourist emotion recognition and the system's scalability, as shown in Figure 4. 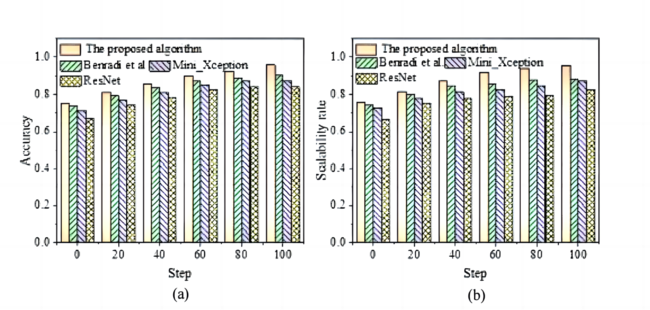
|
| Figure 4. Recognition accuracy and scalability curves of different algorithms in museum exhibit DTs system (a. recognition accuracy curve; b.scalability rate change curve) |
4.2 Comparison of results between data transmission delay and tourist emotion recognition speed
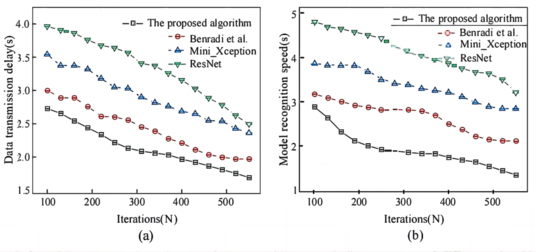
The system uses different algorithms to compare the data transmission delay time and the speed of tourist emotion recognition, as shown in Figure 5. Figure 5, in the system, as the number ofmodel iterations increases, the data transmission delay time of each model algorithm shows a downward trend. When the model iterates 100 times, the data transmission delay of the traditional algorithm ResNet is 3.96s. The data transmission delay of the improved CNN model is only 2.71s. After 550 model iterations, the data transmission delay of the traditional algorithm ResNet drops to 2.49s. The data transmission delay of the optimized CNN algorithm can be reduced to 1.67s. In addition, the emotion recognition speed of the traditional algorithm ResNet is 3.22s after 550 iterations, and the emotion recognition speed ofthe improved CNN algorithm is only 1.33s. The data analysis results show that the data transmission delay ofthe proposed model algorithm can be reduced to 2.71s. The algorithm is superior to the traditional algorithm regarding emotion recognition speed. In addition, the resource consumption of the four models is compared, as shown in Figure 6. 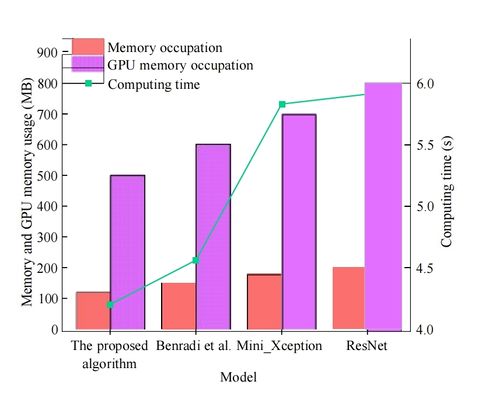
|
| Figure 6. Comparison of Computational Resource Consumption for Different Algorithms |
Furthermore, the research also compared the results of different algorithms in terms ofdata transmission latency and the speed ofvisitor emotion recognition. The findings revealed that with an increase in the number of model iterations, the data transmission latency for each algorithm exhibited a decreasing trend. For instance, after 100 rounds of model iteration, the data transmission latency for the conventional ResNet algorithm was 3.96 seconds, whereas the improved CNN model demonstrated a data transmission latency of only 2.71 seconds. Upon further augmentation to 550 rounds of model iteration, the data transmission latency of the conventional ResNet algorithm decreased to 2.49 seconds, while the optimized CNN algorithm achieved a reduced data transmission latency of 1.67 seconds. Similarly, the emotion recognition speed of the conventional ResNet algorithm was 3.22 seconds after 550 iterations, whereas the improved CNN algorithm exhibited a recognition speed ofmerely 1.33 seconds. Based on the results of data analysis, the proposed model algorithm is capable ofreducing data transmission latency to 2.71 seconds and outperforms the traditional algorithm in terms of emotion recognition speed.
4.3 Analysis of facial expression scores and visitor stay time results for exhibits with different numbers
The facial expression scores of tourists in front of different numbered exhibits and the data on tourists' staying time in the exhibition area are analyzed, as shown in Figure 7. 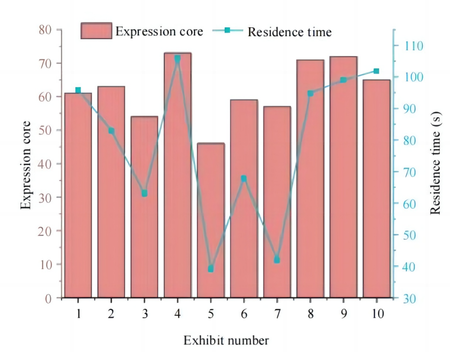
|
| Figure 7. Average score of facial expressions of museum visitors to different exhibits and the average stay time change |
Within this experiment, emotional reactions are the feelings experienced by visitors while observing the exhibits. These emotional reactions may encompass excitement, pleasure, curiosity, and surprise. Such emotional responses could directly impact visitors' preferences for the exhibits. For instance, if a visitor experiences strong excitement and pleasure when observing a particular exhibit, they are likely to favor it. Facial expressions serve as physiological manifestations of emotional experiences conveyed through facial muscle movements like smiling or frowning. Different facial expressions could be associated with distinct emotions and moods, which, in turn, may affect visitors'preferences for the exhibits. For instance, a visitor displaying a noticeable smile while observing an exhibit may indicate their pleasure and satisfaction with it. Positive emotional experiences associated with an exhibit may lead to a higher degree of liking. Comparing visitors'facial expressions in front of different exhibits can help determine which exhibits align better with their interests and preferences. Moreover, visitors might exhibit positive facial expressions such as smiling or widening eyes when they come across exhibits they like. These positive expressions could signify their interest or satisfaction with the exhibit, prompting them to spend more time better appreciating it. Conversely, negative facial expressions like furrowing brows or frowns might indicate dissatisfaction, disinterest, or confusion, leading to reduced interest and shorter stays. Therefore, the experiment compares visitors' average facial expression scores and their average duration ofstay. The result shows a significance level (P) of 0.0138, which is less than the conventional threshold of 0.05, indicating a statistically significant positive correlation between visitors' facial expressions and their duration of stay. In this experiment, the research explored the correlation between facial expression scores and dwell time among visitors by recognizing and analyzing visitors' facial expressions. Facial expression scores were evaluated based on facial muscle movements to assess visitors' emotional experiences, while dwell time referred to the time visitors spent viewing exhibits. The research results demonstrated a statistically significant positive correlation between facial expression scores and dwell time. This implies that when visitors have higher facial expression scores, they tend to spend a longer time in front of exhibits. A higher facial expression score might indicate a positive emotional experience, such as excitement, curiosity, or satisfaction, prompting them to develop a greater fondness for the exhibit and be willing to invest more time in appreciation. Furthermore, the value of the correlation coefficient provides a deeper understanding. Based on the magnitude and sign of the correlation coefficient, the degree and direction ofthe association between facial expression scores and dwell time can be determined. As an illustrative instance ofthis research, the obtained results revealed a correlation coefficient of 0.0138, falling below the established conventional threshold of 0.05. The data indicate a significant positive correlation between the two, implying that as facial expression scores increase, visitors' dwell time also correspondingly increases.
Therefore, the findings of this research reveal a close relationship between visitors' facial expression scores and their dwell time within the exhibition hall. This discovery holds important implications for exhibition design and improvement, aiding in enhancing the attractiveness of exhibits and visitor experiences, thereby elevating visitor satisfaction and the overall success ofthe exhibition.
4.4 Discussion
In summary, the proposed model exhibits low latency in data transmission and improves the accuracy of emotion recognition. Furthermore, a comparison was made with other studies. Razzaq et al. [29] proposed DeepClass-Rooms, a DTs framework for attendance and course content monitoring in public sector schools in Punjab, Pakistan. It employed high-end computing devices with readers and fog layers for attendance monitoring and content matching. CNN was utilized for on-campus and online courses to enhance the educational level. Sun et al. [30] introduced a novel technique that formalizes personality as a DTs model by observing users' posting content and liking behavior. A multi-task learning deep neural network (DNN) model was employed to predict users' personalities based on two types of data representations. Experimental results demonstrated that combining these two types of data could improve the accuracy of personality prediction. Lin and Xiong [31] proposed a framework for performing controllable facial editing in video reconstruction. By retraining the generator of a generative adversarial network, a novel personalized generative adversarial network inversion was proposed for real face embeddings cropped from videos, preserving the identity details of real faces. The results indicate that this method achieves notable identity preservation and semantic disentanglement in controllable facial editing, surpassing recent state- of-the-art methods. In conclusion, an increasing body of research suggests that combining DTs technology with DNN can enhance the accuracy and efficiency of facial expression recognition.
5. Conclusion
With the rapid advancement of science and technology, AI and neural network algorithms have pervaded diverse domains across society. The integration of information technology has profoundly impacted daily life through the meticulous analysis of extensive datasets. Within the context of disseminating historical and cultural narratives, conventional museums often rely on staff members' prolonged visual observations and intuitive assessments to gauge the appeal of exhibits to visitors. This qualitative approach, while competent, poses challenges in terms of quantifiability. This research leverages DTs to digitally model historical and cultural artifacts digitally, enhancing the CNN algorithm to construct a facial emotion recognition model. By coupling this with visitors'dwell time within the exhibit areas, the degree of attraction exerted by each booth upon tourists is assessed and quantified. The functional analysis of historical and cultural artifacts at the museum provides insight. However, certain limitations persist. Foremost among these is the need for enhancement in the accuracy of the facial expression recognition algorithm. Subsequent research endeavors will seek to realize real-time detection of changes in visitors' facial expressions and dwell time through the refinement of the face detection algorithm, thereby addressing the appeal of cultural exhibits to tourists via intelligent HCI approaches.
The combination of museums and medical care is a relatively new and noteworthy direction, especially in terms of cultural sensitivity, mental health and emotional healing, and museums can have a unique effect. The current research is still in the stage of the preliminary attempt to combine history and culture, and the way and effect of the combination of museum and medical treatment are still being explored.
References
[1] Niccolucci F., Felicetti A., Hermon S. Populating the data space for cultural heritage with heritage digital twins. Data, 7(8), 105, 2022.
[2] Götz F.M., Ebert T., Gosling S.D., et al. Local housing market dynamics predict rapid shifts in cultural openness: A 9-year study across 199 cities. American Psychologist, 76(6), 947, 2021.
[3] Bebenroth R., Goehlich R.A. Necessity to integrate operational business during M&A: the effect of employees' vision and cultural openness. SN Business & Economics, 1(8):1-17, 2021.
[4] Sakai M., Nagayasu K., Shibui N., et al. Prediction of pharmacological activities from chemical structures with graph convolutional neural networks. Scientific reports, 11(1):1-14, 2021.
[5] Rački D., Tomaževič D., Skočaj D. Detection ofsurface defects on pharmaceutical solid oral dosage forms with convolutional neural networks. Neural Computing and Applications, 34(1):631-650, 2022.
[6] Yoon D., Kong H.J., Kim B.S., et al. Colonoscopic image synthesis with generative adversarial network for enhanced detection of sessile serrated lesions using convolutional neural network. Scientific Reports, 12(1):1-12, 2022.
[7] Benradi H., Chater A., Lasfar A. A hybrid approach for face recognition using a convolutional neural network combined with feature extraction techniques. IAES International Journal of Artificial Intelligence, 12(2):627-640, 2023.
[8] Ahmad T., Wu J., Alwageed H.S., et al. Human activity recognition based on deep-temporal learning using convolution neural networks features and bidirectional gated recurrent unit with features selection. IEEE Access, 11:33148-33159, 2023.
[9] Ahmad S., Abbas M.Y., Yusof W.Z.M., et al. Creating museum exhibition: What the public want. Asian Journal Of Behavioural Studies (Ajbes), 3(11):27-36, 2018.
[10] Ryabinin K.V., Kolesnik M.A. Automated creation of cyber- physical museum exhibits using a scientific visualization system on a chip. Programming and Computer Software, 47(3):161-166, 2021.
[11] Shahrizoda B. Architectural and artistic solution of museum exhibition. European Multidisciplinary Journal of Modern Science, 5:149-151, 2022.
[12] Paul A., Mercado N., Block L., DeVoe B., Richner N., Goldberg G.R. Visual thinking strategies for interprofessional education and promoting collaborative competencies. Clin Teach., 20(5), e13644, 2023.
[13] Mukunda N., Moghbeli N., Rizzo A., Niepold S., Bassett B., DeLisser H.M. Visual art instruction in medical education: a narrative review. Med Educ Online, 24(1), 1558657, 2019.
[14] Anil J., Cunningham P., Dine C.J., Swain A., DeLisser H.M. The medical humanities at United States medical schools: a mixed method analysis of publicly assessable information on 31 schools. BMC Med Educ., 23(1), 620, 2023.
[15] Liptak A., Tate J., Flatt J., Oakley M.A., Lingler J. Humor and laughter in persons with cognitive impairment and their caregivers. J. Holist Nurs., 32(1):25-34, 2014.
[16] Koebner I.J., Fishman S.M., Paterniti D., et al. The art of analgesia: A pilot study of art museum tours to decrease pain and social disconnection among individuals with chronic pain. Pain Med., 20(4):681-691, 2019.
[17] Xianying D. Analysis on the educational function of campus culture in higher vocational colleges. The Theory and Practice of Innovation and Enntrepreneurship, 4(23):77-79, 2021.
[18] Chikaeva K.S., Gorbunova N.V., Vishnevskij V.A., et al. Corporate culture of educational organization as a factor of influencing the social health ofthe Russian student youth. Práxis Educacional, 15(36):583-598, 2019.
[19] DeBacker J.M., Routon P.W. A culture of despair? Inequality and expectations of educational success. Contemporary Economic Policy, 39(3):573-588, 2021.
[20] Zhong X., Babaie Sarijaloo F., Prakash A., et al. A multidisciplinary approach to the development ofdigital twin models ofcritical care delivery in intensive care units. International Journal of Production Research, 60(13):4197-4213, 2022.
[21] Zhang J., Kwok H.H.L., Luo H., et al. Automatic relative humidity optimization in underground heritage sites through ventilation system based on digital twins. Building and Environment, 216, 108999, 2022.
[22] Yang Y., Yang X., Li Y., et al. Application of image recognition technology in digital twinning technology: Taking tangram splicing as an example. Digital Twin, 2:6, 2022.
[23] Herman H., Sulistyani S., Ngongo M., et al. The structures ofvisual components on a print advertisement: A case on multimodal analysis. Studies in Media and Communication, 10(2):145-154, 2022.
[24] Kim D., Kim B.K., Hong S.D. Digital twin for immersive exhibition space design. Webology, 19(1):47-36, 2022.
[25] Tuan T.H., Seenprachawong U., Navrud S. Comparing cultural heritage values in South East Asia - Possibilities and difficulties in cross-country transfers of economic values. Journal of cultural heritage, 10(1):9-21, 2009.
[26] Wang Y., Li Y., Song Y., et al. The influence of the activation function in a convolution neural network model of facial expression recognition. Applied Sciences, 10(5), 1897, 2020.
[27] Tian X., Tang S., Zhu H., et al. Real-time sentiment analysis of students based on mini-Xception architecture for wisdom classroom. Concurrency and Computation: Practice and Experience, 34(21), e7059, 2022.
[28] Briceño I.E.S., Ojeda G.A.G., Vásquez G.M.S. Arquitectura mini-Xception para reconocimiento de sexo con rostros mestizos del norte del Perú. MATHEMA, 3(1):29-34, 2020.
[29] Razzaq S., Shah B., Iqbal F., et al. DeepClassRooms: a deep learning based digital twin framework for on-campus class rooms. Neural Computing and Applications, 35:8017–8026, 2023.
[30] Sun J., Tian Z., Fu Y., et al. Digital twins in human understanding: a deep learning-based method to recognize personality traits. International Journal of Computer Integrated Manufacturing, 34(7-8):860-873, 2021.
[31] Lin C., Xiong S. Controllable face editing for video reconstruction in human digital twins. Image and Vision Computing, 125(2), 104517, 2022.Document information
Published on 03/06/24
Accepted on 20/05/24
Submitted on 08/05/24
Volume 40, Issue 2, 2024
DOI: 10.23967/j.rimni.2024.05.010
Licence: CC BY-NC-SA license
Share this document
Keywords
claim authorship
Are you one of the authors of this document?
