Abstract
In this paper, an analytical solution is developed to investigate soil consolidation around a pile under earthquake loading. The solution is validated using finite element method. The influence of various parameters on excess pore water pressure is analyzed. The results show that excess pore water pressure increases with depth and is positively correlated with and /, while negatively correlated with , , , and . The values of , , , /, and affect excess pore water pressure during and after the earthquake, while the value of only affects excess pore water pressure after the earthquake. The growth rate of excess pore water pressure during the earthquake is positively correlated with , , , and /, and negatively correlated with and . The dissipation rate of excess pore water pressure during the earthquake is positively correlated with , , , /, and , and negatively correlated with . Additionally, a formula for calculating the reconsolidation settlement of pile-soil foundation after an earthquake is proposed, and the effects of pile and soil parameters on pile-soil foundation reconsolidation settlement are analyzed. The results indicate that reconsolidation settlement can be divided into two stages: rapid settlement stage and slow settlement stage. The total settlement of the foundation is positively correlated with , , and /, while negatively correlated with , , and .
Keywords: Earthquake, pile-soil foundation, excess pore water pressure, reconsolidation settlement, analytical solution
1. Introduction
The use of pile foundation in high-rise and super high-rise buildings has become increasingly common with the continuous development of modern urbanization [1]. However, frequent earthquakes around the world have raised concerns about the instability of buildings caused by liquefaction and reconsolidation of sandy soil foundations [2,3]. To address this issue, it is necessary to analyze the anti-liquefaction capacity and post-earthquake reconsolidation behavior of pile foundation treatment in sandy soil foundations to provide guidance for the safe and effective application of pile foundation in sandy soils.
After the implementation of pile foundation treatment in sandy soils, the pile and the sand collaboratively bear the upper loading. However, during strong earthquake activity, the pore water pressure inside the saturated sand may increase sharply, leading to a rapid decrease in effective stress and the continuous disappearance of the sand’s bearing capacity [4]. In such cases, the pile foundation can offer better stability and support to reduce the risk of upper structure collapse [5]. Knappett and Madabhushi [6] conducted centrifuge test to analyze the development of excess pore water pressure caused by liquefaction in pile-sandy soil foundation and the post-liquefaction reconsolidation settlement of the foundation. Bao et al. [7] analyzed the earthquake performance and post-earthquake consolidation settlement of multi-layered pile foundation buildings on liquefiable ground using finite element software.
Similarly, other researcher such as Xu et al. [1], Rollins and Strand [8], Chen et al. [9], Hussein and El Naggar [10], Chiou et al. [11], Xu et al. [12], Chen et al. [13] have analyzed the dynamic response of pile-sandy soil foundations under earthquake loading using experimental methods (such as shake table tests) or numerical simulation methods. Xu et al. [1] provided a comprehensive introduction to the existing experimental situations. Although these experimental and numerical simulation results are of great significance in guiding the earthquake design of pile-sandy soil foundations, they also reflect that the current research methods for the earthquake behavior of pile-sandy soil foundation mainly rely on experiments and numerical simulation, lacking analytical model. Compared to experiments and numerical simulations, analytical models are simpler and more convenient for engineering application. Additionally, analytical model can verify the accuracy of experiments and numerical simulations to some extent.
This paper proposes a theoretical model for soil consolidation around a pile considering earthquake effects, using the pile-soil strain compatibility assumption. After analyzing and solving the problem using Fourier transforms, the accuracy of the analytical model is verified using numerical simulations. Based on this, the influence of key parameters in the analytical model on the development and distribution of excess pore water pressure is analyzed using graphical methods. Finally, based on the obtained analytical model for soil consolidation around a pile considering earthquake effects, a calculation formula for reconsolidation settlement of pile-soil foundation is proposed, and the effects of pile and soil parameters on pile-soil foundation reconsolidation settlement are analyzed.
2. Mathematical model
2.1 Model background
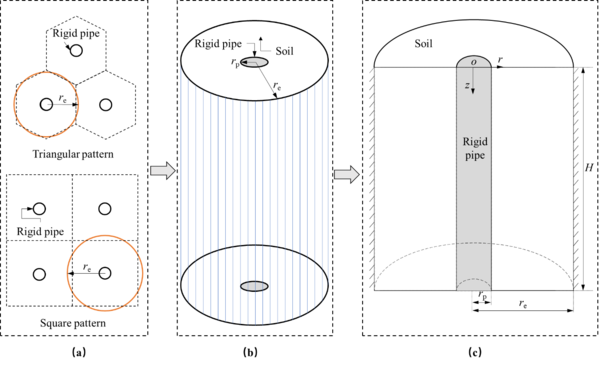
Figure 1(a) shows two common types of pile layout: rectangular distribution and triangular distribution. Both types can be utilized to extract the pile-soil element illustrated in Figure 1(b). Furthermore, the pile-soil element can be further depicted on a coordinate axis as shown in Figure 1(c). The radius of the pile is , the influence radius of the pile is denoted as , and the thickness of the pile-soil foundation is represented as . Since the pile is an impermeable pile, only vertical drainage of the soil is considered, and the vertical permeability coefficient is . The compressive modulus of the pile and the soil are and , respectively.
|
| Figure 1. Diagram of pile-soil foundation. (a) Pile layout. (b) Pile-soil element. (c) Mathematical model of pile-soil element |
2.2 Governing equation
Under earthquake loading, the equilibrium relationship can be expressed as follows:
|
|
(1) |
where and denote the radial average total stresses of the soil and pile, respectively, and represents the loading induced by earthquake.
Based on the assumption of equal strain, one can obtain:
|
|
(2) |
where denote the radial average excess pore water pressure of the soil , and is the vertical strain of pile-soil foundation.
Combining Eqs. (1) and (2), the vertical strain rate is expressed as follows:
|
|
(3) |
where , and .
The rate of change of total stress is regarded as the rate of excess pore pressure induced by earthquake [14], that is
|
|
(4) |
where related to magnitude, as shown in Table 1 by Seed and Booker [15]; is effective unit weight of soil; is number of liquefaction cycles; is the duration of the earthquake, and .
| Magnitude | |
|---|---|
| 6.5 | 8 |
| 7 | 12 |
| 8 | 30 |
The mass conservation equation for the water phase can be obtained using Darcy’s law by
|
|
(5) |
where unit weight of water, 9.8 kN/m3.
Combing Eqs. (3)~(5), one can obtain
|
|
(6) |
where .
2.3 Solving conditions
The initial excess pore water pressure is
|
|
(7) |
The top surface of soil is pervious, and the bottoms are impervious. The vertical boundary conditions of soil can be expressed as
|
|
(8) |
2.4 Normalization
For convenience, normalization is generally conducted to simplify problems to eliminate the influence of measured units. In this model, dimensionless variables or parameters are given as follows:
|
|
(9) |
Using the dimensionless parameters defined in Eq. (9), Eqs. (6)~(8) in dimensionless form are, respectively, listed below:
|
|
(10) |
|
|
(11) |
and
|
|
(12) |
2.5 Solution of dimensionless excess pore water pressure
Applying the finite Fourier transform to Eqs. (10) and (11) with the boundary conditions of Eq. (12), one can obtain
|
|
(13) |
and
|
|
(14) |
where , and .
Eq. (13) is a first-order differential equation that can be solved using the initial condition of Eq. (14). The solution is given by:
|
(15) |
The general solution of this model can be obtained by applying the inverse finite Fourier transform to Eq. (14), that is
|
|
(16) |
4. Numerical verification
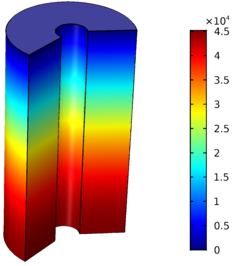
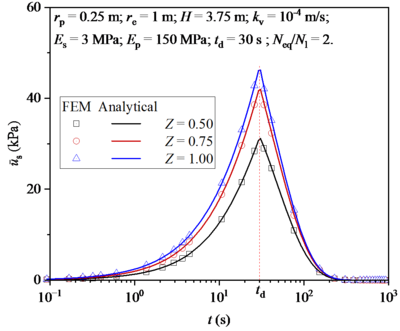
The finite element software COMSOL Multiphysics is used to solve the model numerically to verify the correctness of the analytical model. The parameters used in numerical simulation are given as follows: m, , , , , , , and . Figure 2 shows the distribution of excess pore water pressure around a pile simulated by COMSOL Multiphysics. The legend unit in Figure 2 is “Pa”. The data of excess pore water pressure calculated by COMSOL Multiphysics are extracted and compared with the analytical results, as shown in Figure 3. It is found that the numerical results coincide perfectly with the analytical results, which proves the correctness of the analytical solution.
|
| Figure 2. The distribution of excess pore water pressure around a pile by COMSOL Multiphysics ( s) |
|
| Figure 3. Comparison of numerical results and analytical results |
5. Excess pore water pressure during earthquake
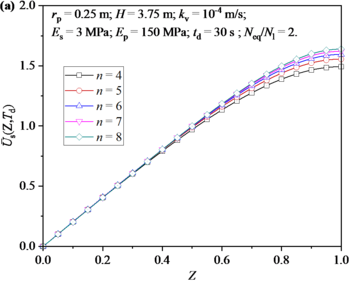
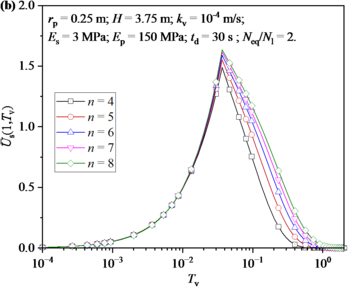
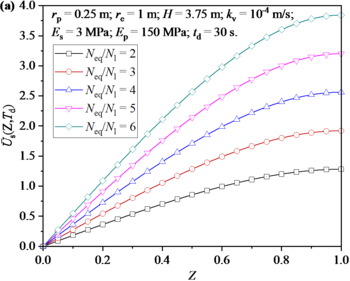
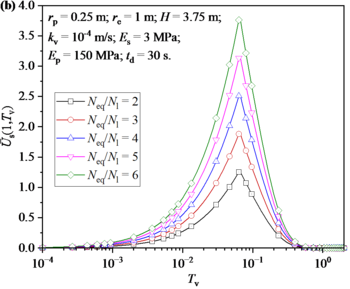
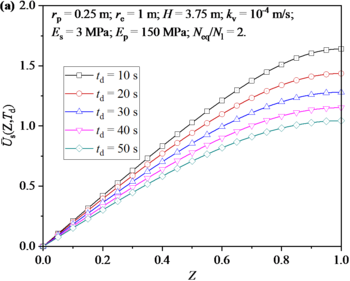
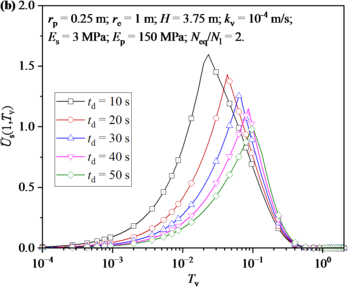
Figure 4 shows the distribution and development of excess pore water pressure in soil around a pile under different values (or influence radius ). Firstly, it can be seen from Figure 4(a) that value mainly has an obvious influence on the excess pore water pressure at the bottom of soil. Specifically, the excess pore water pressure increases with the increase of value. Figure 4(b) shows the development of excess pore water pressure at the bottom of soil. It can be found that the value has little influence on the excess pore water pressure in the earthquake stage, but has obvious influence on the excess pore water pressure in the post-earthquake stage. Specifically, the dissipation rate of excess pore water pressure is accelerated with the increase of value.
| ||||
| Figure 4. Effect of value on excess pore water pressure. (a) Distribution along depth. (b) Development over time |
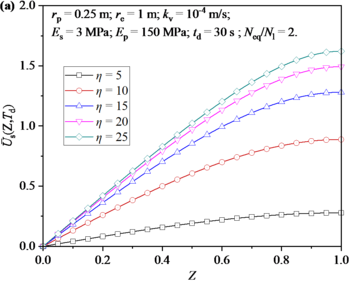
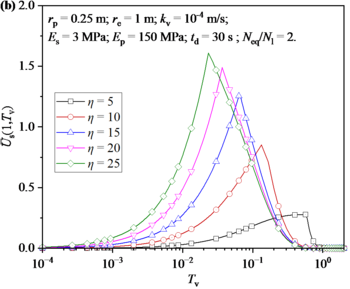
Figure 5 shows the distribution and development of excess pore water pressure in soil around a pile under different values (or the thickness of the pile-soil foundation ). It can be seen from Figure 5(a) that value has a significant influence on the excess pore water pressure along the depth direction. At the same depth, the excess pore water pressure increases with the increase of value. However, it is noted that the increase of excess pore water pressure at the same depth decreases with the increase of value. Figure 5(b) shows the development of excess pore water pressure at the bottom of soil. It can be found that the value has a significant effect on the excess pore water pressure during and after the earthquake. Firstly, it can be found that the maximum excess pore water pressure generated by earthquake increases with the increase of value. Then, the growth rate of excess pore water pressure during the earthquake and the dissipation rate of excess pore water pressure after earthquake increase with the increase of value.
| ||||
| Figure 5. Effect of value on excess pore water pressure. (a) Distribution along depth. (b) Development over time |
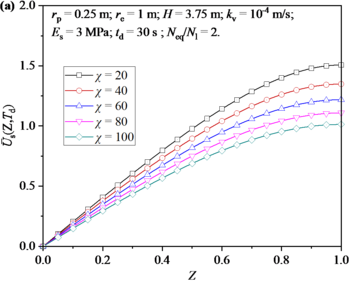
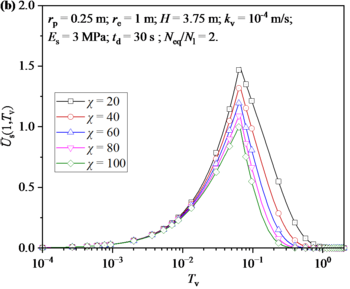
Figure 6 shows the distribution and development of excess pore water pressure in soil around a pile under different values (or the compression moduli of the pile ). It can be seen from Figure 6(a) that value has a significant influence on the excess pore water pressure along the depth direction. At the same depth, the excess pore water pressure decreases with the increase of value. Moreover, the increase of excess pore water pressure at the same depth decreases with the increase of value. Figure 6(b) shows the development of excess pore water pressure at the bottom of soil. It can be found that the value has a significant effect on the excess pore water pressure during and after the earthquake. Firstly, it can be found that the maximum excess pore water pressure generated by earthquake increases with the decrease of value. Then, the dissipation rate of excess pore water pressure after earthquake increase with the increase of value.
| ||||
| Figure 6. Effect of value on excess pore water pressure. (a) Distribution along depth. (b) Development over time |
Figure 7 shows the distribution and development of excess pore water pressure in soil around a pile under different . It can be seen from Figure 7(a): when is small, mainly has an obvious influence on the excess pore water pressure at the bottom of soil; when is high, value has a significant influence on the excess pore water pressure along the depth direction. The effect of on the excess pore water pressure shows that the excess pore water pressure decreases with the increase of . Figure 7(b) shows the development of excess pore water pressure at the bottom of soil. It can be found that the maximum excess pore water pressure generated by earthquake increases with the decrease of value. Then, the growth rate of excess pore water pressure during the earthquake and the dissipation rate of excess pore water pressure after earthquake increase with the increase of value.
| ||||
| Figure 7. Effect of on excess pore water pressure. (a) Distribution along depth. (b) Development over time |
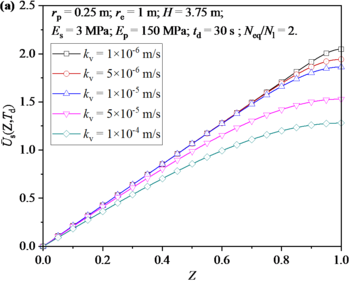
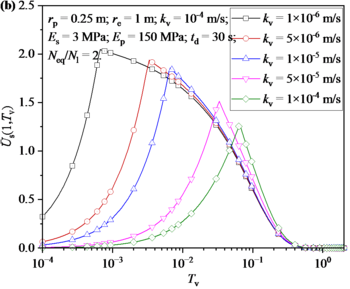
Figure 8 shows the distribution and development of excess pore water pressure in soil around a pile under different . It can be seen from Figure 8(a) that the excess pore water pressure increases with the increase of . Figure 8(b) shows the development of excess pore water pressure at the bottom of soil. It can be found that the maximum excess pore water pressure generated by earthquake increases with the decrease of value. Then, the growth rate of excess pore water pressure during the earthquake and the dissipation rate of excess pore water pressure after earthquake increase with the increase of value.
| ||||
| Figure 8. Effect of on excess pore water pressure. (a) Distribution along depth. (b) Development over time |
Figure 9 shows the distribution and development of excess pore water pressure in soil around a pile under different . stands for the duration of an earthquake. If the frequency of earthquakes remains constant, a shorter duration implies a higher frequency. It can be seen from Figure 9(a) that the excess pore water pressure decreases with the increase of . Figure 9(b) shows the development of excess pore water pressure at the bottom of soil. It can be found that the maximum excess pore water pressure generated by earthquake increases with the decrease of value. Then, it is noted that the effect of on the excess pore water pressure during the earthquake is obviously greater than that after the earthquake.
| ||||
| Figure 9. Effect of on excess pore water pressure. (a) Distribution along depth. (b) Development over time |
6. Reconsolidation settlement of goundation after earthquake
Due to the assumption of equal strain, the reconsolidation settlement of pipe-soil foundation can be calculated by the reconsolidation settlement of soil around the pile. The reconsolidation settlement of soil around the pile can be expressed as follows [4]:
|
|
(16) |
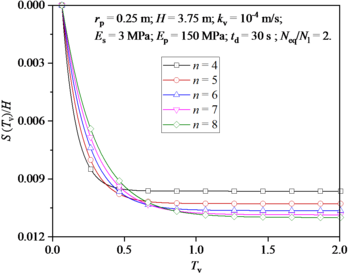
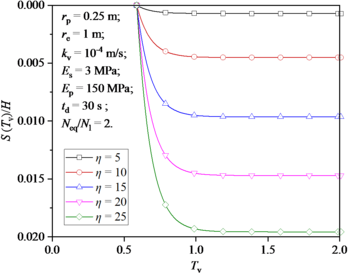
Figure 10 shows the reconsolidation settlement of foundation after earthquake under different values. It can be found that reconsolidation settlement is mainly divided into two stages: one is the rapid settlement stage, in which reconsolidation settlement develops rapidly; then there is the slow settlement stage in which reconsolidation settlement develops slowly. It can be seen from Figure 10 that the larger the value is, the slower the settlement rate in the early stage and the faster the settlement rate in the later stage. In general, the total settlement of foundation increases with the increase of value.
|
| Figure 10. Effect of n on reconsolidation settlement of foundation after earthquake |
Figure 11 shows the reconsolidation settlement of foundation after earthquake under different values. It can be seen that the total settlement of the foundation increases significantly as the value of increases.
|
| Figure 11. Effect of on reconsolidation settlement of foundation after earthquake |
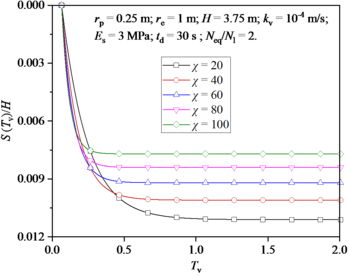
Figure 12 shows the reconsolidation settlement of foundation after earthquake under different values. It can be seen from Figure 12 that the larger the value is, the faster the settlement rate in the early stage and the slower the settlement rate in the later stage. In general, the total settlement of foundation decreases with the increase of value.
|
| Figure 12. Effect of on reconsolidation settlement of foundation after earthquake |
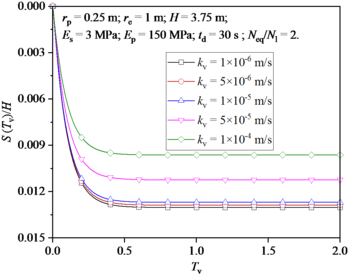
Figure 13 shows the reconsolidation settlement of foundation after earthquake under different values. It can be seen that the total settlement of the foundation decreases significantly as the value of increases.
|
| Figure 13. Effect of on reconsolidation settlement of foundation after earthquake |
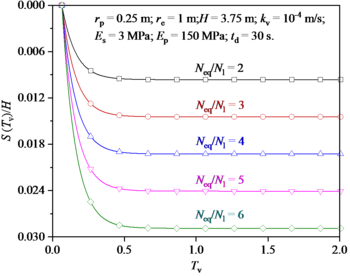
Figure 14 shows the reconsolidation settlement of foundation after earthquake under different / values. It can be seen that the total settlement of the foundation increases significantly as the value of / increases.
|
| Figure 14. Effect of / on reconsolidation settlement of foundation after earthquake |
Figure 15 shows the reconsolidation settlement of foundation after earthquake under different values. It can be seen that the total settlement of the foundation decreases significantly as the value of increases.
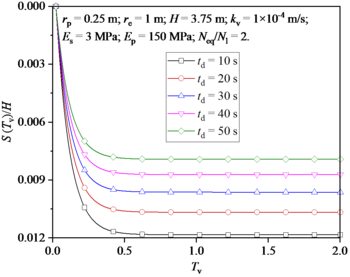
|
| Figure 15. Effect of on reconsolidation settlement of foundation after earthquake |
7. Conclusions
In this paper, an analytical solution to soil consolidation around a pile considering earthquake effect is proposed, and the accuracy of the analytical model is verified by finite element software. Finally, the effects of soil parameters, pile parameters and earthquake parameters in the analytical model on the excess pore water pressure and reconsolidation settlement after earthquakes are analyzed and discussed. The main conclusions are as follows:
(1) Distribution of excess pore water pressure in soil around the pile: The excess pore water pressure increased with depth, and is positively correlated with and /, and negatively correlated with , , , and .
(2) Development of excess pore water pressure in soil around the pile: The values of , , , /, and affect the excess pore water pressure during and after the earthquake, and the value of only obvious affects the excess pore water pressure after the earthquake; The growth rate of excess pore water pressure during the earthquake is positively correlated with , , , and /, and negatively correlated with and . The dissipation rate of excess pore water pressure during the earthquake is positively correlated with , , , /, and , and negatively correlated with .
(3) Reconsolidation settlement of foundation after earthquake: Reconsolidation settlement is mainly divided into two stages: rapid settlement stage and slow settlement stage; The total settlement of foundation is positively correlated with , , and /, and negatively correlated with , , and .
Data Availability Statement
All data, models, and code generated or used during the study appear in the submitted article.
Acknowledgements
This work had been supported by the Guangdong Key Areas R&D Program Projects, China (Grant number: 2020B0101130005), Research Project of Guangdong Power Grid Co. (Grant number: 031000QQ00220012).
References
[1] Xu C., Dou P., Du X., et al. Seismic performance of pile group-structure system in liquefiable and non-liquefiable soil from large-scale shake table tests. Soil Dynamics and Earthquake Engineering, 138, 106299, 2020.
[2] Finn W.D.L, Fujita N. Piles in liquefiable soils: seismic analysis and design issues. Soil Dynamics and Earthquake Engineering, 22(9-12):731-742, 2002.
[3] Cubrinovski M., Bray J.D., De La Torre C., et al. Liquefaction effects and associated damages observed at the Wellington CentrePort from the 2016 Kaikoura earthquake. Bulletin of the New Zealand Society for Earthquake Engineering, 50(2):152-173, 2017.
[4] Pal S., Deb K. Postearthquake reconsolidation settlement of stone column-treated liquefiable sand. International Journal of Geomechanics, 20(10), 04020183, 2020.
[5] Su L., Tang L., Ling X.-Z., et al. Responses of reinforced concrete pile group in two-layered liquefied soils: shake-table investigations. Journal of Zhejiang University-SCIENCE A, 2(16):93-104, 2015.
[6] Knappett J.A., Madabhushi S.P. Liquefaction-induced settlement of pile groups in liquefiable and laterally spreading soils. Journal of Geotechnical and Geoenvironmental Engineering, 134(11):1609-1618, 2008.
[7] Bao X., Ye G., Ye B., et al. Seismic performance of multi-story building with pile foundation in liquefiable ground including post-earthquake consolidation settlement. Advances in Soil Dynamics and Foundation Engineering, pp. 353-362, Shanghai, China, May 26-28 2014.
[8] Rollins K.M., Strand S.R. Downdrag forces due to liquefaction surrounding a pile. Proc. 8th National Conference on Earthquake Engineering, Earthquake Engineering Research Institute, Paper No. 1646, San Francisco, CA, April 18-22 2006.
[9] Chen X., Guan Z., Spencer Jr B.F., et al. A simplified procedure for estimating nonlinear seismic demand of tall piers. Engineering Structures, 174:778-791, 2018.
[10] Hussein A.F., El Naggar M.H. Seismic axial behaviour of pile groups in non-liquefiable and liquefiable soils. Soil Dynamics and Earthquake Engineering, 149, 106853, 2021.
[11] Chiou J.-S., Huang T.-J., Chen C.-L., et al. Shaking table testing of two single piles of different stiffnesses subjected to liquefaction-induced lateral spreading. Engineering Geology, 281, 105956, 2021.
[12] Xu L.-Y., Song C.-X., Chen W.-Y., et al. Liquefaction-induced settlement of the pile group under vertical and horizontal ground motions. Soil Dynamics and Earthquake Engineering, 144, 106709, 2021.
[13] Chen X., Xiang N., Li C. Influence of higher-order modes of slender tall pier bridge columns on the seismic performance of pile foundations. Soil Dynamics and Earthquake Engineering, 142, 106543, 2021.
[14] Xu Z. Calculation of pore pressure of liquefiable sand deposits using gravel drains (in Chinese). Earthquake Engineering and Engineering Vibration, 12(4):88-92, 1992.
[15] Seed H.B., Booker J.R. Stabilization of potentially liquefiable sand deposits using gravel drains. Journal of the Geotechnical Engineering Division, 103(7):757-768, 1977.Document information
Published on 09/06/23
Accepted on 22/05/23
Submitted on 03/05/23
Volume 39, Issue 2, 2023
DOI: 10.23967/j.rimni.2023.05.007
Licence: CC BY-NC-SA license
Share this document
Keywords
claim authorship
Are you one of the authors of this document?
