FEM2DEM User’s manual
A FEM-DEM methodology for the prediction of fractures in materials and structures.
International Center For Numerical Methods In Engineering (CIMNE)

FEM2DEM User’s manual
A FEM-DEM methodology for the prediction of fractures in materials and structures.
International Center For Numerical Methods In Engineering (CIMNE)
Introduction
This document explains the operation of the user interface of the FEM2DEM program to analyse two-dimensional solids using the simple FEM-DEM procedure proposed by Zarate & Oñate that is used to predict the initiation and propagation of fractures [1,2].
The proposed method enriches a well-defined crack opening methodology called Element Removal Technique by creating discrete elements in the lips of the crack. Some important aspects inherent to the formulation used, and presented in several articles [1-5], guarantee the good results obtained. In particular, the fact of using a smoothed tension field, guaranteeing the conservation of mass and the use of a simple algorithm to ensure the post-fracture contact between the fractured edge, are some of the characteristics of the FEM-DEM procedure.
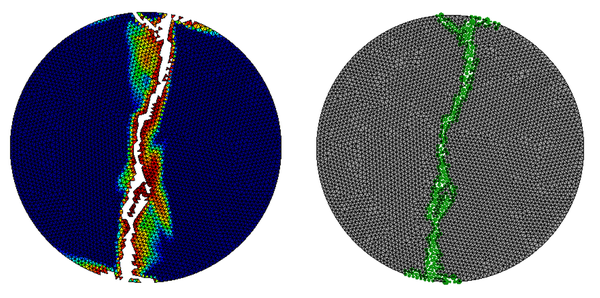
The FEM-DEM approach has been applied to a collection of reference problems in 2D and 3D that show the good performance of this numerical technique for the non-linear analysis of solids that involves situations of multiple fractures [1,2].
It is important to mention that the transition from FEM to DEM is done without the need to remesh, since once the maximum damage value is reached on each side of an element, it is eliminated and replaced by a pair of discrete elements located in the nodes of the element.
User interface
The FEM2DEM calculation module is used in conjunction with the GiD program and is compatible with version 12.1.11 or higher.
Figure 1 shows the classic GiD window.

To install the FEM2DEM program in GiD, it is necessary to copy the folder containing the code and the interface, inside the "problemtypes" directory of the GiD installation folder, as shown in Figure 2

Once this is done, it is necessary to restart the GiD program so that the user interface of the FEM2DEM program is fully operational and can be referenced as shown in Figure 3

When activated, the FEM2DEM module presents a toolbar where all the program's functionalities can be accessed:

Each of the icons allows access to a different utility. Figure 5 shows the use of each of the associated functions and that will be described in the following sections.
It should be mentioned that the FEM2DEM module is designed to work in the international system of units.

General Data ![]()
By clicking on the "General Data" button, the following window will appear:

This window has two tabs. The first corresponds to the general calculation data with the following options:
- Problem type: Defines whether it is a calculation of plain deformation or plain strain.
- Max. Number of iterations: Number of iterations that the solver will perform at most to find the convergence in a given time step. In case of non-convergence, the increment of time is automatically reduced to a tenth part.
- Resolución: Tolerance of convergence in damage.
- Minimum time increment: Defines the smallest time step to use in case the solution does not converge.
- Gravity: Activates or deactivates the gravity effect.
The second tab "Time control" allows to modify the parameters shown in Figure 7.

- Final analysis time: Total time of the simulation.
- Default time increment: time incresae to be use by default.
- Default postprocess interval: Default time interval to generate post-processing information.
- Default graph output: Time interval to generate data for graphs.
Time functions definition ![]()
By clicking on the "Time functions definition" button, the following window is obtained:

In the case that the boundary conditions or applied forces vary in magnitude over time, it is necessary to define said information through the window of Figure 8.
Initially, you must select the tab associated with the variable on which your temporal variation will be defined. Said variation is defined by intervals of time and amplitude. FEM2DEM will consider a linear variation of the amplitude between two time marks. Understanding the amplitude as the factor of amplification of the variable. On the other hand, it is important to define the time function from time 0 to a time greater than the total time of the simulation.
In each defined time interval it is possible to use a different time step ("DTUSER") from the defined by default, as long as the new time step is lower. In the same way it is possible to define the postprocessing intervals "TOUTP" and "TOUTD". Figure 9 shows an example.

In the case shown in Figure 9 it can be seen how the amplitude function of the pressure forces have a maximum at t = 0.0451005 s and from there it decreases to zero at t = 0.046 s.
In another aspect it is interesting to see that the increment of time is variable being this of 10-4 s in the interval from 0s to 0.045 s and changing to a value of 10-7 s in the rest of the simulation.
Finally, it is important to comment that a value of 0 implies the use of the time step defined by default (Figure 7).
Assign imposed displacement ![]()
By means of the "Assign imposed displacements" button, you access the options shown in Figure 10, which are valid for points or lines:

To define a displacement condition, the corresponding displacement must be activated and its value must be provided either in the X or Y direction or both. Once these fields have been defined, by means of the "assign" button, the points or lines associated with these conditions must be selected on the geometry.
This window also allows you to unassign, list or draw the entities to which a condition has been applied.
Assign imposed velocities ![]()
In the same way that the imposed displacements are assigned, the imposed speeds on points and/or lines are assigned using the button "Assign imposed speeds" as shown in the pop-up window of Figure 11.
For this, it is necessary to provide the value of the imposed speed, projected on the Cartesian axes and then assign to the points or lines of interest.
As in the case of imposed displacements, you can list assigned entities, draw them and/or deallocate them.

Assign punctual forces ![]()
The punctual forces assignment is done through the use of the pop-up window shown in Figure 12:

The allocation mechanism is very similar to what have been described in the previous options. In this window, the magnitude of the projection of the force on the Cartesian coordinates is informed, in order to assign it to the points of interest of the geometry using the corresponding button.
Likewise, it is possible to remove point loads, draw them on the geometry or de-sign them.
Assign uniformly distributed forces ![]()
The assignment of uniformly distributed forces is done by using the pop-up window shown in Figure 13 and is very similar to the punctual loads case.
The only caveat lies in the fact that the distributions forces must be applied only to the lines of the geometry.

Assign pressure forces ![]()
The assignment of the pressures over the solid surfaces is carried out following the same model as the uniformly distributed loads. With the addition to provide a delay value. This value is useful in the blasting simulation where the blast holes do not explode simultaneously, but there is a certain lag between them. It is worth mentioning that the associated temporal amplitude curve will be the same for all the assigned geometrical entities.

Assign material properties ![]()
The definition of the mechanical properties associated with the different materials that can be used are defined and assigned by means of the corresponding icon which presents the pop-up window shown in Figure 15

In this window, the following variables are defined:
- Young: Value of the elasticity modulus of the material (Pa).
- Poisson: Poisson's ratio ν.
- Self-weight: Value of the specific weight of the material (N/m3).
- Thickness: Thickness of the material (value 1 m if it is for plane strain).
- Material model: Modelo de superficie de fluencia a escoger: Rankine, Mohr-Coulomb, Christensen, Truncate Rankine y Mixed.
- Damage Model: Model of yield surface to choose: Rankine, Mohr-Coulomb, Christensen, Truncate Rankine and Mixed.
- Failure Tension Stress: Elastic limit in traction.
- Failure compression Stress: Elastic limit in compression.
- Failure energy in Tension: Fracture energy in traction.
- Failure energy in Compression: Fracture energy in compression.
When any of these values is modify, it is necessary to save them associated with the name of a material. Once this is done it is possible to link an area of the geometry with a specific material. Obviously there cannot be any area left without having an associated material.
Assign DEM contact parameters ![]()
The normal contact stiffness Kn between spheres is the parameter defined in this section. The default value is useful in most cases.

Define graphs in post process ![]()
![]()
It is possible to define a maximum of 5 different graphs that allow to monitor the behaviour of the simulation. In each of them, one variable is defined on the abscissa and another on the ordinates

Figure 17 shows how to select any of the 5 available graphics.
Once the corresponding graph has been selected, the degree of freedom to be plotted (displacements, reactions, speeds and accelerations) is chosen by means of the "X select Field" button. In the same way we proceed using the corresponding button for the variables to be represented on the Y axis.
Mesh generation ![]()
By means of this button the mesh is generated on the defined geometry, taking into account all the conditions of load, displacement and defined materials.
Actions over the calculation ![]()
![]()
![]()
The last three buttons are related to the calculation process of FEM2DEM.
The first one is used to start the calculation once the previous steps have been completed.
The second button allows you to obtain information about the process that is being carried out, showing the progress of the calculation (calculation time, passing of time, taking place ...)
The last button is used to cancel the calculation and stop the process.
References
[1] Zárate, F. & Oñate, E. A simple FEM–DEM technique for fracture prediction in materials and structures. Comp. Part. Mech. (2015) 2: 301-314. https://doi.org/10.1007/s40571-015-0067-2
[2] Zárate, F., Cornejo, A. & Oñate, E. A three-dimensional FEM–DEM technique for predicting the evolution of fracture in geomaterials and concrete, Comp. Part. Mech. (2017). https://doi.org/10.1007/s40571-017-0178-z
[3] Oñate E., Zárate F., Celigueta M.A., González J.M., Miquel J., Carbonell J.M., Arrufat F., Latorre S., Santasusana M., Advances in the DEM and Coupled DEM and FEM Techniques in Non Linear Solid Mechanics. In: Oñate E., Peric D., de Souza Neto E., Chiumenti M. (eds) Advances in Computational Plasticity. Computational Methods in Applied Sciences, vol 46. Springer, Cham (2018)
[4] González, J.M., Zárate, F. & Oñate, E. Pulse fracture simulation in shale rock reservoirs: DEM and FEM–DEM approaches. Comp. Part. Mech. (2017). https://doi.org/10.1007/s40571-017-0174-3
[5] Zárate, F., Gonzalez, J.M., Miquel J., Lohner, R., Oñate, E., A coupled FEM-DEM procedure for predicting blasting operations in tunnels. Papers Repository of the International Centre for Numerical Methods in Engineering (CIMNE) (2017)
Document information

Published on 01/01/2018
Licence: CC BY-NC-SA license
