Abstract
By using in situ daily observations in East China during 1961–2007 and NCEP reanalysis data, the methods of statistical analyses, urban minus rural and observation minus reanalysis, it is revealed that the observed climate change and surface warming in East China were mainly induced by urbanization. The results show that East China has experienced two warmer periods of 1930s and 1980s in the past century; from 1951 to 2007, the regional mean temperature increased at a rate of 0.14°C per decade; heat waves happened in urban center more frequently, and local climate showed a warming and dry trend; there was no significant linear trend in regional mean precipitation in the past 50 years. Urbanization was a crucial element for the regional warming; about 44% of the warming was due to heat island effect in the mega city.
Keywords
East China ; urbanization ; climate change
1. Introduction
Global warming is the main feature of climate changes, and the characteristics and the possible causes are among the core issues in current climate change research [ Ren et al., 2008 ]. According to the IPCC Fourth Assessment Report (AR4), 11 of the last 12 years (1995–2006) ranked among the 12 warmest years in the instrumental records of global surface temperatures (since 1850); the linear trend for the past 50 years was almost twice that for the last 100 years [ IPCC, 2007a ]. Ding et al. [2003] found that the temperature in China had increased 0.4–0.5°C over the past 100 years, which was slightly lower than the global mean, and the fastest warming happened in the northwest, north and northeast regions, and urbanization was an important source of uncertainty in the temperature assessment [ Gong and Wang, 2002 ].
Both China’s largest freshwater bodies — the Dongting Lake, the Yangtze River, as well as the most developed economic zone: the Yangtze River Delta economic zone, are located in East China. The unique location and high intensity of human activities have unique effect on climate. Zhou et al. [2009] found that the regional temperature increased at a rate of 0.57°C per decade during 1979–2005; the 10-year warming in East China was approximately 0.5–0.9°C; satellite data showed the tropospheric temperature over East China increased 0.25–0.50°C [ IPCC, 2007b ]. However, some other results [ Lin and Guan , 2008 ] showed that the regional mean summer temperature decreased from 1961 to 2004.
During the 12th Five-Year Plan (2011–2015), East China will face both opportunities and challenges. Additional challenges include coping with more frequent extreme weather and disasters, such as heavy precipitation, flooding, heat waves, typhoon, fog and haze, lighting, and sea level rise. Study on regional climate change and the projections are significantly important for regional adaptation, which can provide scientific and technological support for local governments to make climate change strategies. This paper analyzes the regional temperature, precipitation, and high-impact weather from 1873 to 2007, as well as the implications of rapid urbanization process in the regional warming.
2. Data and methodology
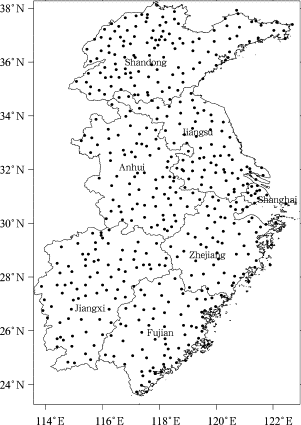
In this paper, East China (Fig. 1 ) refers to 6 provinces (Jiangsu, Zhejiang, Anhui, Fujian, Jiangxi, and Shandong) and 1 municipality (Shanghai).
|
|
|
Figure 1. Study area and locations of the stations
|
2.1. Data
(1) Observational data in the period of 1961–2007 include daily mean, maximum and minimum temperatures, precipitation, and relative humidity.
(2) Centennial records of annual mean temperature from 7 stations.
(3) NCEP/NCAR reanalysis data from 1981 to 2007.
(4) Nighttime light imagery from DMSP/OLS during 1992–2007.
2.2. Methodology
Optimal interpolation technique is adopted to interpolate station data (temperature and precipitation during 1951–2007) into grid data with the purpose to reduce area weight bias due to different numbers of weather stations and inhomogeneity.
Observation minus reanalysis (OMR) [ Kalnay and Cai, 2003 ] and urban minus rural (UMR) approaches are adopted to estimate the possible contributions of urbanization and land use to temperature trends, where urban and rural division is mainly based on demographic data or satellite nighttime lights data [ Yang et al., 2011 , Gallo et al., 1999 and Hansen et al., 1999 ].
A heat wave event is defined as when the daily maximum temperature ≥ 35°C, and the minimum temperature ≥ 25°C for three or more consecutive days.
3. Temperature
3.1. Temperature change from 1873 to 2007
Figure 2 shows the variation of annual mean temperature at each centennial station with records up to 2007. As the solid orange line shows, Shanghai’s annual mean temperature went up at a rate of 1.43°C per 100 years, significantly higher than the global average over the past 100 years (0.74°C per 100 years). The two periods of 1905–1945 and 1980–2007 were the most obvious warming stages. From 1994 to 2007, annual mean temperatures in Shanghai were persistently high for 14 consecutive years.
|
|
|
Figure 2. Variations of annual mean temperature from 7 centennial stations during 1873–2007
|
From 1900, Qingdao displayed a significant warming trend (1.01°C per 100 years); the temperatures in Fuzhou and Jinan had no obvious trend; Xiamen had a slight cooling trend (–1.30°C per 100 years). Basically, each station has experienced two warming stages: the first stage from the 1930s to the 1940s, and the second stage from the 1980s to present.
3.2. Temperature change during 1951–2007
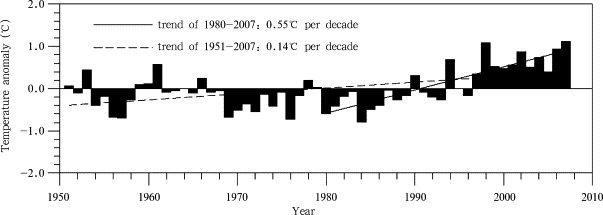
During 1951–2007, the annual mean temperature has increased at a rate of 0.14°C per decade in East China when the grid data were used (Fig. 3 ), lower than the national rate for the same period (0.22°C per decade), but slightly higher than the global average (0.13°C per decade). The warming rate for 1980–2007 was 0.55°C per decade, twice the global warming rate over the same period (0.26°C per decade).
|
|
|
Figure 3. Variations of annual mean temperature anomalies for East China during 1951–2007
|
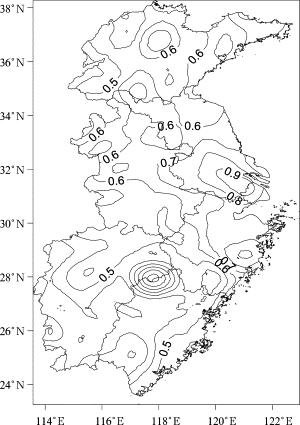
East China also reported geographic differences in annual temperature rise. For example, during 1980–2007 the northern part of the region experienced a more noticeable rise, compared with the southern part (Fig. 4 ). Sixteen medium and large cities across the Yangtze River Delta were urban heat islands, distributed in a Z shape running across Nanjing, Changzhou, Wuxi, Suzhou, Jiaxing, Shaoxing, Ningbo and other cities, with Shanghai and Hangzhou being the cross sections.
|
|
|
Figure 4. Spatial distribution of linear trends in annual mean temperature in East China during 1980–2007 (unit: °C per decade)
|
3.3. Heat wave
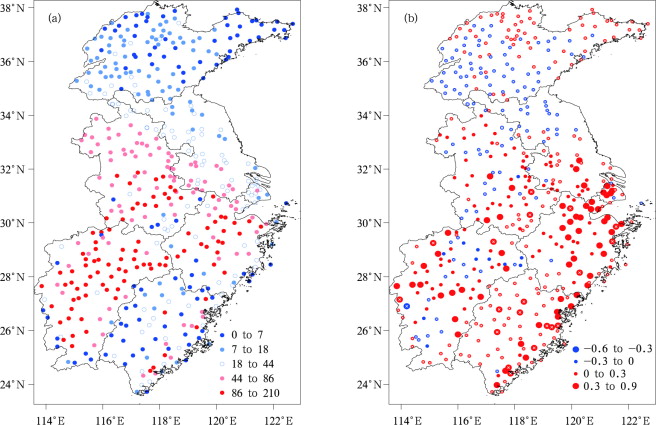
During 1961–2007, more heat wave events were observed in Jiangxi, Zhejiang and most part of Anhui (> 80), with cumulative frequency more than 160 in Jiangxi and Shandong provinces, followed by Jiangsu and most of Fujian provinces with less frequency (< 40). Meanwhile, the Yangtze River Delta, central Zhejiang and part of Jiangsu reported an ascending trend, and a decreasing trend in Jiangxi, Shandong, northern Anhui, northern Jiangsu and southwestern Jiangxi (Fig. 5 ).
|
|
|
Figure 5. Spatial distribution of heat wave cumulative frequency (a) and the linear trends (b, unit: times per decade) in East China during 1961–2007 (cross denotes the trend statistically significant at 0.05 evel)
|
To further understand the differences of temperature and humidity variation during heat waves in cities and suburbs, we take Shanghai as an example with Xujiahui station representing the center of the city, and Chongming station for the suburb. Figure 6 showed the average temperature (square dots) and dew point (dots) during the heat waves of each year. During 1960–2006, heat waves in the center of city were much more than those in the suburb — a total of 26 years for Xujiahui and 13 years for Chongming. Meanwhile, there was a clear increasing trend in the difference between air temperature and dew point, which indicated that the local climate in city’s center became hotter and drier. This is a typical climate effect of urbanization.
|
|
|
Figure 6. Variatons of Mean surface air temperature and dew point temperature during heat waves for urban (a) and suburb stations (b) during 1957–2007 [ Hou et al., 2008 ]
|
4. Precipitation
4.1. Precipitation change from 1951 to 2006
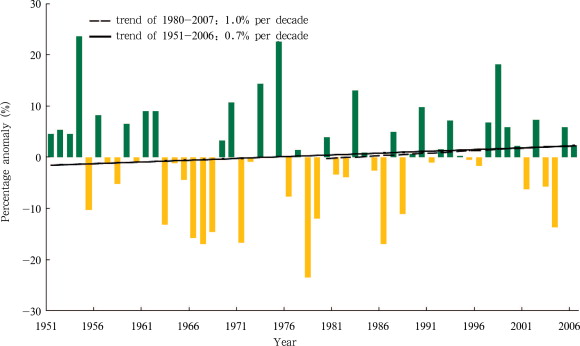
Analysis with the grid precipitation data indicated that the region experienced a weak ascending trend in annual rainfall (0.7% per decade) during 1951–2006, and weak ascending trend (1.0% per decade) during 1980–2006 (Fig. 7 ). During 1961–2007, most parts of the region witnessed an ascending trend for heavy rains in terms of both frequency (0.15 d per decade) and amount, most noticeably along the southern part of the Yangtze River. Meanwhile, moderate and light rains tended to become fewer in occurrence (at a rate of about 3 d per decade, see Table 1 ).
|
|
|
Figure 7. Variations of annual rainfall percentage anomalies for East China during 1951–2006
|
| Grade (24 h) | Variation in amount | Variation in rainy days |
|---|---|---|
| Light rain (0.1–9.9 mm) | Decrease in most parts | Decrease in most of the region |
| Moderate rain (10.0–24.9 mm) | Increase in the middle and decrease in the south and north | Increase in the middle and decrease in the south and north |
| Heavy rain (25.0–49.9 mm) | Increase in the south and decrease in the north | Increase in the south and decrease in the north |
| Rainstorm (50.0–99.9 mm) | Increase in most parts | Increase in most parts |
| Thunderstorm (100.0–250.0 mm) | Increase in the southwest and decrease in the northeast | Increase in the southwest and decrease in the northeast |
| Heavy thunderstorm (> 250.0 mm) | Decrease in most parts | Decrease in most parts |
4.2. Non-typical Plum Rain
As shown in Figure 8 , the rainy days as percentage to the duration of Plum Rain season showed a significant decreasing trend during 1875–2006 (1960–2006 reduced about 20%). Whether this phenomenon is linked with the global or local climate warming is not clear and needs further study.
|
|
|
Figure 8. Variations of rainy days as percentage to the duration of Plum Rain season for Shanghai
|
5. Effects of urbanization on surface air temperature
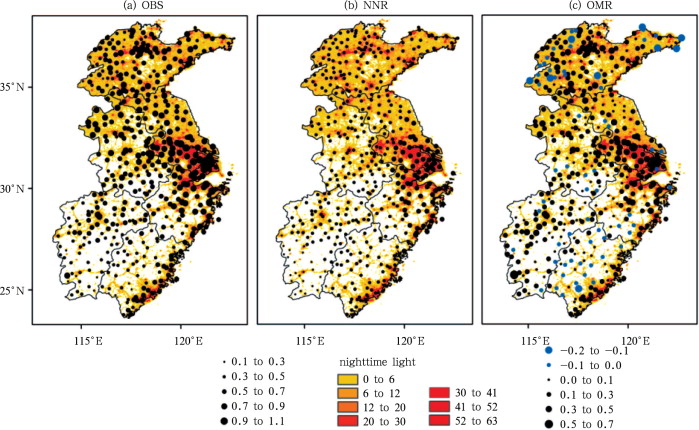
Figures 9 (a) and 9 (b) show the linear trends in annual mean temperature of station records and of reanalysis data for 463 sites located at elevations below 500 m in East China during 1981–2007, as well as the DMSP/OLS nighttime light imagery in 2007. The station observations (Fig. 9 a) indicate that, on average, the annual mean temperature reflects an increase rate of 0.58°C per decade during 1981–2007, with the warming pattern closely related to the intensity of the nighttime lights. By contrast, the reanalysis estimation (Fig. 9 b) shows that, as a whole, the temperature in East China reflects an increase at a mean rate of 0.44°C per decade from 1981 to 2007. The spatial disparity in the reanalysis temperature trends is substantially less than that in the station observations, indicating possible effects from atmospheric circulation and greenhouse gas concentration. Figure 9 (c) shows the difference between the observation and reanalysis trends (i.e., OMR). The distribution of the OMR trends is quite similar to that of the observation trends in Figure 4 , indicating a significant effect of urbanization on surface warming in East China during 1981–2007.
|
|
|
Figure 9. DMSP/OLS nighttime light imagery in 2007 and trends in annual mean temperature from (a) station observations (OBS), (b) NCEP/NCAR reanalysis (NNR), (c) observation minus reanalysis (OMR) at sites located below 500 m in East China during 1981–2007(unit: °C per decade; 0.58°C, 0.44°C, and 0.14°C per decade are the mean trends of all OBS, NNR, and OMR, respectively) [Yang et al., 2011]
|
Table 2 presents the temperature trends from station observations, reanalysis, along with OMR and UMR. From 1981 to 2007, the largest increase in observed annual mean temperature occurred at the metropolis stations with a trend of 0.90°C per decade. From the sites of large to small cities, the linear trends show monotonic descent from 0.74 to 0.61°C per decade. The rural sites display the weakest warming trend with a rate of 0.50°C per decade. The reanalysis annual mean temperature changes, which reflect those mainly associated with changes in circulation and greenhouse warming, generally exhibit a weaker warming trend than observations do. In addition, the reanalysis trends are nearly uniform, with a low range of 0.42–0.51°C per decade. The OMR trends, which may be attributed to urban heat island effect since 1981, indicate strong warming in metropolises and large cities with average rates of 0.40 and 0.26°C per decade, respectively. The OMR trends of medium cities, small cities, and suburban areas display moderate warming with 0.21, 0.17, and 0.14°C per decade, respectively. The OMR trend for rural stations shows almost imperceptible warming. The UMR trend is 0.29°C per decade for metropolises, 0.21°C per decade for large cities, 0.14°C per decade for medium cities, and 0.10°C per decade for suburb sites. The lowest UMR trend is found over small cities at 0.08°C per decade.
| OMR | UMR | |||||
|---|---|---|---|---|---|---|
| OBS | NNR | OMR | Urban | Rural | UMR | |
| Rural | 0.51** | 0.42** | 0.08 | |||
| Suburb | 0.65** | 0.51** | 0.14 | 0.65** | 0.55** | 0.10 |
| Small city | 0.61** | 0.45** | 0.17 | 0.61** | 0.53** | 0.08 |
| Medium city | 0.67** | 0.46** | 0.21 | 0.67** | 0.54** | 0.14 |
| Large city | 0.74** | 0.48** | 0.26 | 0.80** | 0.60** | 0.21 |
| Metropolis | 0.90** | 0.51** | 0.40 | 0.87** | 0.59* | 0.29 |
Note:
- . and
- . denote the trend statistically significant at 0.05 and 0.01, respectively
The trends of OMR and UMR are generally consistent, which indicates that rapid urbanization has significant influence on surface warming over East China. Overall, urban heat island effects contribute 24.2% to regional mean warming. The strongest effect of urbanization on annual mean temperature occurs over the metropolis and large city stations, with corresponding contributions of about 44% and 35% to total warming, respectively.
6. Conclusions
In summary, the main conclusions of this study are as follow:
(1) For centuries, temperatures in East China experienced two warming phases, the 1930s–1940s and from the 1980s to now, especially the latter stage significant. From 1961 to 2007, the annual mean temperature increased at rate of 0.14°C per decade, lower than the national average, but higher than the global mean. After the 1980s, occurrence of heat waves in the center of city was much more frequent than that in suburb, which indicates that the local climate has become hotter and drier.
(2) During 1951–2006, there is no obvious trend in annual precipitation totals. Both the amount and days of heavy rainfall increased; rainy days as percentage of the total Plum Rain duration illustrates decreasing trend.
(3) Urban heat island effects contribute 24.2% to regional mean warming. The strongest effect of urbanization on annual mean temperature occurs over the metropolis and large city stations, with corresponding contributions of about 44% and 35% to total warming, respectively.
Acknowledgements
This work was supported by the Climate Change Special Foundation of China Meteorological Administration (No. CCSF-09-10 and CCSF201202), National Natural Science Foundation of China (No. 41001023), CAS Pilot Special Project (No. XDA05090204), and Jiangsu Research and Innovation Program for Graduate Student (No. CXZZ12-0497).
References
- Ding et al., 2003 Y.-H. Ding, J. Zhang, Y. Xu, et al.; Climatic System Change and Forecast, China (in Chinese) ; China Meteorological Press, 32–35 (2003)
- Gallo et al., 1999 K.P. Gallo, T.W. Owen, D.R. Easterling, et al.; Temperature trends of the US historical climatology network based on satellite-designated land use/land cover; J. Climate, 12 (1999), pp. 1344–1348
- Gong and Wang, 2002 D.-Y. Gong, S.-W. Wang; Uncertainties in the global warming studies; Earth Science Frontiers (in China), 9 (2) (2002), pp. 371–376
- Hansen et al., 1999 J. Hansen, R. Ruedy, J. Glascoe, et al.; GISS analysis of surface temperature change; J. Geophys. Res., 104 (D24) (1999), pp. 30997–31022
- Hou et al., 2008 Y.-L. Hou, B.-D,. Chen, B.-M. Chen, et al.; Characteristics of local air temperature variation influenced by Shanghai urbanization; Plateau Meteorology, 27 (2008), pp. S131–S138
- IPCC, 2007a IPCC; ,in: S.D. Solomon (Ed.), et al. , Climate Change 2007: The Physical Science Basis. Contribution of Working Group I to the Fourth Assessment Report of the Intergovernmental Panel on Climate ChangeCambridge University Press (2007), p. 996
- IPCC, 2007b IPCC; ,in: S.D. Solomon (Ed.), et al. , Summary for Policymaker of Climate Change 2007: The Physical Science Basis. Contribution of Working Group I to the Fouth Assessment Report of the Intergovernmental Panel on Climate ChangeCambridge University Press (2007), p. 18
- Kalnay and Cai, 2003 E. Kalnay, M. Cai; Impact of urbanization and land-use change on climate; Nature, 423 (2003), p. 528531
- Lin and Guan, 2008 X. Lin, Z.-Y. Guan; Temporal-spatial characters and interannual variations of summer high temperature in East China; Journal of Nanjing Institute of Meteorology (in Chinese), 31 (1) (2008), pp. 1–9
- Ren et al., 2008 G.-Y. Ren, Y.-Q. Zhou, Z.-Y. Chu, et al.; Urbanization effects on observed surface air temperature trends in North China; J. Climate, 21 (6) (2008), pp. 1333–1348
- Yang et al., 2011 X. Yang, Y. Hou, B. Chen; Observed surface warming induced by urbanization in East China; J. Geophys. Res., 116 (2011) http://dx.doi.org/10.1029/2010JD015452 D14113
- Zhou et al., 2009 W.-D. Zhou, J.-H. Zhu, J. Li, et al.; Characteristics of climate change for heat resources in east China; Resources Science, 31 (3) (2009), pp. 472–478
Document information
Published on 15/05/17
Submitted on 15/05/17
Licence: Other
Share this document
Keywords
claim authorship
Are you one of the authors of this document?

