Abstract
Evaluation and projection of temperature extremes over China are carried out with 8 model datasets from CMIP5. Compared with the NCEP reanalysis data, multi-model weighted ensemble is capable of reproducing the 8 temperature extreme indices and 20-year return values of annual maximum/minimum temperatures. The time correlation coefficients of all the 8 indices between multi-model ensemble and the reanalysis can reach a significance level of 0.10. The spatial correlation coefficient of 20-year return level of annual maximum/minimum temperatures is greater than 0.98. Under the RCP4.5 scenario, more extreme warm events and less cold events are expected over China in multi-model ensemble. By the middle of the 21st century, the heat wave duration index will be multiplied 2.6 times. At the end of the 21st century, the cold wave duration index will decrease 71%, and the 20-year return value will increase 4°C in parts of China for the maximum/minimum temperatures.
Keywords
CMIP5 ; temperature extremes ; RCP4.5 scenario ; return period ; projection
1. Introduction
In the last decade, extreme weather and climate events occurred frequently and exerted profound influence on human society and natural environment. There are many evidences suggesting that anthropogenic activity may be the main reason for the observed global warming during the 20th century [ IPCC, 2007 ]. Global warming may has impact on the frequency and intensity of the extreme weather and climate events [ Frich et al., 2002 and Alexander et al., 2006 ]. As a major tool in simulating and projecting climate change under different greenhouse gas emissions scenarios, global climate models (GCMs) have been widely used to study the temperature and precipitation extremes [ Meehl and Tebaldi, 2004 and Tebaldi et al., 2006 ]. Certain ability has been revealed for the GCMs in simulating extreme climate and projecting its future change. Previous studies were mainly based on the IPCC Fourth Assessment Report (AR4) models [ Wang et al., 2008 , Zhao et al., 2008 and Jiang et al., 2009 ], while there haven’t been many evaluation and projection researches from the latest GCMs participated in the Coupled Model Intercomparison Projection Phase 5 (CMIP5). This paper uses the 8 modeling datasets from CMIP5 to make known the latest outcomes. The capability of these models in simulating the past extreme temperature indices and return period in China are evaluated, and the potential changes in temperature extremes are projected.
2. Data and methods
Most modeling groups over the world have completed their simulations and 8 models’ outputs have been released at the onset of this study, which are enough for the multi-model ensemble (MME) purpose. Further investigation will be carried out when more models’ outputs become available. General information on each of the 8 models is summarized in Table 1 . The integration period for the historical simulation is 1850–2005, and that for projection is 2006–2100. The projection in this study is under RCP4.5 scenario, which is a medium stabilization scenario and refers to a radiative forcing of 4.5 W m–2 by 2100. The NCEP reanalysis dataset is used here as a reference to evaluate historical simulation. The spatial resolution for NCEP reanalysis data is 94×192 [ Kalnay et al., 1996 ], and the period favored here is 1950–2005. All the model and observation data are first bilinear interpolated to 128×256 Gaussian grids for ensembling and spatial averaging. When calculating the ensemble mean, a method of weighted averaging is used and the weighting coefficient is in inverse proportion to the absolute simulation bias for each model.
| Model name | Institution and country | Resolution |
|---|---|---|
| Bcc-csm1-1 | Beijing Climate Center, China Meteorological Administration, China | 64×128 T42 |
| CanESM2 | Canadian Centre for Climate Modelling and Analysis, Canada | 64×128 T42 |
| CNRM-CM5 | Centre National de Recherches Meteorologiques, France | 128×256 T127 |
| CSIRO-MK3.6 | Australian Commonwealth Scientific and Industrial Research Organization Marine and Atmospheric Research, Australia | 96×192 T63 |
| Inmcm4 | Institute for Numerical Mathematics, Russia | 120×180 |
| IPSL-CM5A-LR | Institute Pierre Simon Laplace, France | 96×96 |
| MPI-ESM-LR | Max Planck Institute for Meteorology, Germany | 96×192 T63 |
| NorESM1-M | Norwegian Climate Centre, Norway | 96×144 |
Extreme climate indices are generally adopted to describe the temperature extremes. Eight indices mentioned in this paper are cold wave duration index (CWDI), frost days (FD), heat wave duration index (HWDI), summer days (SD), cold nights (TN10P), warm nights (TN90P), cold days (TX10P), and warm days (TX90P). The calculation of each index is in accord with the definition suggested by the Expert Team on Climate Change Detection and Indices (ETCCDI) [ Easterling et al., 2003 ] (Table 2 ).
| Index | Definition | Unit |
|---|---|---|
| Cold wave duration index(CWDI) | Longest days in interval of at least five consecutive days with daily minimum temperature 5°C less than the base period mean | d |
| Frost days(FD) | Number of days with minimum temperature less than 0°C | d |
| Heat wave duration index(HWDI) | Longest days in interval of at least five consecutive days with daily maximum temperature 5°C greater than the base period mean | d |
| Summer days(SD) | Number of days with minimum temperature greater than 25°C | d |
| Cold nights(TN10P) | Percentage of days with daily minimum temperature less than the 10th percentile of the base period | % |
| Warm nights(TN90P) | Percentage of days with daily minimum temperature greater than the 90th percentile of the base period | % |
| Cold days(TX10P) | Percentage of days with daily maximum temperature less than the 10th percentile of the base period | % |
| Warm days(TX90P) | Percentage of days with daily maximum temperature greater than the 90th percentile of the base period | % |
Note: The base peroid is 1961–1990
Annual maximum and minimum temperature could be well fitted by general extreme value (GEV) distribution [ Jenkinson , 1955 ], and thus the 20-year return value of daily maximum (or minimum) temperature is estimated. Instead of the maximum likelihood estimation, L-moments was applied in this study to estimate the parameter of the distribution since it is fast to calculate and needs a small sample size [ Hosking, 1990 ].
3. Evaluation of the historical simulation
Though a single model has limited capability, MME can well simulate the 8 national-averaged extreme climate indices in China (Table 3 ). The CWDI, FD, HWDI, and SD are overestimated by the models, while the other indices are underestimated. The biases of CWDI, FD, SD, TN10P, and TX90P are all less than 1%, while that of HWDI is greater than 8%. The linear trend of each index simulated by the MME is comparable with that of observation. Among the 8 simulated indices, TX90P is the closest to observation, while the performance is poorer for CWDI and TX10P. The temporal correlation coefficients between simulated indices and observations are shown in Table 3 . As far as the correlation is concerned, the interannual variation of the cold indices is simulated worse than that of the warm indices. The statistical significance level for correlation coefficients of CWDI, TN10P, and TX10P is 0.1, while 0.05 for the four warm indices and FD.
| Index | Relative error(%) | Correlation coefficient | RMSE | Linear trend (per 10 years) | |
|---|---|---|---|---|---|
| MME | Observation | ||||
| CWDI | 0.43 | 0.270* | 2.71 | –0.60 | –0.01 |
| FD | 0.25 | 0.567** | 5.67 | –2.85 | –1.83 |
| HWDI | 8.56 | 0.670** | 3.72 | 1.70 | 3.28 |
| SD | 0.58 | 0.614** | 3.77 | 2.13 | 3.53 |
| TN10P | –0.33 | 0.290* | 2.15 | 0.05 | 0.29 |
| TN90P | –4.13 | 0.756** | 3.36 | 3.67 | 2.47 |
| TX10P | –2.66 | 0.290* | 1.39 | 0.33 | 0.07 |
| TX90P | –0.19 | 0.791** | 2.17 | 3.09 | 3.09 |
Note: Correlation coefficients marked with
- . denote passing the 0.1 significance test, and those marked with
- . denote passing the 0.05 significance test
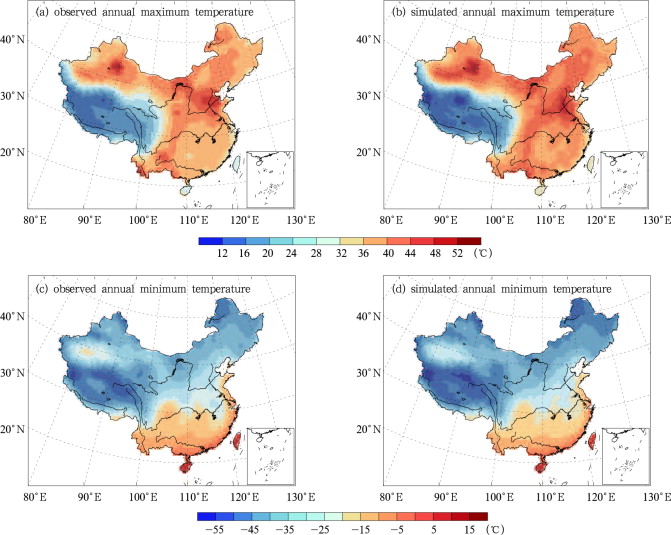
The simulated spatial character of each index is examined in this study (figure not shown). The models simulate the CWDI higher in the east of the Qinghai-Tibetan Plateau and lower in the west. A systematic positive bias is found in simulating the FD especially in northwestern China, while the performance is better in northeastern China. The simulated HWDI, SD, and TX90P are lower than observations in regions around the Tarim Basin and Yunnan province, and higher in North China and eastern Inner Mongolia. Models tend to overestimate the TN10P and TX10P in the southeastern Qinghai-Tibetan Plateau, and underestimate TX10P in North China and TN90P in Northwest China. In general, it is confined for the models to simulate the regional spatial feature of these indices. For the simulation in eastern China, warm events are overestimated whereas cold events are underestimated. However in western China, cold events are overestimated and warm events are underestimated, which is in accord with previous findings based on IPCC AR4 models [ Wang et al., 2008 ]. The 20-year return value of national mean annual maximum temperature is shown in Figure 1 a. The higher values mainly occur in eastern Xinjiang province, North China Plain and Southeast China, and the lower values occur in the plateau region. Compared with outcomes from NCEP reanalysis data (Fig. 1 b), the simulated spatial pattern is similar to the observation with a spatial correlation coefficient of 0.987, in spite of a lower tendency in the east of the plateau and a higher tendency in southeastern China. The 20-year return value of annual minimum temperature is well simulated by the MME and the spatial correlation coefficient is 0.996. The simulated minimum temperature is lower than observation in Heilongjiang and parts of Xinjiang province (Fig. 1 c&1d).
|
|
|
Figure 1. The observed and simulated spatial distribution of 20-year return values of annual maximum and minimum temperature during 1986–2005 |
4. Projection of future change
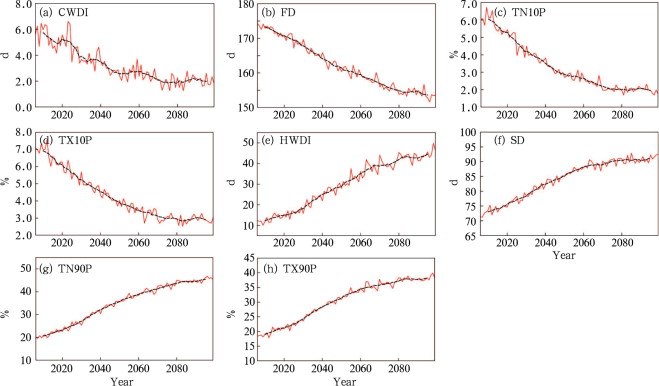
As projected by MME under RCP4.5 scenario, CWDI, FD, TN10P, and TX10P in China will decrease in the future, and the change is great in the early 21st century (Fig. 2 ). Among the cold indices, TN10P has the most significant decreasing trend. By the late 21st century (2080–2099), TN10P is projected to be 71% less than that in the reference period (1986–2005). FD is projected to have the minimum decrease, and the amplitude of its change is only over 10%.
|
|
|
Figure 2. Anomalies of extreme climate indices in the 21st century relative to 1986–2005 in China (dashed line: 9-year running mean) |
The projected HWDI, SD, TN90P, and TX90P will keep increasing in the future, especially during the middle 21st century under RCP4.5 scenario. By 2046–2065, all the warm indices excluding SD will be 120% more than those during the reference period, and HWDI will be 2.6 times higher than current level.
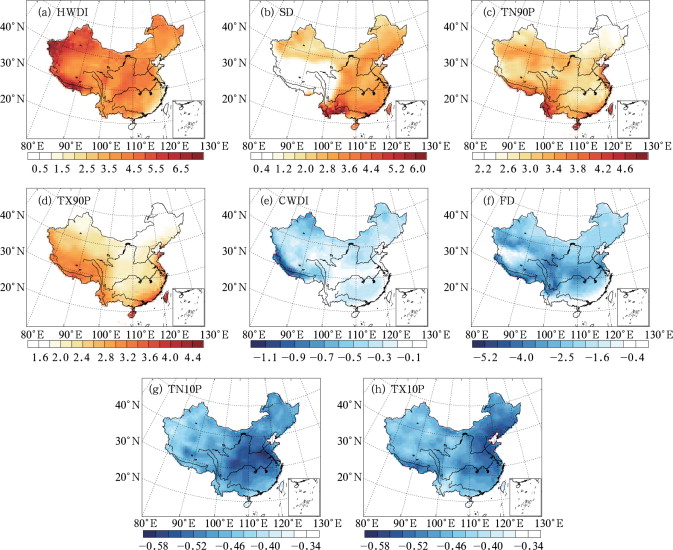
Since the daily maximum and minimum temperatures keep on increasing in the future, extreme warm events will happen more frequently while the number of cold events will be less than that of the reference period. Figure 3 shows the linear trend of each extreme climate index projected by the MME under RCP4.5 scenario during 2006–2099. According to the projection, the most significant increase in HWDI will be in southwestern Xinjiang and the southern Tibet with more than 7 days per decade in local regions. Moreover, central China might also have a greater increase than its surrounding regions. The most significant trend for SD would happen in Yunnan province, which is about 5.2 days per decade. TN90P and TX90P would increase mainly in the coastal regions, while the change in Northeast China, northern Xinjiang, and central China is small. The most decrease in CWDI would happen in northern Xinjiang and southern Tibet, while the change is not significant over other regions. In the future, a decreasing trend is projected for FD in the eastern Qinghai-Tibetan Plateau, for TN10P in North China Plain and Sichuan Basin, and for TX10P in the coastal region around the Bohai Sea.
|
|
|
Figure 3. Spatial distribution of the linear trends in the extreme climate indices in China during 2006–2099 (unit of (a), (b), (e), (f) is d per 10 years, and that of (c), (d), (g), (h) is % per 10 years) |
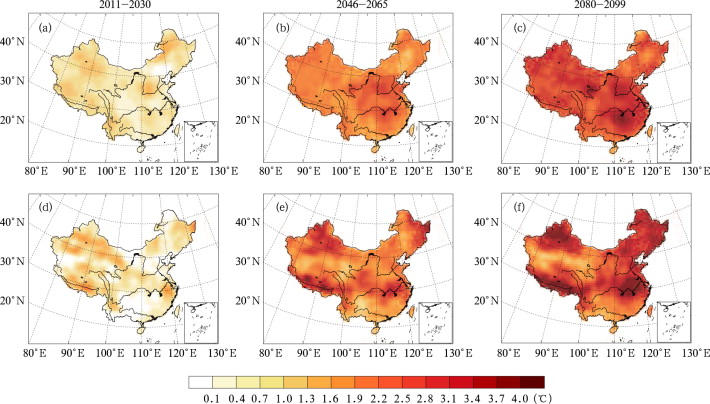
The projected 20-year return value of annual maximum temperature is shown in Figure 4 . As projected by the MME, 20-year return value in most regions excluding Beijing-Tianjin-Tangshan area will have a warming about 1°C relative to reference period during the early 21st century. By the middle and late 21st century, the maximum temperatures will keep on increasing, and an increase of 3–4°C might happen in the middle and lower reaches of the Yangtze River and the Yellow River. The 20-year return value of annual minimum temperature is also projected to be increasing and with more regional features. The change will be significant in northern Xinjiang, the southern Qinghai-Tibetan Plateau, the middle and lower reaches of the Yangtze River, and northeastern China.
|
|
|
Figure 4. Spatial distribution of 20-year return values of annual maximum (top) and minimum (bottom) temperature anomalies during 2011–2030 (left), 2046–2065 (center), and 2080–2099 (right) relative to 1986–2005 in China |
5. Conclusions
To some extent, the MME of 8 CMIP5 models has certain capability in simulating the 8 extreme climate indices and the 20-year return values of annual maximum and minimum temperatures in China. The MME can well simulate the CWDI, FD, SD, TN10P, and TX90P with relative errors less than 1%. The linear trend and interannual variation of most extreme climate indices can be simulated by the models. The linear trends of 4 warm indices and FD are at 0.05 statistically significant level. The MME tends to overestimate the warm events and underestimate the cold events in eastern China, while it is at the opposite in western China. The simulated 20-year return values of annual maximum and minimum temperatures show a similar pattern with observations, and the spatial correlation coefficients are close to 1.
Under RCP4.5 scenario, the MME projects that the cold indices will decrease and the warm indices will increase during the 21st century in China, which is similar with the previous research based on IPCC AR4 models. Such change will be greater during the early 21st century, while it will slow down in the late 21st century. The 20-year return values of annual maximum and minimum temperatures in China might increase significantly under RCP4.5 scenario. Some parts of China might have a 4°C warming by the late 21st century. The above projections indicate that the extreme warm events will be more frequent and stronger while the extreme cold events will be fewer and weaker.
It should be pointed out that the uncertainty still exists and even becomes larger in simulating regional climate extremes despite of the great advance in the development of the GCMs. Meanwhile, the future projection based on greenhouse gas emissions scenario does not take into consideration of the impact of natural forcing. Future studies will be carried out to address the above questions and methods. Downscaling and ensemble combination will also be employed to better simulate and project the regional climate extremes over China.
Acknowledgements
This work is supported by the National Basic Research Program of China (No. 2010CB950501-03). One of the authors (YAO) is sincerely grateful to the guidance from Prof. ZHAO Zong-Ci and help from Dr. XU Chong-Hai.
References
- Alexander et al., 2006 L.V. Alexander, X. Zhang, T.C. Peterson, et al.; Global observed changes in daily climate extremes of temperature and precipitation; J. Geophys. Res., 111 (2006) http://dx.doi.org/10.1029/2005JD006290 D05109
- Easterling et al., 2003 D.R. Easterling, L.V. Alexander, A. Mokssit, et al.; CCl/CLIVAR workshop to develop priority climate indices; Bull. Amer. Meteor. Soc., 84 (2003), pp. 1403–1407
- Frich et al., 2002 P. Frich, L.V. Alexander, P. Della-Marta, et al.; Observed coherent changes in climatic extremes during the second half of the twentieth century; Climatic Change, 19 (2002), pp. 193–212
- Hosking, 1990 J.R.M. Hosking; L-moments: Analysis and estimation of distributions using linear combinations of order statistics; Journal of the Royal Statistical Society, B52 (1990), pp. 105–124
- IPCC, 2007 IPCC; Climate Change 2007: The Physical Science Basis: Contribution of Working Group I to the Fourth Assessment Report of the Intergovernmental Panel on Climate Change, Cambridge University Press (2007), p. 996
- Jenkinson, 1955 A.F. Jenkinson; The frequency distribution of the annual maximum (or minimum) values of meteorological elements; Quart. J. Roy. Meteor. Soc., 81 (1955), pp. 158–171
- Jiang et al., 2009 Z.-H. Jiang, W.-L. Chen, J. Song, et al.; Projection and evaluation of the precipitation extremes indices over China based on seven IPCC AR4 coupled climate models; Chinese Journal of Atmospheric Sciences (in Chinese), 33 (1) (2009), pp. 109–120
- Kalnay et al., 1996 E. Kalnay, M. Kanamitsu, R. Kistler, et al.; The NCEP/NCAR 40-year reanalysis project; Bull. Amer. Meteor. Soc., 77 (1996), pp. 437–470
- Meehl and Tebaldi, 2004 G.A. Meehl, C. Tebaldi; More intense, more frequent, and longer lasting heat waves in the 21st century; Science, 305 (2004), pp. 994–997
- Tebaldi et al., 2006 C. Tebaldi, K. Hayhoe, J.M. Arblaster, et al.; Going to the extremes: An intercomparison of model-simulated historical and future changes in extreme events; Climatic Change, 79 (2006), pp. 185–211
- Wang et al., 2008 J. Wang, Z.-H. Jiang, J. Song, et al.; Evaluating the simulation of the GCMS on the extreme temperature indices in China; Acta Geographica Sinica (in Chinese), 63 (3) (2008), pp. 227–236
- Zhao et al., 2008 Z.-C. Zhao, Y. Luo, Y. Jiang, et al.; Projections of surface air temperature change in China for the next two decades; Journal of Meteorology and Environment (in Chinese), 24 (5) (2008), pp. 1–5
Document information
Published on 15/05/17
Submitted on 15/05/17
Licence: Other
Share this document
Keywords
claim authorship
Are you one of the authors of this document?


