Abstract
Starting with exploration from the perspective of urban spaces, this research was conducted by analyzing the functional areas—urban centers with the most highlighted contradictions in terms of intensive land use in order to develop an evaluation model for intensive land use in urban centers. Based on quantitative research methods, and taking into account three aspects of intensive use, i.e., buildings, lands and traffic as well as multiple evaluation factors, this paper conducted the research horizontally by means of quantitative and comparative studies on each individual factor, developed the evaluation model for intensive land use in urban centers, and analyzed the driving forces of intensive land use from the aspects of buildings, land use, roads, etc.
Keywords
Intensive land use ; Evaluation model ; Urban center ; Degree of intensive use ; Index system
1. Introduction
With the rapid development of tertiary industry in China since the 1980s, the roles of cities have gradually been transformed into distribution and service centers. Both living service and productive service industries have successively been clustered in urban centers, rendering this kind of agglomeration in each urban center a brand-new status in terms of both scale and extent. As one of the nonrenewable resources, land in urban centers is faced with increasing pressures having emerged from those dimensions of space, traffic and landscaping, etc. Only by means of applying the intensive mode of land use to a greater extent will it be possible to implement its central service functions. Therefore, it is the urban center that imposes the greatest demand on land use in higher density.
However, in most cities of China at present, intensive land use in central areas is inadequate, with significant waste of space. On one hand, non-public facilities are laid out in lower density, occupying substantial urban lands, with extensive use of space and lower space revenue; on the other hand, public facilities are not constructed in a sufficiently intensive way. Low-rise public buildings occupy extensive lands, making it impossible to take full advantage of land value in urban centers. All these problems, along with other issues, such as excessive area of street blocks, lack of urban branch systems, poor management and organization, etc. have impeded the implementation of public service function of urban centers (Wang, 2009 ).
This paper developed a research analyzing the functional areas—urban centers with the most highlighted contradictions in terms of intensive land use—in order to construct an evaluation model from such dimensions as spatial forms, structural elements and service functions, elaborated, with regard to land use, deep reasons of intensive land use at medium–micro -level, and explored the specific pivot points of areas with central functions for intensive land development strategy.
2. Impact factors of intensive land use in urban centers
Urban center is the core area of urban development, of which compact spatial forms present intensive land use in the whole area. In considering evaluation index system on intensive land use in urban centers, this paper began with the exploration of the core problems of land use from the perspective of spaces, deduced the impact factors related to the development and construction of land in urban centers, and created the evaluation index system on intensive land use in urban centers by incorporating interactions of those impact factors. Space research is at the center of the study on intensive land use in urban centers. The indices for evaluating intensive degree of spaces consist of the following three aspects.
2.1. Intensive scale of buildings in urban centers
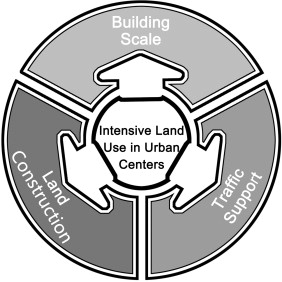
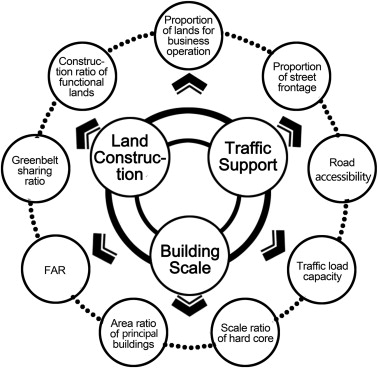
Building spaces implementing public functions include various spaces undertaking urban industrial functions within urban centers, which satisfy the requirements of the evolution of the forms of urban public spaces. They also act as material carriers for the development of service industry. We may say that, to a certain extent, the intensive development of urban centers depends on high degree of clustering of building spaces with public functions. Furthermore, in selecting appropriate mode of urban land use, due to their different intrinsic attributes, functional spaces show different development trends, which are represented as spaces of building entities in different forms within urban centers. (Figure 1 ).
|
|
|
Figure 1. Structural chart of factors for intensive land use in urban centers. |
2.2. Intensive construction of land in urban centers
Urban land is the fundamental element of intensive land use in central areas as well as the source of clustering of various forms of material spaces. Moreover, urban land could be divided into supporting land and construction land, both of which have impacts on intensive land use. The distribution of supporting lands indicates the relationship between non-development lands, such as greenbelt and water surface, etc., and the overall spatial forms of central areas, while construction land has an impact on the forms and utilization efficiency of spaces with public functions.
2.3. Intensive traffic support in urban centers
The intensive operation of spaces in urban centers relies on the efficiency of the structure of their road traffic network. Road traffic acts as a kind of spatial support framework, orienting land expansion and development in urban centers. On the one hand, optimum accessibility facilitates the intensive development of urban centers and promotes intensification of spatial forms; on the other hand, as non-construction space in urban centers, road traffic is a negative factor for intensive land use (Li et al., 2010 )
3. Construction of index system for intensive land use in urban centers
The following three factors of intensive land use in urban centers are further developed, namely buildings, lands and traffic. Related impact factors, such as specific functional spaces of buildings, land subdivisions for business operation, proportion of street frontage, and hard core clustering in urban centers, etc., are considered as well. In this way, the indices of nine correlations are obtained in order to construct the index system for intensive land use in urban centers (Figure 2 ).
|
|
|
Figure 2. Construction of index system for intensive land use in urban centers. |
3.1. Area ratio of principal buildings (A1)
In nature, the area ratio of large-scale functional buildings represents the degree of spatial clustering of urban functions, indicating predominant trends of the development of urban functions in an urban center.
From the perspective of intensive land use, the primary ratio of functional spaces directly influences the evolution of spatial forms in urban centers, ensures effective implementation of leading functional spaces, and acts as a specific index for measuring the elements of functional spaces.
3.2. Construction ratio of functional lands (A2)
The restriction of the construction ratio of lands with public functions on intensive land use has two-fold meaning. One refers to the scale of lands for developing the functional spaces of modern service industry on the level of street blocks. It relates to the area of the street block occupied by the entity of each functional space and indicates the utilization status of the lands available for construction in urban centers. The other relates to the construction scope of lands making direct contributions to the development of urban centers, including urban lands which enhance operating efficiency of central areas, such as land for road traffic. It also represents utilization efficiency of lands in urban centers. Therefore, land construction ratio is an index for measuring the elements of land development.
3.3. Road accessibility (A3)
Road accessibility is a specific factor of restriction on road traffic factors in urban centers, indicating the road area and the number of straight road segments. Here, the number of straight road segments implies the efficiency of traffic flow on the ground.
Road accessibility index is defined as ,
K is the accessibility index of road network in urban centerA the area of roads in urban center, mi the straight road segments at node I and M the total road segments of network in urban center
With the same area of land, the more the straight road segments, the smoother the traffic flow of motor vehicles. Road area indicates the reasonable utilization degree of overall road network within urban centers. In similar conditions, the more the road area, the greater the proportion of overall road network in terms of land use in the whole central area. This ratio implies that, given the area ratio of a road network with high efficiency, the more the straight road segments, the higher the efficiency of the road network structure as a whole.
3.4. FAR (floor area ratio) (B1)
FAR is the most obvious factor for measuring intensive degree of land use in urban centers. The FAR of urban centers indicates the overall status of land use of spatial entities in those areas. Therefore, the FAR of urban centers depends on the interplay of the land for construction and the buildings within those regions. FAR value represents land use in urban centers indirectly. However, due to the difference between land use mode for landscaping and land use mode for construction in urban centers, the features of the two different urban centers are usually represented under one same FAR value. Thus, FAR is biased towards building implications.
3.5. Traffic load capacity (B2)
In a broad sense, traffic load capacity represents intensive degree of land use and functional spaces in urban centers. Firstly, the total area of driveways in urban centers indicates the size of motor vehicle traffic, which becomes the foundation of intensive traffic development. Secondly, the development of functional spaces in urban centers depends on the fundamental basis established by traffic and other supporting facilities. Traffic load capacity indicates the operating efficiency of road traffic in urban centers, and is an important index of intensive traffic land use in urban centers.
3.6. Proportion of street frontage (B3)
Proportion of street frontage is an important index in measuring economic benefit which has occurred in urban centers. It can be elaborated from two aspects. The first relates to the interfaces of street blocks. In urban centers, the more the interfaces of street blocks created along traffic road network, the more the opportunities for service operations. They can provide more services for other spaces with central functions created by entry and exit traffic. Therefore, street frontage shall be calculated as area per driveway of segments longer than 8 m in our analysis. The second aspect relates to road area. Where less road area creates more street frontages, it means more direct contributions of road utilization with high efficiency to economic benefits of urban centers.
3.7. Scale ratio of hard core (C1)
Hard core is the clustering of functional spaces in urban centers of extra high density, with its scope defined as building area of functional spaces in urban centers accounting for 90% of the total area. The scale of hard core is a unique characteristic of the development of urban centers. The scale ratio of hard core has two aspects of meanings. The first aspect is the proportion of the scale of land tenure in hard core areas, which indicates the degree of clustering in the hard core under the land use mode of urban centers. The second aspect is the proportion between the building area of hard core area and the area of urban centers, which implies the overall characteristic of the scale of spatial clustering of the hard core and acts as the yardstick for comparison of different hard core areas in urban centers. Therefore, in this research, the proportion of building area in hard core is adopted for both analysis and calculation.
3.8. Proportion of lands for business operation (C2)
The characteristics of lands in urban centers are diversified. However, they could be classified into only two types according to the methods of land leasing. One way of land leasing is conducted by means of market competition, while the other is by means of transfer. The latter is mostly applied to the type of lands that offer supporting services for those lands acquired by the former method. In urban centers, it is mostly the lands for business operation that implement the function of central services and create primary economic benefits. Thus, in this study on intensive land use, the lands used for business operation are calculated inclusively, including the lands used for retail business, banking and insurance, business consulting, hospitality, entertainments, etc. The area ratio of the lands for business operation to the lands for construction in urban centers is regarded as the utilization efficiency of lands for business operation as well as the index of intensive land operation.
3.9. Greenbelt sharing ratio (C3)
Greenbelt sharing ratio indicates the degree of landscape clustering in urban centers. On one hand, the area of lands for landscaping is inextricably related to the specific quality developed in urban centers; on the other hand, the layout of buildings in urban centers imposes specific demands on landscaping. Therefore, greenbelt sharing ratio denotes the area of lands for landscaping shared by per unit building area. Furthermore, different greenbelt sharing rates imply different construction modes of urban centers, such as clustering and development of buildings with central functions with penetration of massive lands for landscaping, or otherwise, the low-density coverage of buildings with reduction of lands for landscaping.
4. Construction evaluation model for intensive land use in urban centers
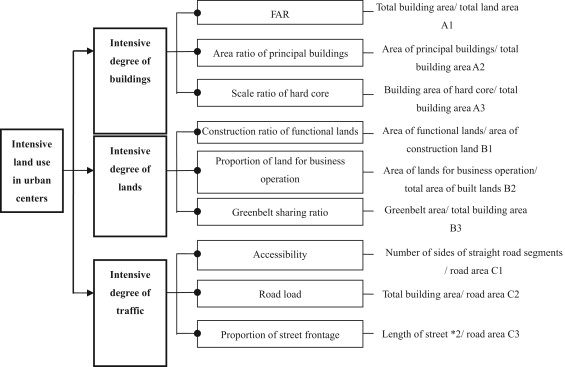
Based on the above analysis, this paper constructed the overall framework of evaluation indices on intensive land use in urban centers, which consists of three status levels, namely intensive degree of buildings, intensive degree of lands, and intensive degree of traffic. Each status level is further broken down into three element levels and given its weight. In turn, the index system of intensive land use is subdivided into nine specific indices (Figure 3 ), which may be quantified by means of both methods of the AHP evaluation model supported by entropy technology and the qualitative index quantification supported by expert scoring. The “classification interval-valued” quantification of indices may be calculated by means of fuzzy membership function (Yang and Wu, 2006 ).
|
|
|
Figure 3. Overall framework of evaluation indices on intensive land use in urban centers. |
After the calculation and analysis of the three basic levels, namely intensive degree of buildings, intensive degree of lands and intensive degree of traffic, the evaluation process of index system on intensive land use in urban centers is developed. The evaluation results on intensive land use in urban centers are obtained by means of data calculation and summarization of nine indices.
5. Application and discussion
Based on the evaluations on intensive land use in urban centers presented in literature at domestic and international levels, we discover that land use in each urban center has certain development characteristics and may be generally classified into the following four types of intensive development by means of data analysis.
5.1. Multi-mode of intensive use in urban centers (spindle shaped)
The multi-mode of intensive use is featured by two of the three basic levels (buildings, lands and traffic ) of intensive use which show the characteristics of intensification, while the remaining level is underused, i.e., not showing proper intensification. For instance, two urban centers—the Central Area and Tsim Sha Tsui in Hong Kong, China—have distinct advantages in terms of intensive degree of buildings and intensive degree of lands. However, they are at a mediate level in terms of intensive degree of traffic. Another example, the Central District of Jianghan Road, Wuhan, is well-reputed for its intensive degree of traffic as well as intensive degree of lands. However, in terms of intensive degree of buildings, it shows mediate level with the spindle shape in the structural chart. In all, these urban centers are intensified in land use as a whole with distinct characteristics. Therefore such mode of intensive use is highly supported in specific evaluation system for intensive land use in urban centers, by far setting the pace for the evaluation results on intensive land use of any other urban centers.
5.2. Single mode of intensive use mode in urban centers (dashed-line-shaped)
The single mode of intensive use indicates that urban centers do not develop comprehensively intensified land use in some regions. Instead, in terms of a specific index, it develops extremely high degree of intensiveness. Except that a couple of indices of intensive use are at average level, other indices are all below average on the evaluation list. Such urban centers usually focus on the development of a specific index. Compared with the overall development mode of other urban centers, such mode of land use may have many constraints breaching the overall development goal of urban centers. In practice, this mode results in excessive land use for specific purpose with inconvenience for traffic network, for example. Therefore, the single mode of intensive use has disadvantages for development (Wang and Shao, 2008 ).
5.3. Balanced mode of intensive use in urban centers (polygon-shaped)
The balanced mode of intensive use is commonly adopted as the land use mode by most urban centers. This mode shows neither prominent single index of intensive land use, nor too many restricted indices. Instead, this mode of land use presents balanced intensive degree, with emphasis on each aspect. Under this balanced mode of intensive use, each index is relatively on an average level, with a polygon structure shown in the structural chart. Take Peoples Square in Shanghai as an example. The structural chart of this mode of intensive use is presented as a rectangle, with its center of gravity placed on the part of intensive use of buildings. The direction of development particularly highlighted in this balanced mode of intensive use is to keep the prominent advantage for further intensiveness of land use in such kinds of urban centers. In other directions, such urban centers will try to realize sustained development in order to conform to the advantaged direction of development. Another example of Beijing Road, an urban center of Guangzhou, shows that the advantage in direction of intensive use of land will be valuable for the renewal of this urban center in an organic manner, leading to focusing on the development of intensive use of buildings and intensive use of traffic in this urban center.
5.4. Low degree mode of intensive use mode in urban centers (shuttle-shaped)
The shuttle-shaped mode of intensive use indicates that urban centers are normally poor-reputed on the nine indices of intensive land use, with a shuttle-shaped structure presented in the structural chart. The shuttle-shaped mode of intensive use is featured by “the advantaged indices are not strong while the disadvantaged indices are extremely weak”. Such urban centers are at mediate level of intensive use of land and fail to realize effectively the intensive use in terms of buildings and traffic due to the restrictions of historical and topographical conditions (Zhu et al., 2009 ).
6. Conclusion
Given the important roles of intensive land use in terms of service functions in urban centers, the evaluation model of intensive land use for urban centers was constructed in order to adapt to the current development with high intensity. Quantitative definition of the scopes of urban centers is conducted and such evaluation factors as spatial form, structural element and service function are introduced. This model can be applied with the support of GIS and with typical central areas in cities of high density in East Asian region as research objects.
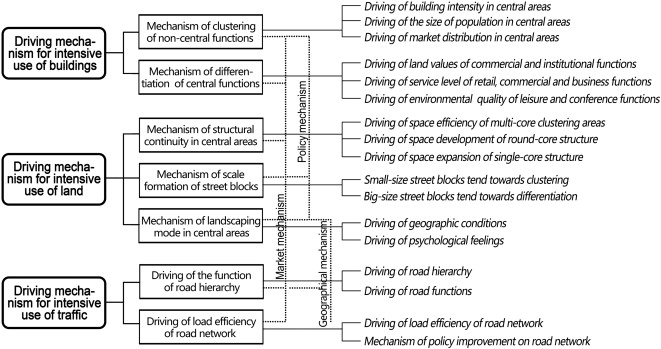
With regard to the driving factors for intensive land use in central areas, our model considers only the most fundamental elements which are positively correlated with evaluation results. However, it has laid foundation for future research for its eurytopicity. Based on the differences presented in evaluation data, it is possible to discuss the specific functions of driving factors for intensive land use. As for the driving mechanisms of intensive land use, it is necessary to further discuss the methods to obtain the optimum evaluation result under market driving mechanism, policy driving mechanism, geographically driving mechanism and their combined operations (Figure 4 ). The emphasis in future work will be on how to develop the established evaluation model of intensive land use for urban centers into regulating and control tools in conceptual design and construction management.
|
|
|
Figure 4. Driving mechanism for intensive land use in urban centers. |
References
- Li et al., 2010 Q. Li, X. Chen, J. Chen; An evacuation risk assessment model for emergency traffic with consideration of urban hazard installations; Chinese Sci. Bull., 55 (10) (2010), pp. 1000–1006
- Wang and Shao, 2008 J. Wang, X.M. Shao; Methodologies of intensive land use research: issues and trend; Progress in Geography, 27 (3) (2008), pp. 68–74
- Wang, 2009 J.G. Wang; A research into the large-scaled spatial forms of cities based on urban design; Science in China Series E: Technological Sciences, 9 (2009), pp. 2486–2496
- Yang and Wu, 2006 J.Y. Yang, M.W. Wu; Suitability index system for the construction of CBD in Chinas cities; City Planning Review (2006), p. 1
- Zhu et al., 2009 T.M. Zhu, G.S. Yang, R.R. Wan; Research progress in the domestic and foreign urban land intensive use quantitative evaluation; Economic Geography, 29 (6) (2009), pp. 977–983
Document information
Published on 12/05/17
Submitted on 12/05/17
Licence: Other
Share this document
Keywords
claim authorship
Are you one of the authors of this document?


