Abstract
In the numerical simulation of shield tunnel, the treatment of joints will greatly affect the accuracy of numerical analysis. Because the stiffness of the joint is lower than the stiffness of segments, the local weakening method is adopted in this paper , which can simulate the stiffness heterogeneity in the transverse and longitudinal directions of the tunnel lining. In the method, lower local stiffness is used for the joint which is the connection between segments and rings of lining, while the stiffness of segments keeps to be unchanged. The local stiffness of the joint, which is represented by the elastic modulus of the joint in the simulation, is the key point. To verify the validity of the method, multiple full-scale experiment [11-14] objects are analyzed and the simulation results are compared to the experiment data. Then the empirical formula of elastic modulus of the weakening joint is proposed by analyzing the three-ring lining in a full-scale experiment under different assemblages. Further, the empirical formula of elastic modulus for the joint is expanded to the large-diameter tunnel and super-large-diameter tunnel. It provides a good reference for the determination of elastic modulus of the joint in the simulation of shield tunnel.
Keywords: Empirical formula, local stiffness, elastic modulus, local weakening, tunnel lining
1. Introduction
With the development of shield technique, the shield tunnel has been widely used in urban subway in China due to its advantages of construction safety, high degree of automation, and applicability to soft soil layers. However, the problems of cracking in segment, joint opening and dislocation between rings are increasing in the tunnel lining under the long-term environmental loads, which seriously affect the sustainability and even the safety of shield tunnel. The damage of the joint will reduce the strength and stiffness of the ring or the whole structure, that is why the simulation of joints in the simulation model is a key point. At present, the main research methods of lining are theoretical calculation, experimental research and numerical simulation. The theoretical calculation is too simplified, neglecting the joints and experimental research is long-period and high cost. Numerical simulation is widely used because of its convenience and various factors being considered.
In the simulation of the lining, there are homogeneous ring model [1], spring model [2-6], refined model [7-8] and so on. The stiffness of rings neglecting the joints is reduced in homogeneous ring model [1], so it is difficult to fully and reasonably reveal the failure mode and mechanism of segments and joints. The spring model mainly includes beam-spring continuous model, beam-joint discontinuous model, shell-joint model etc. [2-4]. The joints in these models are simulated by spring elements with rotation, shear and tensile properties. In the refined simulation, Xie et al. [5] and Yang and Xie [6] used the interface element to deal with the joint between segments, in which the normal stiffness and tangential stiffness of interface element are crucial to reflect the joint behavior. While Liu and Liu [7] and Zhang et al. [8] used solid element to simulate segment, bolts, bolt sleeves, sealing gaskets, etc. Although this method can reproduce the deformation of segment joints more realistically, it is time-consuming and less rings can be considered. Ge et al. [9] regarded the segment as a simply supported beam, and obtained the weakening stiffness and weakening area around it by analyzing the test data. In this method, the vertical displacement and compression deformation of the joint must be measured, which causes it not to be convenient.
In this paper, the local weakening method is used to simulate the joints of segments and rings.The joint width is 6mm according to the waterproof design of the shield tunnel of Shanghai Metro [10]. Based on the mechanical performance test of the segment connection [11] carried out by Dalian University of Technology, a weakening joint model is built by choosing different elastic modulus for the joint, the bearing capacity of the segment and the opening and compression of the joint under the corresponding load are analyzed and compared to the experiment data , then the more suitable elastic modulus of the joint is determined. Subsequently, the weakening method is applied to objects in a single ring full-scale test [12-14] and a three-ring full-scale test [16] to verify whether the method is effective for the simulation of overall mechanical characteristics of the structure, the failure mode of the joint, and the cracking area of the structure. Based on above analysis, an empirical formula of elastic modulus of the weakening joint is proposed, and the reasonable value of elastic modulus in the weakening model of shield lining joint of general tunnel (outer diameter is about 6m), large-diameter tunnel (outer diameter is 10m) and super large-diameter tunnel (outer diameter is 15m) can be obtained, which can provide a reference for the three-dimensional numerical simulation of tunnel lining .
2. Initial determination of elastic modulus of weakening joint
In the simulation calculation, the mechanical performance test of the segment joint which was done by Zhou [11] is used. The weakening range between two segments is 6mm. The elastic modulus of the joint is selected as 50 MPa, 100 MPa, 300 MPa and 500 MPa, respectively. To analyzed the influence of different elastic modulus values on the mechanical properties and damage modes of the segments, compare with the experimental data. Then the appropriate elastic modulus of the joint is determined.
2.1 Introduction of experiment
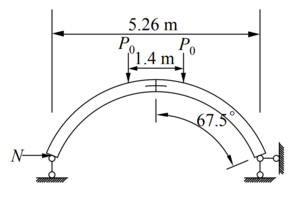
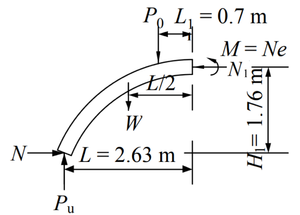
Two full-scale reinforced concrete segments under the action of two vertical equivalent loads on the top are assembled. The horizontal force is applied to the left end of the segment by MST system fixed on the huge reaction wall, and the right end is restrained horizontally by large steel plate base, shown in Figure 1(a).
| ||||
| Figure 1. Two segments including the joint |
The axial force is equal to and opposite to the horizontal force , which is 1500 kN, joint bending moment is kN·m (eccentricity is m). The relationship between vertical load and horizontal axial force is:
|
|
(1) |
In which, is the weight of the segment, , and are shown in Figure 1(b).
2.2 Numerical model
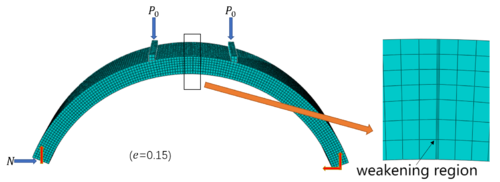
The element C3D8R is used to simulate segments, and the 2-node linear bar element T3D2 is used for the reinforcements in concrete. Neglecting the relative sliding between the steel bar and the concrete. The plastic damage model is used to describe the mechanical properties of concrete of segments, and the elastic model is for the concrete of the weakening joint. The finite element model is shown in Figure 2.
The load is applied to the segment through the loading plate to avoid stress concentration. The axial force is applied to the left end of the segment by defining the surface load, and increases linearly in the simulation process.
|
| Figure 2. Numerical model of two segments including a join |
2.3 result analysis
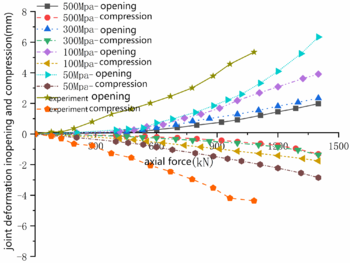
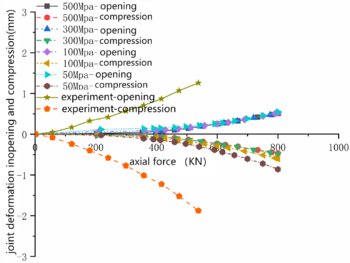
The variation of joint deformation with axial force under positive and negative bending moments are shown in Figure 3, in which there are joint opening curve and joint compression curve. It can be seen that the tendency of joint deformation in opening and in compression coincides with the experiment results. The change of the elastic modulus of the joint under positive bending moment has much more influence on the curve of joint deformation than under negative bending moment, which means that the value of elastic modulus affects the behavior of joint heavily when the joint is in the positive bending moment. From the Figure 3, it is known that the difference between the numerical analysis results and the experiment results is the smallest when the elastic modulus of the joint is 50 MPa.
| ||||
| Figure 3. Joint deformation under positive / negative bending moment |
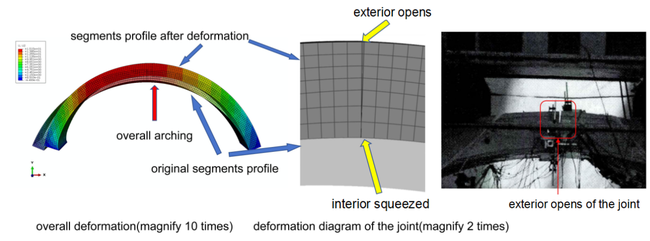
The deformation of the structure and the joint under positive / negative bending moments when the elastic modulus of the joint is 50 MPa is shown in Figure 4. It can be seen from Figure 4(a) that the structural deformation under positive bending moment is dominated by vertical load, which is vertical going downward and horizontal expansion of the structure as a whole. The interior opens and exterior is squeezed, which causes the concrete of the joint is crushed and joint is damaged. In the experiment, the interior opens and concrete of the exterior is crushed, similar to the phenomenon in the simulation results. In Figure 4(b), the structural deformation under negative bending moment is dominated by axial force, which is horizontal compression and vertical going upward as a whole. The interior is squeezed, and the exterior opens.The opening of the exterior is too large to cause the joint to be damaged. Similar results in the experiment are obtained, which is large opening in exterior of the joint and going upward vertically as a whole.
| ||||
| Figure 4. Deformation of the structure and the joint |
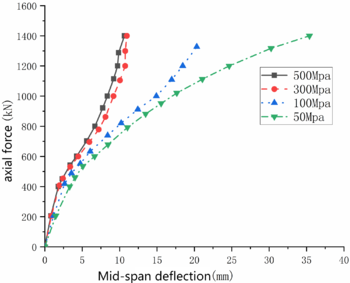
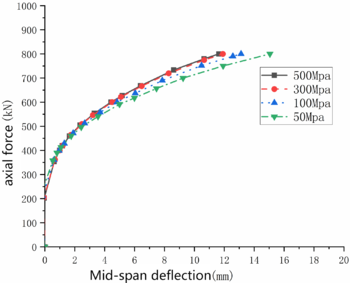
The diagram of mid-span deflection varying with axial force under positive and negative bending moments is shown in Figure 5. From Figure 5(a)it can be seen that the deflection-axial force curves of the joint are almost same when elastic modulus is 500 MPa and 300 MPa, respectively. The tendency of deflection - axial force curves are changed with the decrease of the elastic modulus of the joint. When the elastic modulus of the joint is 50 MPa, the axial force-deflection curve is in good agreement with the deflection-axial force curve obtained in Yang and Xie [6]. Generally speaking, the mid-span deflection increases with the increase of axial force under positive bending moment. It can be seen from Figure 5(b) that the mid-span deflection under negative bending moment is much smaller than that under positive bending moment, and the change of the elastic modulus of the joint has little effect on the deflection–force curve.
| ||||
| Figure 5. Mid-span deflection under positive / negative bending moment |
It can be known that the performance of the joint in the simulation is most similar to the experiment result when the elastic modulus of the joint is 50 MPa from the above analysis. The elastic modulus of the joint in the below single-ring and multi-ring lining will be taken as 50 MPa too.
3. Verification of the applicability of the elastic modulus MPa3. Verification of the applicability of the elastic modulus
E
=
50
{\textstyle E=50}
MPa
Based on the ultimate bearing experiment of the full-scale single-ring lining carried out by Liu et al. [12], Bi et al. [13], Lu et al. [14], and the full-scale three-ring test of shield tunnel lining under the loading and unloading conditions carried out by Liu et al. [15], local weakening analysis models in which joints are weakened are built to analyze the bearing capacity and deformation performance of the single-ring and multi-ring lining.
3.1 Single-ring lining
3.1.1 Numerical model
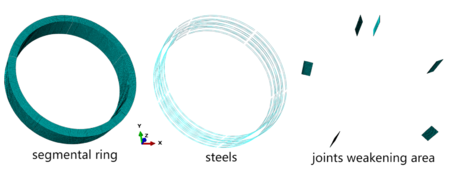
The finite element model of single-ring lining is shown in Figure 6. The joint is simulated by local weakening method, the weakening range is 6 mm, and the elastic modulus of the joint is 50 MPa. In the simulation, the -direction displacement is constrained at the bottom of the loading point. In order to avoid the rigid displacement of the whole, the -direction displacement of the waist, the -direction displacement of the vault and the bottom are constrained.
|
| Figure 6. Numerical model of single-ring lining |
3.1.2 Analysis of results
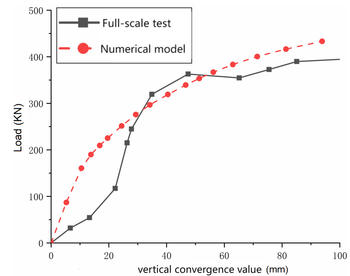
The curve of vertical convergence-load is shown in Figure 7(a). It can be seen that the calculation results are mainly consistent with the experiment results. When the load exceeds 350 KN, there is a large deviation between the simulation and the experiment results. The stiffness of the ring in the experiment is lower than that in the simulation. This is because that the connection of segments in the experiment is destroyed which reduces the stiffness of the whole ring, but the disconnection of the joint can’t be simulated t in the simulation model which means that the stiffness of the ring is not reduced largely.
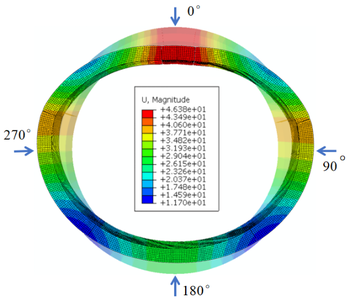
The overall deformation of the single-ring lining structure is shown in Figure 7(b), which is horizontal ellipse deformation shape. The vault and the bottom deform to the inside, and the deformation of the vault to the inside is heavier than the deformation of the bottom to the inside, which coincides with the test results. The reason is that the size of segment in the vault is small, the stiffness due to the existence of weak connection in the joint is smaller than that of the bottom, so the deformation of the vault is larger than that of the bottom. Both waists in the left and right arch deform outward. The simulation results show that the convergence of the left and right waists is almost the same, while the deformation of the left waist is greater than that of the right waist in the experiment. The stiffness of the lining ring is symmetrical, and the load is also symmetrically distributed, so the simulation results are reasonable. In the experiment, the deformation of the left and right haunches isn’t same due to various factors such as bolts etc, which also shows that the test results are affected by many factors.
| ||||
| Figure 7. Vertical convergence-load curve and deformation diagram (deformation magnified 10 times) |
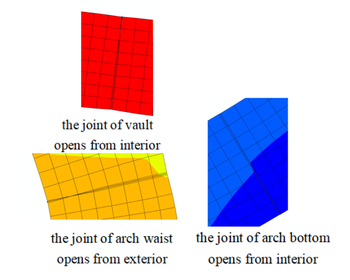
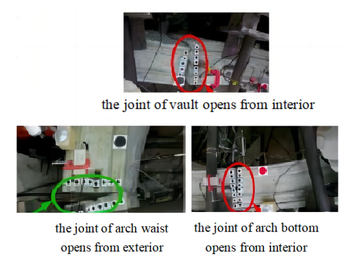
Figure 8 shows the deformation of the joints in the simulation and in the experiment, respectively. In the numerical simulation, the deformation of the joint on the left and right sides shows a high degree of symmetry, and the vault joints (at 8° and 352°) open from the interior, the waist joints (at 73° and 287°) open from the exterior, the bottom joints (at 138° and 222°) open from the interior and stagger a little bit simultaneously. In the experiment, the joints of vault and arch bottom open from interior, and the joints of arch waist open from exterior. It can be seen that the simulation and test results of joint deformation are mainly consistent, and there is only a little difference in the deformation of arch bottom joint.
| ||||
| Figure 8. Joint deformation in the simulation and experiment |
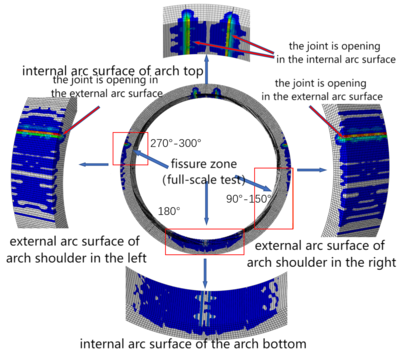
Figure 9 is the distribution of the cracking area of the segment. From the figure, it can be seen that the cracking area is mainly concentrated in the interior of vault and bottom and the exterior of the arch waists, and there is almost no plastic strain at the arch shoulder. Among them, the vault joint opens from the interior and the haunch joint opens from the exterior. In the experiment, the cracks on the exterior are mainly concentrated near 90°/150°/270°/300° of the ring; the cracks on the interior are concentrated near 180° of the arch bottom. The simulation results of the cracking area are almost consistent with the experiment.
In the experiment, the concrete is crushed and some falls down from the interior of joint at about 73°/287° and from the exterior of joint at about 222°/352° because of compression. But there is no crushed concrete in the simulation. So the simplified weakening joint model can not simulate the crushed concrete well.
|
| Figure 9. Distribution of cracking area of segment |
3.2 Verification of three-rings lining
3.2.1 Numerical model
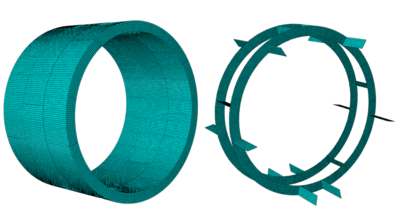
The finite element model of the full-scale three-ring experiment is shown in Figure 10. In order to decrease the influence of boundary effect, the rings are all full-width rings, so as to analyze the bearing capacity and deformation of each ring better. The longitudinal joint between segments and the circumferential joint between rings are all simulated by weakening joint. The boundary conditions are the same as those of the single ring lining.
|
| Figure 10. Numerical model of three-ring lining |
3.2.2 Analysis of results
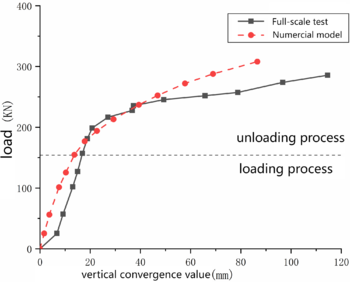
The curve of vertical convergence-load of the middle ring is shown in Figure 11. At the end of the loading, the vertical convergence value in the simulation is 13.70 mm, and the experiment result is 17.4 mm. When the load reaches 214 kN, the circumferential joint fails in the test and the vertical convergence is 26.36 mm, the simulation result is 29.3 mm. In general, the load-vertical convergence value curve obtained in the simulation is in good agreement with the curve in the test.
|
| Figure 11. Vertical convergence value-load curve |
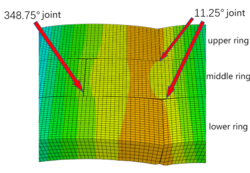
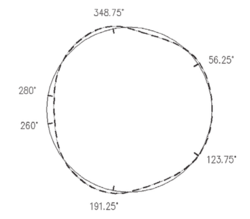
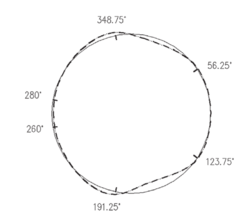
Figure 12 shows the dislocation of circumferential joint between two adjacent rings, in which the solid line is the middle ring, dashed line is the upper ring/lower ring. It can be seen from Figure 12(a) that the dislocation is mainly near the 348.75° joint in the middle ring and near the 11.25° joint in the upper and lower rings. In the experiment, circumferential joint dislocation is at 260°/348.75°/11.25° between upper ring and the middle ring. Dislocation is at 348.75°/11.25°/168.75° between the lower ring and in the middle ring.
In summary, the bearing capacity, deformation of circumferential joint and longitudinal joint, cracking area distribution of single-ring and three-rings lining are roughly consistent with the experiment when the joint is simulated by local weakening method, which means that the local weakening method is effective to simulate the joint in the lining.
| ||||||
| Figure 12. Dislocation of circumferential joint |
4. Empirical formula of the elastic modulus for weakening joint
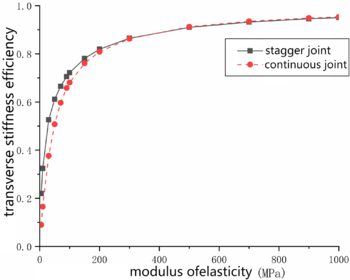
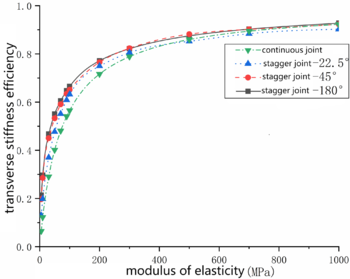
In the simulation of single-ring and three-rings lining, the elastic modulus of the joint is 50 MPa. Although the bearing capacity, deformation of joint are basically consistent with the experiment results, there are still some differences. And the stiffness of the tunnel lining is related to the type of assemblage too, we try to find an empirical formula of the elastic modulus for the weakening joint no matter how the lining is assembled. Considering the transverse stiffness efficiency reflects the influence of joint stiffness on the lining ring stiffness, the formula of elastic modulus to the transverse stiffness efficiency is found, which can provide a good reference on the determination of elastic modulus for the joint weakening simulation. Taking the three-rings lining as the research object, the relationship between the transverse stiffness efficiency and the elastic modulus of the joint under the four different assemblages which are straight joint, stagger joint-22.5°, stagger joint-45° and stagger joint-180° is analyzed, as shown in Figure 13. It can be seen that the elastic modulus varies nonlinearly with the transverse stiffness efficiency. The curve is fitted by exponential function, that is :
|
|
(2) |
where, , , and are constants; is the elastic modulus of the joint; is the transverse stiffness efficiency. The constant values , , and in Eq.(2) are given in Table 1.
|
| Figure 13. Elastic modulus -transverse stiffness efficiency under different assemblages |
| Assembling mode | Transverse stiffness efficiency | ||||||||
|---|---|---|---|---|---|---|---|---|---|
| 0.2-0.5 | 0.5-0.8 | 0.8-0.9 | |||||||
| Continuous joint | 16.3 | 0.291 | -14.623 | 0.47 | 0.125 | 53.606 | 2.06E-04 | 0.061 | 215.916 |
| Stragger-22.5° | 10.91 | 0.272 | -12.56 | 0.403 | 0.124 | 33.975 | 1.34E-06 | 0.045 | 222.36 |
| Stragger-45° | 2.35 | 0.172 | -2.393 | 1.045 | 0.146 | 9.597 | 2.29E-06 | 0.047 | 183.59 |
| Stragger-180° | 2.28 | 0.175 | -2.56 | 0.458 | 0.128 | 15.63 | 1.59E-04 | 0.06 | 144.36 |
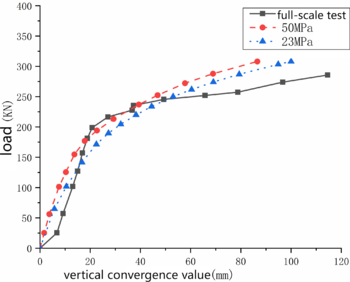
In the above three-rings lining simulation, the elastic modulus of the joint is 50 MPa. According to the deformation in the experiment and the simulated homogeneous ring, the transverse stiffness efficiency is about 0.43. The elastic modulus of the joint should be 23 MPa calculated from Eq.(2). A new model with 23 MPa weakening joint is built again for the same three-rings lining. The vertical convergence-load curve is shown in Figure 14. It can be seen that the model built according to the value of calculated by Eq.(2) is more consistent with the experiment results than the former model in the elastic period and the elastic-plastic stage after the lining joint fails. In the failure stage of the joint, there is a bigger difference between the simulation and the experiment. The reason is that the transverse stiffness efficiency depends on the deformation value in the elastic period. In general, when the elastic modulus of the joint in three-ring lining joint is adjusted to 23 MPa, the simulation results are closer to the test results than the former elastic modulus 50 MPa, which means that the above formula is good for the determination of elastic modulus of the joint.
|
| Figure 14. Vertical convergence-load curve |
Taking different tunnel linings as research objects (Table 2), the elastic modulus of joints is calculated from Eq.(2), in which , , and are determined in Table 1, and in Table 2 is the theoretical value of the transverse stiffness efficiency of the tunnel lining. The transverse stiffness efficiency of the joint being weakened is obtained by numerical simulation and compared with . It can be seen that the simulated transverse stiffness efficiency based on the elastic modulus in Eq.(2) is almost same as the transverse stiffness efficiency , most of the relative error is lower than 5%. The empirical formula, Eq.(2), is suitable for the determination of elastic modulus of the joint when it is weakened in the simulation of the general tunnel lining whose outer diameter is about 6 m.
| Source | Assembling mode | Dimension (mm) | Segments | Transverse stiffness efficiency | Elastic modulus (MPa) | Transverse stiffness efficiency | *100% |
|---|---|---|---|---|---|---|---|
| Ref. [17] | Continuous joint | Outer diameter 6200, thickness 350, ring width 1000. | 22.5°+5*67.5° | 0.67 | 153.58 | 0.68 | 1.49% |
| Stagger-22.5° | 0.75 | 204.62 | 0.79 | 5.33% | |||
| Ref. [18] | Continuous joint | Outer diameter 6000, thickness 300, ring width 1500. | 20.4°+2*61.8°+3*72° | 0.65 | 138.80 | 0.682 | 4.9% |
| Stragger-22.5° | 0.786 | 262.09 | 0.821 | 4.32% | |||
| Ref. [19] | Stragger-45°< | Outer diameter 6200, thickness 350, ring width 1250. | 16°+4*65°+84° | 0.73 | 164.69 | 0.741 | 1.37% |
| Ref. [20] | Continuous joint | Outer diameter 6000, thickness 300, ring width 1500. | 15°+2*64.5°+3*72° | 0.7 | 180 | 0.68 | 2.85% |
| Stragger-36° | 0.6 | 73.26 | 0.58 | 3.33% |
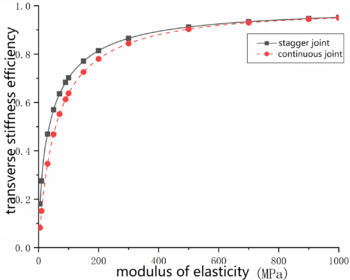
Using the same method to analyze the Shiziyang Tunnel [21] whose outer diameter is 10m and the Shanghai Riverside Channel Project [22], whose outer diameter is 15m, the relationships between the transverse stiffness efficiency and the joint elastic modulus of the large-diameter tunnel (10 m) and the super-large-diameter tunnel (15m) under different assemblages are obtained. The calculation results are shown in Figure 15, and the parameters , , and in Eq.(2) are given in Table 3, which provides a reference for the joint elastic modulus value of the local weakening model in the numerical simulation of large-diameter and super-large-diameter shield tunnels.
| ||||
| Figure 15. Relationship between transverse stiffness efficiency and joint elastic modulus |
| Tunnel type | Assembling mode | Transverse stiffness efficiency | ||||||||
|---|---|---|---|---|---|---|---|---|---|---|
| 0.2-0.5 | 0.5-0.8 | 0.8-0.9 | ||||||||
| Large -diameter tunnel (10m) | Continuous joint | 15.95 | 0.360 | -15.386 | 0.619 | 0.144 | 29.978 | 3.73E-04 | 0.066 | 121.25 |
| Stragger-180° | 2.715 | 0.211 | -2.674 | 0.499 | 0.137 | 6.153 | 4.66E-05 | 0.057 | 114.54 | |
| Super-large- diameter tunnel (15m) | Continuous joint | 14.142 | 0.312 | -13.176 | 0.769 | 0.144 | 33.869 | 1.99E-04 | 0.063 | 153.90 |
| Stragger-180° | 3.935 | 0.217 | -3.999 | 0.749 | 0.148 | 13.337 | 3.38E-05 | 0.056 | 126.325 | |
5. Conclusions
Taking full-scale two segments including longitudinal joint of the experiment as the research object, the local weakening method is used to simulate the uneven stiffness caused by the connection between segments. By comparing the simulation results with the test results, the appropriate elastic modulus of the joint which is lower than the segment is selected, that is the weakening on the stiffness of the joint. Then, the full-scale single-ring lining structure and a three-rings lining structure of experiments are analyzed, in which the local weakening method is used to simulate the joint between segments and rings, and the numerical simulation results are compared with the test to verify the applicability of the method in the simulation of whole ring structure. Finally, the empirical formula for the determination of elastic modulus of the weakening joints in lining ring under different assemblage for different tunnel linings are given. The following conclusions are drawn:
(1) The varying of elastic modulus of the joint affects the deformation of the joint under positive bending moment, but has little influence on the deformation of the connection under negative bending moment. When the elastic modulus is 50 MPa, the simulation results agree with the experiment results well.
(2) In the analysis of the full-scale sing-ring lining and three-rings lining using the local weakening method, it is found that the weakening method has high effectiveness for the simulation of the joints in Shanghai typical tunnel lining. But the elastic modulus isn't unchanged 50 MPa. The elastic modulus is affected by the assemblages of the tunnel lining.
(3) According to the relationship between the transverse stiffness efficiency and the elastic modulus , the empirical formula of the elastic modulus is given, which can provide a reference for the determination of the elastic modulus of the weakening joint not only in the general tunnel lining (outer diameter is about 6 m) but in the large-diameter (outer diameter is 10 m) and super-large-diameter (outer diameter is 15 m) tunnel lining.
Acknowledgement
| This research was supported by National Natural Science Foundation of China (grant number: 52378419). |
References
[1] Standard specification for tunnels (shield) and explanations. The Institution of Civil Engineers, Japan, 2001.
[2] Zhu H.H., Yang L.D., Chen Q.J., et al. Two force design models for the lining system of tubular joints in shield tunnels.Proceedings of the Fifth National Academic Conference on Structural Engineering. Tsinghua Publishing Press, 400-404, 1996.
[3] Zhu H.H, Cui M.Y., Yang J.S. Design model for shield lining segments and distribution of load. Chinese Journal of Geotechnical Engineering, 22(2):190-194, 2000.
[4] Peng Y.C., Ding W.Q, Zhu H.H., Zhao W., Jin Y.L. Shell-joint model for lining structures of shield-driven tunnels. Chinese Journal of Geotechnical Engineering, 35(10):1823-1829, 2013.
[5] Xie J.C., Wang J.C, Huang W.M. Nonlinear structural analysis on cracking behavior of shield tunnel segment under surface loading. Journal of Railway Science and Engineering, 18(01):162-171, 2021.
[6] Yang Y.B., Xie X.Y. Breaking mechanism of segmented lining in shield tunnel based on fracture mechanics. Chinese Journal of Rock Mechanics and Engineering, 34(10):2114-2124, 2015.
[7] Liu H.Q., Liu H.B. Numerical investigation on the mechanical behaviour of shield tunnel segment and their longitudinal joint. Chinese Journal of Underground Space Engineering, 15(06):1800-1810+1873, 2019.
[8] Zhang L., Feng K., He C., et al. Three-dimensional refined numerical simulation of segmental joint of shield tunnel. Tunnel Construction, 40(8):1169, 2020.
[9] Ge S.P., Xie D.W., Ding W.Q., Ouyang W.b. Simplified numerical simulation method for segment joints of shield tunnels. Chinese Journal of Geotechnical Engineering, 35(09):1600-1605, 2013.
[10] Science and Technology Committee of Shanghai Municipal Construction Commission. Metro Line 1 Project. Shanghai Science and Technology Press, 1998.
[11] Zhou H.Y. Theoretical study and test on the mechanical behavior of lining segment in shield tunnel. Dalian University of Technology, 2011.
[12] Liu X., Zhang H.l., Lu L., Wang X.Z. Experimental study on loade bearing capacity of shield tunnel structure under overload condition (in Chinese). Underground Engineering and Tunnels, (04):10-15+59, 2013.
[13] Bi X.l., Liu X., Wang X.Z., Lu L., Yang Z.H. Experimental investigation on the ultimate bearing capacity of continuous-jointed segmental tunnel linings. China Civil Engineering Journal, 47(10):117-127, 2014.
[14] Lu L., Sun Y.F, Liu X., Wang X.Z., Wang W.P. Full-ring experimental study on the ultimate bearing capacity of the lining structure of the metro shield tunnel. Structural Engineers, 28(06):134-139+180, 2012.
[15] Liu X., Dong Z.B., Bai Y., et al. Investigation of the structural effect induced by stagger joints in segmental tunnel linings: First results from full-scale ring tests. Tunnelling and Underground Space Technology, 66(1):1-18, 2017.
[16] Li Q.T. Numerical modeling analysis of structural defects of shield tunnel in soft soil area. Railway Standard Design, 65(01):95-103, 2021.
[17] Huang H.W., Xu L., Yan J.L., Yu Z.K. Study on transverse effective rigidity ratio of shield tunnels. Chinese Journal of Geotechnical Engineering, (01):11-18, 2006.
[18] Wang T., Mo H.h., Chen J.S, Yang C.S. The impact of staggered joint and soil stiffness on transverse effective rigidity ratio of shield tunnel. Railway Standard Design, 59(09):136-140, 2015.
[19] Yang X., Luo Y.P, Zhang Z.B., Wang Z.Y. A model-test-based study of the anti-bending effectiveness of the longitudinal and transverse rigidity of shield-drilled tunnels. Traffic Engineering and Technology for National Defence, 18(04):39-42, 2020.
[20] Chen H.C. Study on transverse mechanical behavior of shield tunnel based on model tests and its application in surface surcharge, South China University of Technology, 2020.
[21] Li X.J, Huang B.Q., Yang Z.H., Li X.X. Lateral equivalent stiffness of large diameter shield tunnel lining structure at various buried depths. Journal of Tongji University (Natural Science), 43(08):1159-1166, 2015.
[22] Feng K., He C., Xia S.L. Prototype tests on effective bending rigidity ratios of segmental lining structure for shield tunnel with large cross-section. Chinese Journal of Geotechnical Engineering, 33(11):1750-1758, 2011.Document information
Published on 09/04/24
Accepted on 20/03/24
Submitted on 04/01/24
Volume 40, Issue 2, 2024
DOI: 10.23967/j.rimni.2024.03.005
Licence: CC BY-NC-SA license
Share this document
Keywords
claim authorship
Are you one of the authors of this document?
