Abstract
In this short communication, we present a method which utilizes contactless ILIT (illuminated lock-in thermography) measurement of a photovoltaic (PV) module and image postprocessing in order to calculate the peak power Pmpp of the module and to study the influence of local defects on the module performance. In total, 103 Copper-Indium-Gallium-Diselenide (CIGS) modules were investigated and the results showed a good correlation (mean error less than 6%) between the calculated IR-signal and the measured Pmpp. We performed our study on CIGS modules but the presented approach is not restricted to CIGS modules. The method provides a valuable tool for PV quality control.
Introduction
The market for photovoltaic (PV) modules has been growing within the last few decades. The worldwide production of modules per year has been increasing from 2 MW in 1975 to several hundred megawatts in the early 2000s to 24 GW in 2010 [1]. This trend is believed to continue at least for the next few years [2]. Standard crystalline silicon-based PV holds by far the biggest market share. Within the last few years, however, commercial production of thin film PV modules, such as amorphous silicon, Cadmium-Telluride, and Copper-Indium-Gallium-Diselenide (CIGS), has been established with about 13% of the annual produced power in 2010 [3]. In any case, all PV modules may show defects, which are either induced during the production or during the application in the field. These defects generally reduce the module performance. Accordingly, quality control tools, most importantly flashers, are crucial tools in PV factories but also for after sales quality checks.
This article will discuss infra red (IR) imaging as an additional tool to assess the performance of PV modules. Compared with flasher data, IR imaging provides the advantage of spatially resolved data that enables a localization of the defects on the module and a successive investigation of certain defects with appropriate characterization methods such as energy-dispersive X-ray spectroscopy (EDX). Furthermore, in case of illuminated infrared measurements (excitation of the solar cell by a light source), the module can be tested without electrical contacting [4]. Accordingly, IR-measurements may easily be incorporated for in-line quality control on a very early stage of the production line (e.g., for CIGS solar cells directly after evaporating the layers). However, IR-measurements can also be carried out easily in the field, which makes it a promising candidate as an after-sale inspection tool [5-7].
We have chosen CIGS modules for testing a pragmatic approach to use IR-imaging as a quality control tool in particular for in-line quality assessment. The performance of CIGS modules, definitely one of the most promising thin film technologies [8], has steadily increased. Efficiencies of over 20% for cells, 17% for submodules, and 15% for conventional modules prove the potential of CIGS as a beneficial material for thin film PV [9, 10]. For the IR-measurements, we applied the lock-in technique in order to increase the signal to noise ratio. The theory of lock-in thermography (LIT) can be reviewed in the book of Breitenstein et al. [11]. We applied illuminated LIT (ILIT) measurements for our study. ILIT studies have been performed, for example, to determine information such as power losses under normal operating conditions [4] or series resistance [12, 13]. However, no study has been carried out which specifically investigates the use of ILIT-imaging as a quality control tool. We studied a sufficiently large number of CIGS test modules with the aim of determining the peak power of each module by an ILIT-image of the module.
Experimental Procedures
We used an Equus 327k SM IR-camera (IRCAM GmbH, Erlangen, Germany) for the ILIT measurements. The camera and the sample were placed in an opaque measurement box. The camera is equipped with an InSb (indium antimonite) focal plane array (FPA) detector (640 × 512 pixels) cooled by a Stirling motor. The mounted lens is transmissive in the short and midinfrared range (2–5 μm). The noise equivalent temperature difference (NETD) of this camera is lower than 20 mK. The frame rate was of about 120 Hz at the applied spatial resolution; for details of ILIT measurements please refer to other work from our group, for example, Bachmann et al. [14]. We used 16 chip on board white light (440–780 nm) LEDs (Citizen Electronics Co., Ltd.) for illuminating the samples. Each LED has an electrical power of 7 W and four LEDs were mounted on four aluminum blocks (1.5 × 7 × 9 cm3). These blocks were cooled by water (20°C) provided by a thermostat to maintain the LED temperature constant during operation. The LEDs illuminated an area of 40 × 40 cm at a power of 30 W/m² (light intensity varied within ±6%).
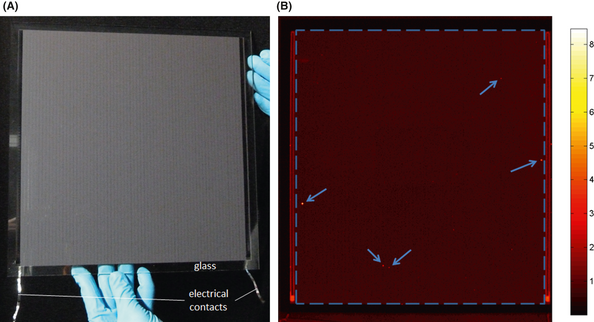
We investigated 103 CIGS (30 × 30 cm2) thin film solar modules each consisting of 67 in series connected cells (Fig. 1A). The cells are separated by patterning lines which were induced by industrial scribing processes. The back contact is molybdenum sputtered on a soda-lime-silicate glass (3-mm thick). The CIGS layer is co-evaporated and CdS serves as buffer layer. The window consists of ZnO and ZnO:Al as front contact. The deposited layers on the glass substrate are in total about 3-μm thick. Further details can be found in [15].
|
|
|
Figure 1. (A) Picture of a CIGS test module (30 × 30 cm) consisting of 67 cells (vertical lines) connected in series. Each cell has a width of about 4 mm. (B) Amplitude image of an ILIT measurement (120 sec, 1 Hz) showing some hot spots (the five defects with the highest amplitude signal are indicated by the arrows). |
The ILIT measurements were performed under open circuit conditions (ILIT-Voc) at room temperature with low light illumination (30 W/m2). Defects can most easily be identified in ILIT under open circuit conditions. For CIGS solar cells, the effect of shunts are generally more pronounced under low light. Furthermore, ILIT-Voc measurements do not need any electrical contacting which allows very early measurements within the production steps. Finally, ILIT measurements are closer to normal operating conditions compared to dark LIT (DLIT) measurements [4].
The ILIT measurements presented in this article were carried out at a frequency of 1 Hz. At this frequency, the defects could be clearly identified. Higher frequencies (e.g., 10 Hz) yield low IR-signals which require an increase in measurement time. Lower frequencies (e.g., 0.1 Hz) result in higher IR-signals but also a “blurring” of the IR-images due to thermal heat diffusion. In order to determine the minimal measurement time required for reasonable results, we conducted four successive measurements with measurement times of 1 sec, 30 sec, 1 min, and 2 min. In between each measurement, there was an idling time to let the sample thermally equilibrate. After recording the ILIT measurements, we performed an IV-curve measurement at the same illumination (30 W/m2) with an SMU (Agilent, Singapore, SMU B2901).
Data Processing
The recorded ILIT-images were postprocessed by a house written MATLAB (The Mathworks Inc., V 7.13) code. First, automatic defect detection was carried out to identify defected areas. This was realized by quantile thresholding (eq. (1)), with S the ILIT-signal matrix (ILIT-image), Sdef as the matrix containing the pixels of defects, Sq the quantile matrix of S, and a, the quantile threshold.
|
|
(1) |
Electrical simulations with SPICE indicated that shunts on and close to the patterning lines (“patterning line region”) can result in larger power losses compared with shunts in the center of the cell. These power losses reduce Pmpp and may be underestimated by an ILIT-Voc image (data not shown). In shunted cells, circular current paths occur, which do not contribute to the output power of a solar cell. These circular paths start with free electron separation in the semiconductor. From there, they go to the back contact, through the shunt and return via the front contact to their location of origin. On this whole way, the current has to overcome an effective resistance consisting of the shunt resistance and the resistances along the two contact electrodes. Generally, the higher this effective resistance is the lower is the influence of the shunt on the module performance. The cells are monolithically series connected in our samples. Therefore, the circular shunt currents can also spread over the neighbor electrode and the effective shunt resistance will vary depending on its geometrical position in the cell.
We weighted the ILIT-Voc pixels of the patterning line region to test this simulational result. The influence of the defect position on Pmpp is probably complex. Defects on one side of a patterning line may be more detrimental than defects on the other side. Also the influence of the defect distance to the patterning line remains unknown. This study only aims to lead a proof of concept. Accordingly, we estimated the patterning region as simple as possible (half of the cell areas). We manually marked the patterning line region resulting in a binary mask for each module. The approach yielded weighted defects Sdef,w (eq. (2)), with the weighting factor g (g equals 1 represents the original, unweighted ILIT-image).
|
|
(2) |
Next, an IR-parameter was calculated for each ILIT image. Breitenstein et al. [11] suggest the “Proportionality Method” to calculate the dissipation power for distributed defects (eq. (3)). Equation (3) contains the ratio of the mean IR-signal of the defects to the mean IR-signal of the whole sample, the ratio of the defect versus the whole area Adef/Awhole and the power of the whole sample (Pwhole).
|
|
(3) |
The mentioned proportionality method requires an IR-signal at a phase position close to −90° (S−90°) for wafer-type cells and S−45° for thin films on substrates. However, the phase shift depends on the thermal properties and the geometry of the sample. Accordingly, we tested different signals (S−0°, S−45°, S−90°, and the amplitude signal). Furthermore, we applied the weighted defect matrix Sdef,w for our calculations. In our case, when applying ILIT-Voc measurements, Pwhole or the power of the modules equals the illumination power (energy conversation). The illumination power did not change, so we used the ratio of defect to sample dissipation power, X (eq. (4)), as IR-parameter for a correlation with Pmpp.
|
|
(4) |
Asum,def denotes the total area of the defects and Amodule the area of the module. An exemplary calculation is given for the sample displayed in Figure 1. Five defects (high IR-radiation), indicated by arrows in Figure 1B, result in a total signal of 92.3. The mean signal of the module is 0.433. The area of defect pixels in this basic example is only 26 pixels (pixels of module close to 200,000), which yields a X of about 2.8 × 10⁻².
Finally, the IR-Parameter X was correlated with the measured peak power Pmpp determined by IV-curves. The dependency of Pmpp on the IR-signal should ideally be linear in terms of a simple application of the presented method as a quality control system. The goodness of fit was quantified by the coefficient R2 (eq. (5)), with i as the index of the sample and the subscript “cal” denoting calculated values and “meas” measured values.
|
|
(5) |
Results
The presented method requires two image processing parameters: a, which defines the pixels representing defect cell areas, and g, the weighting factor of defects lying within the patterning line region. We varied the parameters in a comprehensive parameter study. Parameter a was varied between 0.85 and 0.995 and parameter g between 0 and 10. Additionally, we investigated four different signals (S0°, S−45°, S−90°, and the amplitude image).
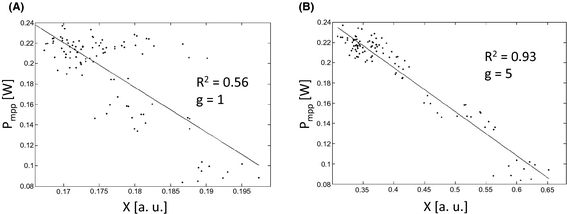
Figure 2A shows the best correlation between the IR-parameter X (eq. 4), determined from unweighted ILIT images and the measured peak power (both measurements carried out at 30 W/m2 illumination). The best correlation (linear fit with the smallest R2) was found when using S0° images for calculating X. Only a poor correlation (R2 = 0.56) was possible without weighting the defects. The goodness of fit was rather independent of the intermediate quantile threshold a (see also next section, Fig. 3A).
|
|
|
Figure 2. Correlation (linear fit, solid line) between measured peak power (dots) and ILIT-parameter X (eq. 4) for 103 modules. Peak power and ILIT-image were measured under the same low light conditions (30 W/m2). The measurement time of the ILIT images (S0°) was 2 min at 1 Hz frequency. (A) The correlation for the data without any weighting of certain regions of the ILIT images. (B) The correlation with weighting of the pixels on and next to the patterning lines (in total about 50% of the cells' area) with a weighting factor of 5. |
|
|
|
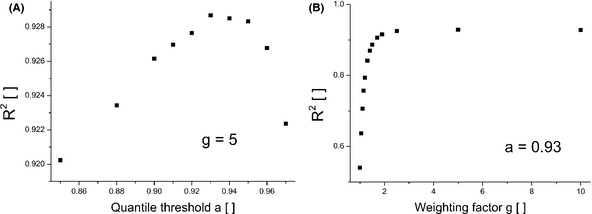
Figure 3. Goodness of fits (defined by norm of the residuals, eq. 4) depending on the quantile threshold a (A) and the weighting factor g (B). The data stem from S0° images with weighting around 50% of the cells' area around the patterning lines. |
The correlation was strongly improved when enabling a weighting of the pixels around the patterning lines (patterning line area). The best correlation was again found for S0° images (R2 = 0.93) for a quantile threshold, a, of 0.93, and a weighting factor, g, of 5 (Fig. 2B). The mean difference between calculated Pmpp and measured Pmpp was about 5.3%. Very similar correlations (R2 between 0.90 and 0.92) were possible for all other investigated signals (S−45°, S−90°, and the amplitude image) when applying weighting of the pixels of the patterning line area. We will focus on presenting the results for S0° in order to keep the length of the manuscript short.
Next, we will investigate the influence of the parameters a and g on the goodness of linear fits. To do so, we leave one of the two parameters fixed while varying the other one. As starting values we choose the parameter values, which yielded the best result (a = 0.93, g = 5). Figure 3A displays the dependency of R2 on the quantile threshold with a maximum for R2 at a = 0.93. As for the unweighted image, the influence of the quantile threshold parameter was small for moderate values of a (0.9–0.97) yielding good fits (R2 > 0.9). For very high threshold values (a ≥ 0.99), the goodness of fits dropped strongly (R2 ≤ 0.8).
Figure 3B shows R2 depending on g for S0°-ILIT images with the above quantile threshold, a = 0.93. The goodness of fit strongly decreases with no (g = 1) or small weighting of the pixels of the patterning line area. There, the maximum is rather unpronounced (R2 = 0.92867) at g = 5. When weighting with a factor of 1000, R2 dropped only to 0.89482. This indicates that the defect intensity of the patterning line region is the most important information when aiming for a linear dependency between an IR-signal of an ILIT-Voc image and the peak power. We checked this by applying the summarized intensity of the defects within the patterning line region as IR-parameter instead of parameter X (eq. 4). As assumed, that approach yielded the same fit (R2 = 0.89482) as found when applying equation (4) with a large weighting factor (g = 1000). Accordingly, most of the possible linearization is due to the defect intensity of the patterning line region. We point out that this particular result may be restricted to the employed CIGS modules.
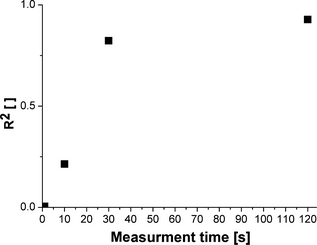
Finally, we will consider the required measurement time. In Figure 4, R2 is plotted over the measurement time for utilizing S−0° images with a = 0.93 and g = 5. A measurement time of 1 sec was not sufficient to predict the peak power of the module. A steep increase in the goodness of fit can be seen when increasing the measurement time from 10 to 30 sec while a measurement time of 120 sec did not strongly improve the fit. The optimal measurement time (for a fast but precise peak power calculation) would be in between 30 sec and 2 min.
|
|
|
Figure 4. Goodness of fit depending on the measurement time (S0° images). The image postprocessing parameters were as follows: a = 0.93 and g = 5. |
Summary and Discussion
An ILIT study with 103 CIGS modules (30 × 30 cm) was performed and the results showed a good correlation (mean error less than 6%) between the calculated IR-signal (eq. 4) and the peak power Pmpp of the module. The required measurement time was about 30 sec. The proposed method works for “normal” defects or shunts. In case of shunts completely short cutting a cell, the cell voltage would get zero and, therefore, the shunt would not dissipate a detectable IR-signal. Such a defect or cell, respectively, can easily be identified by viewing the IR-images. In this study, we did not find any such defects. To localize defects, we chose quantile thresholding for defect detection. This is a simple, fast, and robust algorithm and, accordingly, an appealing method for in-line quality control. However, also other ways of identifying the defects could be applied (e.g., by analyzing the phase image).
Weighting defects close by patterning lines was crucial for a good correlation. There may be several reasons why this weighting improves the correlation. The weighting may counterbalance lower emissivity of certain defects (we assumed homogeneous emissivity for this study to keep the method simple). Emissivity measurements in our lab, however, revealed a variation in the defect emissivity of around 20% (data not shown). Furthermore, simulations indicated that defects close to patterning lines may result in a large power loss which may be underestimated by the ILIT-Voc image. Finally, we specifically aimed for a linear dependency between the IR-parameter and Pmpp. The presented weighting seems to be an appropriate way to calibrate the IR-results in such a way to predict Pmpp by a linear dependency.
The mean error of the calculated Pmpp may be due to several limitations. The weighting algorithm was kept basic as this study was designed as a proof of concept. We only tested weighting about half of the cells' areas with a factor which we varied in a parameter study. A further study should also test a gradual decrease in the weighting factor the farther away the defect is from the closest patterning line. Furthermore, the spatial resolution of our IR-measurements was about 0.6 mm/pixel (resulting in 6–7 pixels per cell), which could be improved by applying more than one IR-camera. Finally, the homogeneity of the illumination was good (about ±6% variation in intensity) but still may play a limiting factor for determining Pmpp more precisely.
In summary, we presented a method which utilizes contactless ILIT measurements and rather basic image postprocessing to derive Pmpp as an important quality control parameter. We performed our study on CIGS modules but the presented approach is not restricted to CIGS modules. Also the method can be optimized in regard to data acquisition and image postprocessing (yielding higher accuracy and reduced measurement time). The presented approach provides the basic ideas of applying IR-measurements as a valuable tool for PV quality control. Compared to flasher data, IR-measurements provide spatial information that means the localization of defects. Accordingly, sophisticated IR-imaging and successive data analysis may also strongly facilitate the classification of different defect types. That classification, in turn, is an important piece of information for successive enhancement of the efficiency of PV modules.
Acknowledgments
The authors thank the German Federal Ministry for the Environment, Nature Conservation, and Nuclear Safety for funding (FKZ 0325149A).
Conflict of Interest
None declared.
References
- Earth Policy Institute. 2011. World solar photovoltaics production, 1975–2010. Earth Policy Institute (EPI), Washington, DC.
- IMS. 2011. PV demand database – Quarterly – Q3'11. IMS Research, Wellingborough.
- PV News. 2011. 27th annual global data collection for PV cells and modules. PV News, GTM Research, Cambridge, MA.
- Isenberg, J.2004. Realistic evaluation of power losses in solar cells by using thermographic methods. J. Appl. Phys.95:5200–5209.
- Buerhop, C., H. Scheuerpflug, and R. Weißmann. 2011. Pp. 3413–3416inThe role of infrared emissivity of glass on IR-imaging of plants. 26th EU-PVSEC, Hamburg, Germany.
- Buerhop, C., D. Schlegel, M. Niess, C. Vodermayer, R. Weißmann, and C. J. Brabec. 2012a. Reliability of IR-imaging of PV-plants under operating conditions. Sol. Energy Mater. Sol. Cells107:154–164.
- Buerhop, C., R. Weißmann, H. Scheuerpflug, R. Auer, and C. J. Brabec. 2012b. Pp. 3370–3373inQuality control of PV-modules in the field using a remote-controlled drone with an infrared camera. 27th EU-PVSEC, Frankfurt, Germany.
- GTM. 2011. Thin film 2012–2016: technologies, markets and strategies for survival. GTM Research, Cambridge, MA.
- Green, M. A., K. Emery, Y. Hishikawa, W. Warta, and E. D. Dunlop. 2012. Solar cell efficiency tables (version 39). Progress in Photovoltaics20:12–20.
- Jackson, P., D. Hariskos, E. Lotter, S. Paetel, R. Wuerz, R. Menner, et al. 2011. New world record efficiency for Cu(In,Ga)Se2 thin-film solar cells beyond 20%. Progress in Photovoltaics19:894–897.
- Breitenstein, O., W. Warta, and M. Langenkamp. 2010. Lock-in thermography, basics and use for evaluating electronic devices and materials. 2nd ed. Springer, Berlin.
- Breitenstein, O., J. P. Rakotoniaina, A. S. H. van der Heide, and J. Carstensen. 2005. Series resistance imaging in solar cells by lock-in thermography. Prog. Photovoltaics Res. Appl.13:645–660.
- Isenberg, J., A. S. H. van der Heide, and W. Warta. 2005. Investigation of series resistance losses by illuminated lock-in thermography. Prog. Photovoltaics Res. Appl.13:697–703.
- Bachmann, J., C. Buerhop-Lutz, R. Steim, P. Schilinsky, J. A. Hauch, E. Zeira, et al. 2012. Highly sensitive non-contact shunt detection of organic photovoltaic modules. Sol. Energy Mater. Sol. Cells101:176–179.
- Powalla, M., M. Cemernjak, J. Eberhardt, F. Kessler, R. Kniese, H. D. Mohring, et al. 2006. Large-area CIGS modules: pilot line production and new developments. Sol. Energy Mater. Sol. Cells90:3158–3164.
Document information
Published on 01/06/17
Submitted on 01/06/17
Licence: Other
Share this document
Keywords
claim authorship
Are you one of the authors of this document?


