Abstract
The world population is continually increasing, but the Japanese population is decreasing. By 2050, the Japanese population is calculated to be close to 100 million people, and by 2060, 40% of the Japanese are estimated to be aged 65 years or more. Data show an increase in the declining birth and aging rates of the population. The development of high-concentration urban structures will be needed to solve such problems. However, a detailed vision of the future is yet to be clarified and in the process of consideration. In this study, we developed an instrument called “Population Migration Tool,” which is based on plural planning and policy, after we formed a future population distribution model. In addition, We also established a high-concentration urban structure model with this tool with the aim of considering the kind of urban structure local cities should target in the future.
Keywords
Local city ; Compact city ; Future population ; Visualization ; Concentration urban structure
1. Introduction
1.1. Background and purpose of the study
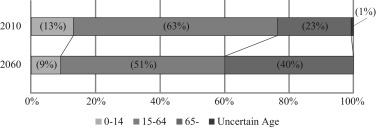
While the world population is continually increasing, the Japanese population is decreasing. In 2015, the Japanese population calculated to be less than 100 million people (Table 1 ). In addition, Fig. 1 shows that in 2060, 40% of the people will be over 65 years old. The data show an increase in the declining birth and aging rates of the population. To solve such problems, high-concentration urban structures will need to be developed. Local governments are considering compact city projects, which could recover the vitality of the central district and establish a life base for the residents.
| 2010 | 2020 | 2030 | 2040 | 2050 | 2060 | |
|---|---|---|---|---|---|---|
| World | 6,916,183 | 7,716,749 | 8,424,937 | 9,038,687 | 9,550,944 | 9,957,398 |
| Japan | 128,057 | 124,100 | 116,618 | 107,276 | 97,076 | 86,737 |
|
|
|
Fig. 1. Age structure of 2010 and 2060 in Japan. |
In addition, local cities are aiming to develop high-concentration urban structures as part of their future vision. However, a detailed vision of the future has yet to be clarified and is in the process of consideration.
Therefore, in this study, we developed the “Population Migration Tool,” which is based on plural planning and policy of local government, after we formed the future population distribution model. Moreover, we formed a high-concentration urban structure model with this tool, and we aim to consider the type of urban structure local cities should target in the future.
Several studies have focused on compact cities worldwide. For example, Ahn et al. (2014) proposed the direction of urban regeneration of small and medium-sized cities of the China. Xiaolu et al. (2013) verified carbon dioxide emissions. Boquet (2014) organized the features of Dijion City and considered the good points of the city. Jabareen (2006) proposed a Matrix of Sustainable Urban Form, which evaluates the sustainability of different urban forms. Prasanna and Nurul Handayani (2015) measured urban expansion process in Indonesia, and analyzed to understand temporal and spatial characteristics of urbanization. Schneider and Woodcock (2008) examined the similarities and differences in urban form and growth that have occurred across 25 mid-sized cities in North America and the United States.
Moreover, many studies have examined compact cities in Japan. Takahashi and Deguchi (2007) verified the cost of the formation effects. Uchida et al. (2009) and Kobayashi et al. (2010) verified carbon dioxide emissions. Yamane et al. (2007) proved the effects of consumer behavioral patterns. However, few studies have examined the formation method of a compact city in detail for a targeted local city in Japan.
1.3. Study methods
In this study, the target area is Takamatsu city, which is the capital of the Kagawa prefecture. At first, using 100-meter mesh data, we analyzed urban structures based on land use and population distribution. Next, using a primary factors cohort, we formed a future population distribution model with the 100-meter mesh data after we estimated the future population. In addition, we developed a “Population Migration Tool” according to plural plans and polices of the target area. Moreover, we migrated the population to the concentration base using the tool. Then, we simulated the future urban structures based on the use of high-concentration urban structures. Lastly, we evaluated the model.
1.4. Overview of the expert system
An expert system is a system designed to solve a professional problem. The proposed system consists of three interfaces comprising a knowledge base to store the knowledge of experts, an inference engine to calculate the information that wants of the user by using the knowledge in the knowledge base, and the interface that provides information in an easy-to-understand form to the user.
2. Summary of the target area
As previously mentioned, the target area is Takamatsu city, which is in the Kagawa prefecture. In this section, we organized the urban structure of the target area based on land use and population distribution.
2.1. Land use
The urban structure in the target area was analyzed using the state of the land use based on the 100-meter mesh data. The land use was classified into 11 categories, namely, “Rice Fields,” “Agricultural Land,” “Forest Areas,” “Waste Areas,” “Building Areas,” “Highway,” “Another Area,” “Rivers and Lakes,” “Beach Areas,” “Sea Areas,” and “Golf Fields.” Table 2 shows the number of the land use mesh. The meshes of “Rice Field” continually decreased, whereas the meshes of “Building Area” continually increased (Table 2 ).
| 1991 | 1997 | 2006 | 2009 | |
|---|---|---|---|---|
| Rice Fields | 6108 | 5412 | 4704 | 3415 |
| Agricultural Land | 1362 | 1416 | 1101 | 1074 |
| Forest Areas | 2688 | 2609 | 2877 | 2988 |
| Waste Areas | 125 | 89 | 124 | 62 |
| Building Areas | 3252 | 3780 | 4894 | 6295 |
| Highways and Railways | 162 | 224 | 232 | 48 |
| Another Area | 471 | 643 | 442 | 555 |
| Rivers and Lakes | 761 | 749 | 621 | 599 |
| Beach Areas | 13 | 13 | 2 | 0 |
| Sea Areas | 98 | 98 | 40 | 0 |
| Golf Fields | 32 | 39 | 35 | 36 |
| Total | 15,072 | 15,072 | 15,072 | 15,072 |
2.2. Population distribution
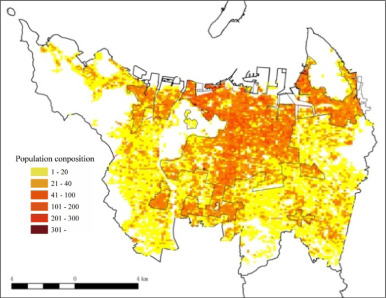
The urban structure in the target area was analyzed using population distribution with the 100-meter mesh data. Population distribution was classified into seven categories of “0 people,” “1–20 people,” “21–40 people,” “41–100 people,” “101–200 people,” “201–300 people,” and “over 300 people.” Table 3 shows population by age group, and Table 4 shows the number of meshes of the population distribution. Fig. 2 shows the population distribution of 2010. The younger population between the ages of 0 and 14 shows a decreasing trend as demonstrated, and the older population of over 65 years old is on an increasing trend (Table 3 ).
| 1995 | 2000 | 2005 | 2010 | |
|---|---|---|---|---|
| 0–14 | 67,456 | 62,861 | 60,505 | 57,943 |
| 15–64 | 282,376 | 279,332 | 271,957 | 255,599 |
| 65 above | 62,746 | 74,009 | 84,314 | 93,667 |
| Uncertain age | 48 | 478 | 1349 | 12,220 |
| Total | 412,626 | 416,680 | 418,125 | 419,429 |
| Population | Mesh | Population | Mesh |
|---|---|---|---|
| 0 | 5609 | 101–200 | 645 |
| 1–20 | 4668 | 201–300 | 32 |
| 21–40 | 1992 | 301 | 6 |
| 41–100 | 2120 | Total | 15,072 |
|
|
|
Fig. 2. Population distribution of 2010. |
2.3. Summary of the urban structure
We organized of the target area based on the land use and population distribution. The meshes of “Building Areas” greatly increased, and the urban structure widened. However, the younger population showed a decreasing trend, and the older population indicated an increasing trend. As a result, the low-density population increased. Therefore, the target areas needed to plan carefully the compact city.
3. Formation of the future population distribution
In this section, we calculated the future population by using the primary factor cohort and the population by age. In addition, we formed the future population distribution of a 100-meter mesh using the future population and the population distribution of the 100-meter mesh.
3.1. Calculation of future population
We calculated the future population for 2020, 2030, 2040, 2050, and 2060 by using the primary factor cohort. Table 5 shows the future population. As is the case with future Japanese population, the future population of the target area shows a decreasing trend. In addition, the younger population between the ages of 0 and 14 is on a decreasing trend, and the older population over 65 years old is on an increasing trend. Thus, the declining birth and aging rates of the population are progressing in the target area as well.
| 2010 | 2020 | 2030 | 2040 | 2050 | 2060 | |
|---|---|---|---|---|---|---|
| 0-14 | 45,630 | 37,229 | 31,330 | 30,667 | 24,441 | 22,183 |
| 15-64 | 200,586 | 179,640 | 165,512 | 138,651 | 121,260 | 110,023 |
| 65- | 71,760 | 89,194 | 91,374 | 97,126 | 95,378 | 84,916 |
| Total | 317,976 | 306,062 | 288,216 | 266,443 | 241,079 | 217,122 |
3.2. Formation and evaluation of future population
Next, we formed the 100-meter mesh future population distribution model based the future population of the city and the 100-meter mesh data. Table 6 shows the number of meshes of the future population. From these projections, the type of future urban structure was predicted to be low-density. For the 2010 urban structure, the category for “1–20 people” has 4668. For the 2060 urban structure projection, the population will be around 5691. In addition, in 2010, over 100 people recorded 683, while 2060 urban structure will have 248. From the above results, the population of the target area is lower than in the present situation, and concern is raised on the spread of urban structure towards low-density.
| 2010 | 2020 | 2030 | 2040 | 2050 | 2060 | |
|---|---|---|---|---|---|---|
| 0 | 5609 | 5616 | 5621 | 5639 | 5656 | 5691 |
| 1–20 | 4668 | 4861 | 5098 | 5451 | 5611 | 5734 |
| 21–40 | 1992 | 1925 | 1853 | 1812 | 1783 | 1771 |
| 41–100 | 2120 | 2053 | 1978 | 1803 | 1717 | 1628 |
| 101–200 | 645 | 584 | 493 | 346 | 287 | 233 |
| 201–300 | 32 | 26 | 23 | 19 | 16 | 13 |
| 301 above | 6 | 7 | 6 | 2 | 2 | 2 |
| Total | 15,072 | 15,072 | 15,072 | 15,072 | 15,072 | 15,072 |
4. Formation and evaluation of high-concentration urban structure model
In this section, we formed the high-concentration urban structure model. First, we developed the population migration tool after we built a base relying on the plural master plans of the target area. Then, we simulated a high-concentration urban structure model based on the tool. Finally, we evaluated the model.
4.1. Summary of base
We built the base, the axis, and the five-area division based on the seven plans. This study used the following for references, “Basic Plan of Land Use in Kagawa Prefecture” (Kagawa Prefecture, 2011a ), “Creation Plan of Setouchi Garden City” (Kagawa Prefecture, 2011b ), “Basic Policy of Urban Planning toward the Realization of High-Concentration Urban Structure” (Kagawa Prefecture, 2007 ), “Takamatsu Regional Planning Master Plan” (Kagawa Prefecture, 2012 ), “Takamatsu Comprehensive Plan -The Fifth-” (Takamatsu City, 2008a ), “Takamatsu City Planning Master Plan” (Takamatsu City, 2008b ), and “Basic Plan of Beautiful Takamatsu City” (Takamatsu City, 2011 ).
4.2. Setting the population migration rules
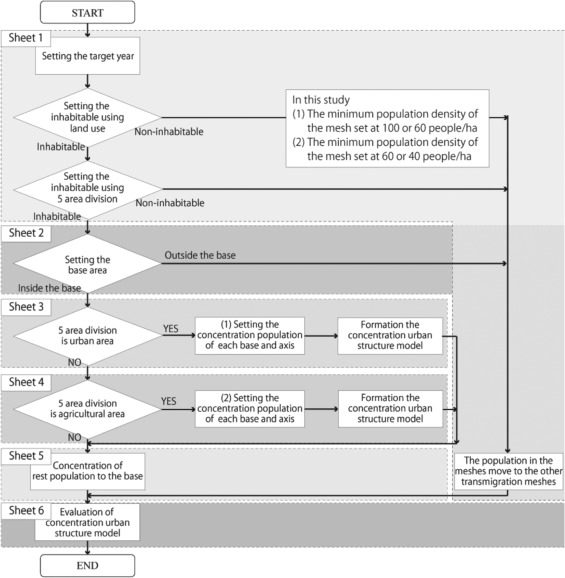
Next, we set the population migration rules. Fig. 3 shows a flow chart of the rules.
- Designated as a non-inhabitable area with land use
If the land use of the mesh is the “Rice Areas,” “Agricultural Land,” “Forest Areas,” “Waste Areas,” “Rivers and Lakes,” “Beach Areas,” “Sea Areas,” and “Golf Field,” then the mesh is designated as a non-inhabitable area. In this case, the population in the meshes moved towards the other transmigration area.
- Designated as a non-inhabitable area with a five-area division
If the five-area division of the mesh is the “Forest Area,” “Natural Park Area,” and “Natural Protection Area,” then the mesh is designated as a non-inhabitable area. In this case, the population in the meshes moves to the other transmigration area.
- Population migration to urban area
If the “five-area division is an urban area” and the “base is a wide-area base” or the “axis is a wide-area axis,” the minimum population density of the mesh is set at 100 people/ha. Additionally, if the “five-area division is an urban area” and the “within the base” or “overlaps with axis,” then the minimum population density of the mesh is set at 60 people/ha.
- Population migration to agricultural area.
|
|
|
Fig. 3. Flowchart of the population migration tool. |
If the “five-area division is an agricultural area” and the “base is a wide-area base” or the “axis is wide-area axis,” the minimum population density of the mesh is set at 60 people/ha. Additionally, if the “five-area division is an agricultural area” and “within the base” or “overlaps with axis,” then the minimum population density of the mesh is set at 40 people/ha.
4.3. Developing the population migration tool
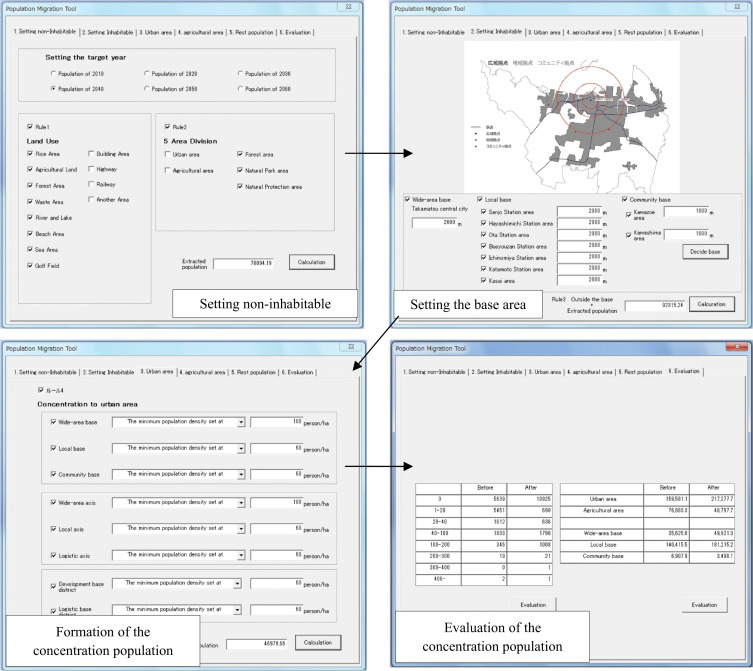
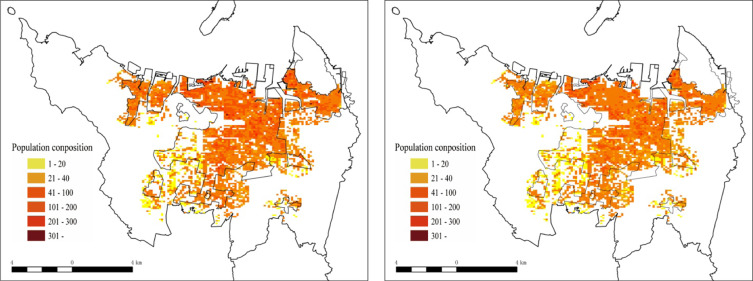
Moreover, we developed a population migration tool based on the four population migration rules. The tool could change arbitrarily the rules and simulate the high-concentration of the urban structure. Fig. 4 shows a screenshot of the tool.(Fig. 5 ).
|
|
|
Fig. 4. Interface of the population migration tool. |
|
|
|
Fig. 5. 2010 Concentration of urban structure model (left), and 2040 concentration of urban structure model (right). |
In sheet 1, we set the year of the population distribution. Then, we designated the non-inhabitable area based on the land use and a five-area division.
In sheet 2, we set the base area based on the wide-area, local, and the community bases. We put the base area at a distance from each base point. Next, we set a minimum target population for the base area and axis.
In sheet 3, we migrated the population to the area in the five-area division in the urban area, and in sheet 4, the five-area division is the agricultural area. Moreover, we established five population concentration rules: 1) “The population moves to the other transmigration meshes,” 2) “Not migration population,” 3) “Keeping the 2010 population,” 4) “The minimum population density of the mesh set at XXX people/ha,” and 5) “The minimum population density of the mesh increases XX% of the population.”
In sheet 5, we migrated the rest of the population to the concentration base, and we formed the high-concentration urban structure model.
In the last sheet, we evaluated the high-concentration urban structure model based on the number of meshes and the base area. As a result, we simulated a high-concentration urban structure model using this tool. Then, we formed the 2010 and 2040 concentration urban structure models based on this tool.
4.4. Evaluation of concentration urban structure model
We evaluated the high-concentration urban structure models by using the population distribution and the distance from urban facilities.
4.4.1. Population density
Table 7 shows the high-concentration urban structure models based on population distribution. As shown in the number of meshes of the population distribution in the 2010 urban structure, “1–20 people” has 4668 (31.0%), and the 2040 urban structure has 5451 (36.2%). The 2010 high-concentration urban structure model has 297 (2.0%), and the 2040 high-concentration urban structure model has 405 (2.7%). In the 2010 urban structure, over 200 people have 38 (0.2%), and the 2040 urban structure has 21 (0.1%). The 2010 high-concentration urban structure model has 52 (0.3%), and the 2040 concentration urban structure model has 27 (0.2%).
| 2010 urban structure | 2010 concentration urban structure | 2040 urban structure | 2040 concentration urban structure | |
|---|---|---|---|---|
| 0 | 5,609 (37.2%) | 10,925 (72.5%) | 5,639 (37.4%) | 10,925 (72.5%) |
| 1-20 | 4,668 (31.0%) | 297(2.0%) | 5,451 (36.2%) | 690 (2.7%) |
| 21-40 | 1,992 (13.2%) | 449(3.0%) | 1,812 (12.0%) | 636 (4.7%) |
| 41-100 | 2,120 (14.1%) | 2,412 (16.0%) | 1,803 (12.0%) | 1,790 (16.9%) |
| 101-200 | 645(1.3%) | 929(6.2%) | 346 (2.3%) | 1,008 (3.1%) |
| 201-300 | 32(0.2%) | 52(0.3%) | 19 (0.1%) | 21 (0.2%) |
| 301- | 6(0.0%) | 8(0.0%) | 2 (0.0%) | 2 (0.0%) |
| Total | 15,072 (100.0%) | 15,072(100.0%) | 15,072 (100.0%) | 15,072 (100.0%) |
4.4.2. Population by base
Table 8 shows the high-concentration urban structure models based on the population by base. The population of the urban area increased in comparison with before the concentration. Moreover, population of the wide-area and local base increased compared with before the concentration.
| 2010 urban structure | 2010 concentration urban structure | 2040 urban structure | 2040 concentration urban structure | |
|---|---|---|---|---|
| Urban area | 199,894.6(60.8%) | 277,150.6(84.4%) | 159,581.1 (61.8%) | 217,277.7 (84.2%) |
| Agricultural area | 100,622.4 (30.6%) | 51,222.0(15.6%) | 76,883.3(29.8%) | 40,797.7 (15.8%) |
| Other area | 27,855.6(8.5%) | 0.0(0.0%) | 21,611.0 (8.4%) | 0.0(0.0%) |
| Wide-area base | 48,526.6(14.8%) | 64,444.1(19.6%) | 35,625.0(13.8%) | 49,921.3(19.3%) |
| Local base | 171,976.6(52.4%) | 230,093.7(70.1%) | 140,415.5(54.4%) | 181,215.2(70.2%) |
| Community base | 8,602.8(2.6%) | 4,511.8(1.4%) | 6,907.9(2.7%) | 3,498.1(1.4%) |
| Outside of base | 29,322.9(30.2%) | 99,266.5 (8.9%) | 23,440.9(29.1%) | 75,127.0(9.1%) |
| Total | 328,372.6 (100.0%) | 328,372.6(100.0%) | 258,075.4(100.0%) | 258,075.4(100.0%) |
4.4.3. Population by distance from facilities
Table 9 shows the high-concentration urban structure models based on the population by distance from the train station. Table 10 shows the high-concentration urban structure models based on the population by distance from the general hospital.
| 2010 urban structure | 2010 concentration urban structure | 2040 urban structure | 2040 concentration urban structure | |
|---|---|---|---|---|
| 0-1,000 | 226,594.4 | 260,679.1 | 178,814.9 | 204,310.0 |
| 1,001-2,000 | 69,455.9 | 60,076.2 | 54,698.9 | 47,819.5 |
| 2,001-3,000 | 24,348.2 | 7,057.9 | 18,839.1 | 5,488.1 |
| 3,001-4,000 | 4,970.2 | 559.4 | 3,674.1 | 457.8 |
| 4,001-5,000 | 1,565.1 | 0.0 | 1,029.8 | 0.0 |
| 5,001- | 1,438.8 | 0.0 | 1,018.5 | 0.0 |
| Total | 328,372.6 | 328,372.6 | 258,075.4 | 258,075.4 |
| 2010 urban structure | 2010 concentration urban structure | 2040 urban structure | 2040 concentration urban structure | |
|---|---|---|---|---|
| 0-1,000 | 20,328.7 | 22,341.1 | 16,258.8 | 17,745.6 |
| 1,001-2,000 | 57,990.7 | 72,481.8 | 46,735.8 | 57,120.0 |
| 2,001-3,000 | 95,215.2 | 102,908.5 | 75,476.8 | 80,966.5 |
| 3,001-4,000 | 85,147.9 | 72,808.8 | 67,136.5 | 57,458.4 |
| 4,001-5,000 | 51,665.7 | 47,712.1 | 39,152.8 | 37,040.7 |
| 5,001- | 18,024.5 | 10,120.3 | 13,314.6 | 7,744.2 |
| Total | 328,372.6 | 328,372.6 | 258,075.4 | 258,075.4 |
The population in closer proximity to the train station increased, and the population at a greater distance from the train station decreased (Table 9 ). Meanwhile, the population in closer proximity to the general hospital increased, and the population at a greater distance from the general hospital decreased (Table 10 ).
Therefore, the high-concentration urban structure models in the target area showed a high-density population and traffic convenience increased.
5. Conclusion
In this study, we built a future population distribution model by using a primary factor cohort. In addition, we developed a population migration tool based on plural master plans. Finally, we formed and evaluated the high-concentration urban structure models using that tool. The results are as follows.
(1) The younger population is on a decreasing trend, and the older population is on an increasing trend in the target area.
(2) As a result of the formation of the future population structure of target area, the future population gradually decreased. Additionally, we predict that future urban structures will move towards low-density.
(3) We formed a high-concentration urban structure model using the population migration tool. The rules of the tool can be changed arbitrarily. For this reason, we were able to consider a variety of high-concentration urban structure models.
(4) The concentrated urban structure model indicated a high-density population and increased traffic.
This study makes possible to visualize the future urban structure. This study will consider policies needed in creating effective urban structures, which is our goal for the future.
References
- Ahn et al., 2014 Ahn, J. G., Jeong, H.C., Lee, J.H., Byeong, H., 2014. A study on the plan indicator for the activation of urban regeneration in small and medium-sized cities. In: Proceedings of the 9th International Symposium on City Planning and Environmental Management in Asian Countries. pp. 89–93.
- Boquet, 2014 Y. Boquet; Transportation and sustainable development in a mid-size french city, Dijon; Int. Rev. Spat. Plan. Sustain. Dev., 2 (2) (2014), pp. 52–63
- Xiaolu et al., 2013 X. Gao, J. Ji, F. Wang; Spatial pattern of transportation carbon emission based on behavior zones: evidence from Beijing, China; Int. Rev. Spat. Plan. Sustain. Dev., 1 (2) (2013), pp. 3–14
- Jabareen, 2006 Y.R. Jabareen; Sustainable urban forms: their typologies, models, and concepts; J. Plan. Educ. Res., 26 (2006), pp. 38–52
- Kagawa Prefecture, 2011a Kagawa Prefecture, 2011a. Basic Plan of Land Use in Kagawa Prefecture.
- Kagawa Prefecture, 2011b Kagawa Prefecture, 2011b. Creation Plan of Setouchi Garden City.
- Kagawa Prefecture, 2007 Kagawa Prefecture, 2007. Basic Policy of Urban Planning toward the Realization of Concentration Urban Structure.
- Kagawa Prefecture, 2012 Kagawa Prefecture, 2012. Takamatsu Regional Planning Master Plan.
- Kobayashi et al., 2010 Kobayashi, M.Kobayashi, T.Ikaruga, S., 2010. Evaluation of compact city by applying the area division system. In: Proceedings of the 7th International Symposium on City Planning and Environmental Management in Asian Countries. pp. 1–8.
- Prasanna and Nurul Handayani, 2015 D. Prasanna, K. Nurul Handayani; Measuring the urban expansion process of Yogyakarta city in Indonesia; Int. Rev. Spat. Plan. Sustain. Dev., 3 (4) (2015), pp. 52–63
- Schneider and Woodcock, 2008 A. Schneider, C.E. Woodcock; Compact, dispersed, fragmented, extensive? A comparison of urban growth in twenty-five global cities using remotely sensed data, pattern metrics and census information; Urban Stud., 45 (3) (2008), pp. 659–692
- Takahashi and Deguchi, 2007 M. Takahashi, A. Deguchi; Method for cost-benefit evaluation system of impact by forming compact city; J. City Plan. Inst. Jpn., 42 (3) (2007), pp. 487–492
- Takamatsu, 2008a Takamatsu City, 2008a. Takamatsu Comprehensive Plan -The Fifth.
- Takamatsu, 2008b Takamatsu City, 2008b. Takamatsu City Planning Master Plan.
- Takamatsu, 2011 Takamatsu City, 2011. Basic Plan of beautiful Takamatsu City.
- Uchida et al., 2009 G. Uchida, T. Ujihara, M. Taniguchi, S. Hashimoto; Can we realize the new rural structure with low environmental load? Focus in automobile CO-2 emissions; J. City Plan. Inst. Jpn., 44 (3) (2009), pp. 361–366
- Yamane et al., 2007 K. Yamane, J. Zhang, A. Fujiwara; Influences of city compactness on travel behavior patterns in a local city: analysis using an aggregate-type discrete choice models incorporating inter-alternative similarities; J. City Plan. Inst. Jpn., 42 (3) (2007), pp. 595–600
Document information
Published on 12/05/17
Submitted on 12/05/17
Licence: Other
Share this document
Keywords
claim authorship
Are you one of the authors of this document?
