Abstract
Background
This work presents an experimental and modeling study of the electromagnetic environment in the vicinity of a high voltage substation located in eastern Algeria (Annaba city) specified with a very high population density. The effects of electromagnetic fields emanating from the coupled multi-lines high voltage power systems (MLHV) on the health of the workers and people living in proximity of substations has been analyzed.
Methods
Experimental Measurements for the Multi-lines power system proposed have been conducted in the free space under the high voltage lines. Fields intensities were measured using a referenced and calibrated electromagnetic field meter PMM8053B for the levels 0 m, 1 m, 1.5 m and 1.8 m witch present the sensitives parts as organs and major functions (head, heart, pelvis and feet) of the human body.
Results
The measurement results were validated by numerical simulation using the finite element method and these results are compared with the limit values of the international standards.
Conclusion
We project to set own national standards for exposure to electromagnetic fields, in order to achieve a regional database that will be at the disposal of partners concerned to ensure safety of people and mainly workers inside high voltage electrical substations.
Keywords
electromagnetic compatibility ; electromagnetic fields ; human health ; HV power lines ; low frequency
1. Introduction
Electric power substations, transmission, and distribution lines, are some of the commonly known sources of electromagnetic pollution. The development and expansion of the power systems worldwide, has increased the electromagnetic field level as well as the bioorganism and human body exposure to electromagnetic radiation [1] .
Electrical energy is transported from the power station to the substations through overhead electric lines and from there to the final users by electromagnetic fields that are propagated throughout the lines. The fields' magnitudes are highest under the lines and decrease rapidly with the distance from the pylon axes [2] . The evaluation of the electric and magnetic charges quantities in the vicinity of high voltage power lines have been analyzed in several publications [3] , [4] and [5] . The high-intensity of electromagnetic fields can induce important voltages and currents in conducting elements located in their proximity and many publications throughout the world have studied the effects of electromagnetic fields emanating from power lines and stations of mobile communication, and for the analysis of modes of energetic transfers [6] and [7] . A great deal has been written on the subject and doctors agree with these studies. The 2007 Euro-barometer survey [8] showed a strong concern and preoccupation of the European population to electromagnetic fields. As several studies have focused on the mechanism by which the electromagnetic fields might influence the health of people, it seems clear that different perceptions of risks can lead to different actions. Some people conclude that the current evidence for health risks from Extremely low frequency (ELF) fields is so tenuous, and the possible risks so small, that no action is necessary. Others find even the slightest possibility of a risk sufficiently disturbing and agree more on the precautionary principle. The idea of prudent avoidance involving limiting exposures has been suggested as a means to control exposures to ELF fields if there is any doubt that they are harmless. Due to this, various occupational health organizations have established limits of exposure to electromagnetic fields in work and public places. Among these organizations are cited the International Commission on Non-Ionizing Radiation Protection (ICNIRP) and standard Institute of Electrical and Electronics Engineers (IEEE) [9] , [10] and [11] guidelines which set a basic restriction on the density of electric current induced in the body by ELF fields mainly to avoid electrical shock hazards, minimize burn hazards, and reduce interference with medicals implants. In 1989, the World Health Organization proposed a limit of induced current in the human body (10 mA/m2 ). Inspired by this proposal and a similar recommendation of ICNIRP, in June 1999 the European Commission adopted a Council Recommendation concerning the limitation of public exposure to low frequency electromagnetic fields (Table 1 ).
| Electric field | Magnetic field | |
|---|---|---|
| Residential exposure (24 h/24 h) | 5 kV/m | 100 μT |
| Occupational exposure (8 h/j) | 10 kV/m | 500 μT |
Other experimental studies [12] , [13] , [14] and [15] have been carried out by our own team, LGEG Laboratory, in collaboration with the electricity producing company SONELGAZ, Annaba, Algeria. These studies focused on the characterization of a high voltage line and operate thereafter as a source of disturbance applied to the study of the electromagnetic compatibility of medical implants (pacemakers, hearing, etc.) [16] , [17] and [18] .
As a shortcoming with regard to standards on exposure to low frequency electromagnetic fields in Algeria and in order to achieve a regional database on these fields, evaluations will be at the disposal of responsible institutions to ensure safety of people and workers.
This work is intended to present an experimental and numerical modeling of the electric field (EF) and magnetic field (MF) generated by a circuit of two 220 kV multi-line power systems implanted inside El-Hadjar substations located in eastern Algeria within an urban area. The intensities of fields simulated approach the limit values imposed by the international standards in areas close to large transmission lines, often frequented by electric posts workers. Away from the power lines field levels are much lower than proposed limits. As we can see, none of the regulations are founded on the leakage fields from transmission lines. Therefore, low levels of electrical and magnetic fields from power lines may have no influence on a human body.
2. Materials and methods
2.1. Model description
In this section of work an experimental characterization of electromagnetic field generated by two 220-kV overhead power lines with flat configuration is achieved. Both lines are located next to each other inside the El-Hadjar substation which provides interconnection between Algeria and Tunisia. The line (B) is located 28 m from Line A, they represent respectively Arcelor-Mittal and Kharaza cities. The distance between phase lines, the clearance of conductors, cables guard, the lengths of lines, and the currents in conductors when measuring the fields' intensities are listed in Table 2 .
| Directions | Pylon A 220 Kv KHERAZA | Pylon B 220 Kv ARCELOR-METTAL |
|---|---|---|
| Height of the phase 1 (m) | 21 | 21.5 |
| Height of the phase 2 (m) | 21 | 21.5 |
| Height of the phase 3 (m) | 21 | 21.5 |
| Height of the cable guard (m) | 25 | 27 |
| Phase Spacing (m) | 7.5 | 8 |
| Length (Km) | 76.98 | 42 |
| Nub of conductors by phase | 01 | 01 |
| Value of current by phase (A) | 270 | 274.2 |
2.2. Measurement protocol
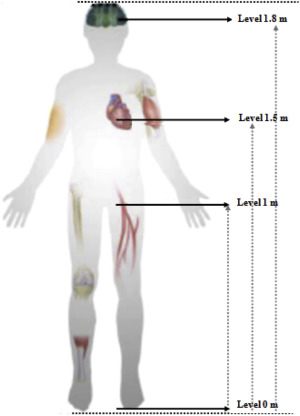
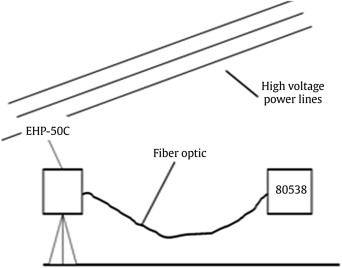
Experimental measurements for the multi-lines power system proposed have been conducted in the free space under the high voltage lines in accordance with the IEEE standards [19] . Fields' intensities were measured using a referenced and calibrated electromagnetic field meter PMM8053B [20] for the levels 0 m, 1 m, 1.5 m, and 1.8 m which present the sensitive parts as organs and major functions (head, heart, pelvis, and feet) of the human body in case of power frequency fields exposure (Fig. 1 ). To avoid the relief of the perturbation of the fields intensities, the device is equipped with an isotropic probe mounted on a 1-m high nonconducting tripod. The acquisition of data was done in real time by a computer software package. The recommended configuration for measurements is shown in Fig. 2 .
|
|
|
Fig. 1. Sensitive levels of human body exposure. |
|
|
|
Fig. 2. Protocol of measurement. |
2.3. Theory and modeling
The metrology regarding electromagnetic fields radiated by high voltage power lines with a large physical size compared with the radius of the phase conductor is very delicate.
In the modeling we have taken into consideration the soil characteristics. The images theory is applied. In low frequency (50 Hz), the ground effect can be ignored.
The ground surface is flat and its potential is also equal to 0. Taking into account the penetration depth; images are actually located at a depth in the soil, the depth P is:
|
|
where ρ is the resistivity of the soil (ohm/meter) and f is frequency (Hz).
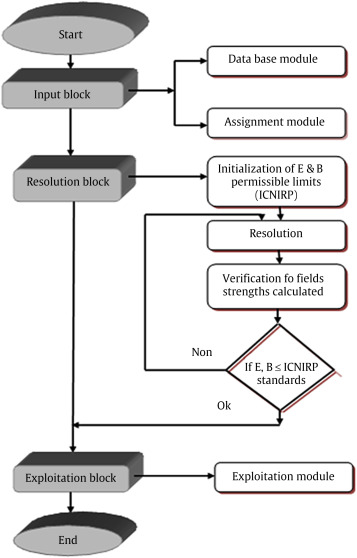
Experimental values can be easily obtained but it is very difficult to say whether the results are accurate. In order to validate our experimental results, an analytical characterization of the fields in the vicinity of the circuit of lines proposed has been made. Though the electric and magnetic fields generated by power lines are decoupled, due to the fact that at power frequency field varies so slowly in time that Maxwells equations are generally converted into the electrostatic and magneto-static equations. In our case the calculus have been made by means of a flexible code developed in a numerical environment, the corresponding block diagram is illustrated in Fig. 3 .
|
|
|
Fig. 3. Block diagram for electric and magnetic fields calculation. |
2.4. Numerical simulation
This part of the work draws on a numerical modeling of the electric and magnetic field emanating from the circuit of lines proposed, first, to validate the experimental results and at the same time to confirm the analytical results. The numerical simulation is solved using the module of electrostatic and magneto-static of software COMSOL (Stockholm, Sweden) multi-physics based on the finite element method (FEM). This method is often used for computer simulation; it solves the problems involving electric and magnetic field effects around the transmission line caused by circular cross-section of high voltage conductors.
3. Results
3.1. Experimental results
Table 3 and Table 4 summarize the measurement results of the electric and magnetic fields at 1 m height above the ground, made respectively under a single 220-kV and two 220-kV transmission lines. Theoretically the low frequency electromagnetic fields have relatively low spatial ranges and field strengths are inversely proportional to the distance from the source. To argue our experimental results, we focused on the two fundamental principles related to electromagnetic compatibility of high voltage transmission lines, namely (1) the effect of electric field to induce currents in the wires parallel to the field lines (capacitive coupling) and (2) the effect of magnetic field to induce a voltage in the loops perpendicular to the field lines (inductive coupling).
| Position of measurement | Pylon A (0 m) reference | Middle structure (14 m) | Pylon A (28 m) |
|---|---|---|---|
| Electric field (V/m) | 1,764.24 | 3,198.46 | 1,748.65 |
| Magnetic field (μT) | 2.69 | 2.58 | 2.74 |
| Position of measurement | Left phase conductor | Center phase conductor | Left phase conductor |
|---|---|---|---|
| Electric field (V/m) | 1,148.24 | 354.98 | 1,137.89 |
| Magnetic field (T) | 2.21 10−7 | 2.53 10−7 | 2.20 10−7 |
3.2. Electric field behavior
As can be seen from the experimental results shown in Table 3 , the intensities of electric field (EF) intensities measured at the center of the pylons A and B are 1,764.24 V/m and 1,748.65 V/m, respectively. The difference between these values is due to the tower heights and terrain deviation from flat earth. The EF maximum value, 3,198.46 V/m, is relieved at the middle position of the structure (15 m) and depends on the spacing between the phase conductors. This can be interpreted by the fact that in the absence of any electrostatic shield, the equivalent capacitance of the capacitors formed by the lines phases reaches its maximum value and varies proportionally to the concentration of charges quantities on theme surfaces. We can conclude from the experimental results recorded that the electric field strength is significantly higher under two power lines compared with a single power line (Table 4 ).
3.3. Magnetic field behavior
The maximum values of the magnetic field are measured beneath Line A (2.69 μT) and Line B (2.74 μT) and decrease at the middle position of the structure (2.58 μT) as shown in Table 3 . In fact the same phase arrangement causes a greater cancellation of the magnetic field in the intermediate zone between both lines than if another arrangement is used [21] . It appears from experimental results that the circuit of two 220-kV power lines with great power generates higher magnetic field strength compared with the single 220-kV power line (Table 4 ).
3.4. Analytical calculation results
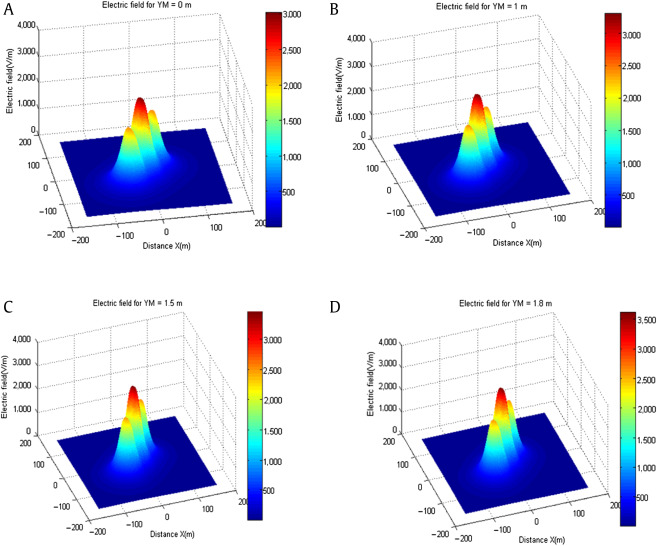
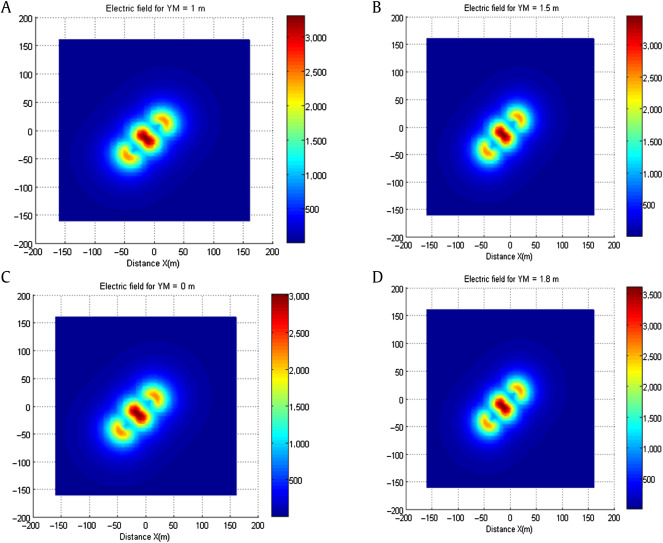
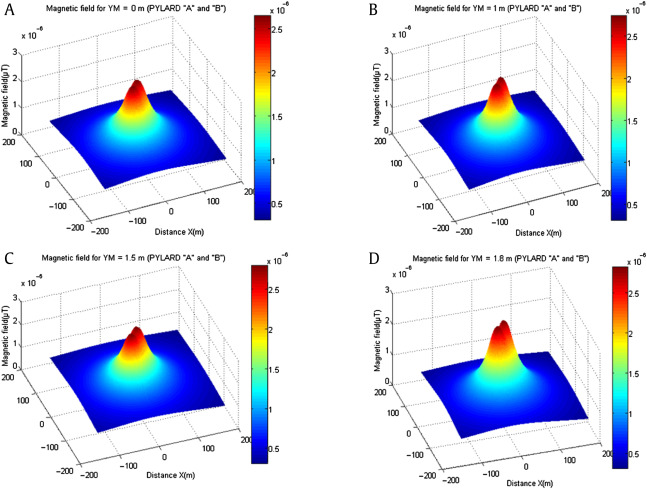
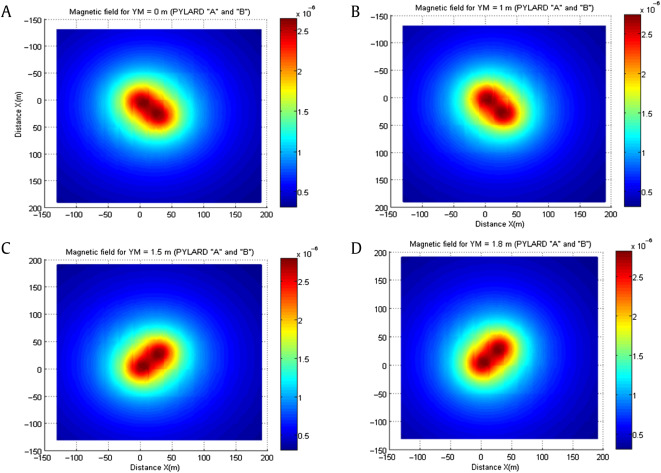
Fig. 4 , Fig. 5 , Fig. 6 and Fig. 7 present respectively the three-dimensional distribution of electric and magnetic fields for the model studied and their presentation in the X–Y plane for the selected levels above the ground (0 m, 1 m, 1.5 m, and 1.8 m). The axis (OZ) represents the fields magnitudes and the other axes (OX) and (OY) represents the distances x (m) and y (m) in the vicinity of the circuit considered.
|
|
|
Fig. 4. Electrical field distribution for four levels: (A) 0 m, (B) 1 m, (C) 1.5 m, (D) 1.8 m. |
|
|
|
Fig. 5. Electrical field distribution, plane X–Y, for four levels: (A) 0 m, (B) 1 m, (C) 1.5 m, (D) 1.8 m. |
|
|
|
Fig. 6. Magnetic field distribution for four levels: (A) 0 m, (B) 1 m, (C) 1.5 m, (D) 1.8 m. |
|
|
|
Fig. 7. Magnetic field distribution, plane X–Y, for four levels: (A) 0 m, (B) 1 m, (C) 1.5 m, (D) 1.8 m. |
As can be seen in Fig. 4 , the intensities of the electric field calculated at the level of 1 m above the ground for example, reach maximum values at the middle position of the structure (2,995 V/m) and the fields' strengths decrease under the pylons centers (1,760 V/m).
At the same time, the maximum values of the magnetic field (Fig. 6 ) calculated are higher under Pylons A and B and lower at the middle of the structure (15 m). At 1 m high above the ground for example the corresponding values are 2.73 μT and 2.41 μT, respectively.
Fig. 5 and Fig. 7 visualize respectively the capacitive and inductive coupling between the two structures in the plane X–Y, they highlight the effect of the highs above the ground on the distribution of the electric and magnetic field in the vicinity of both the 220-kV lines.
There is a slight difference between the experimental and analytical field intensities (6%), this difference does not have to be attributed to the model of calculus, but to the simplifying assumptions and to the process of each technique.
The values of fields calculated for the levels 0 m, 1 m, 1.5 m, and 1.8 m above the ground remain very inferior to the maximum limit (5 kV/m) established by ICNIRP standards.
3.5. Numerical results
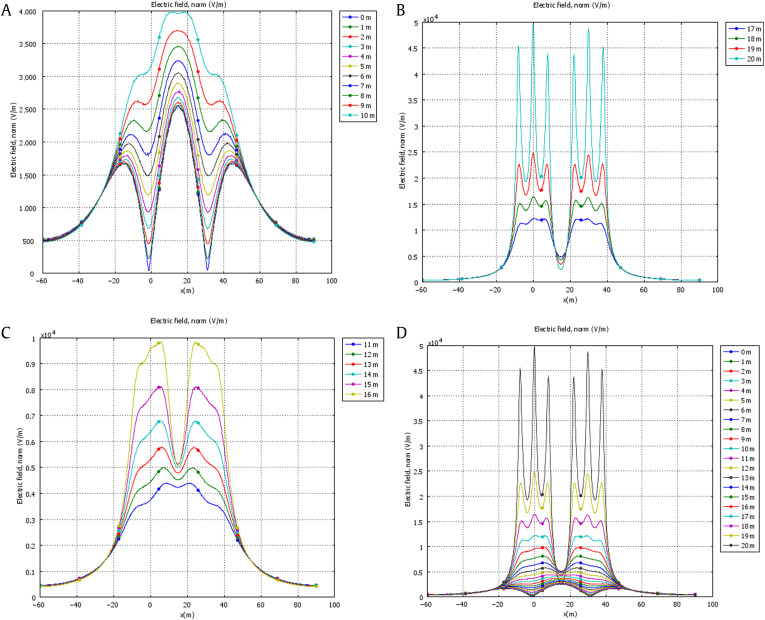
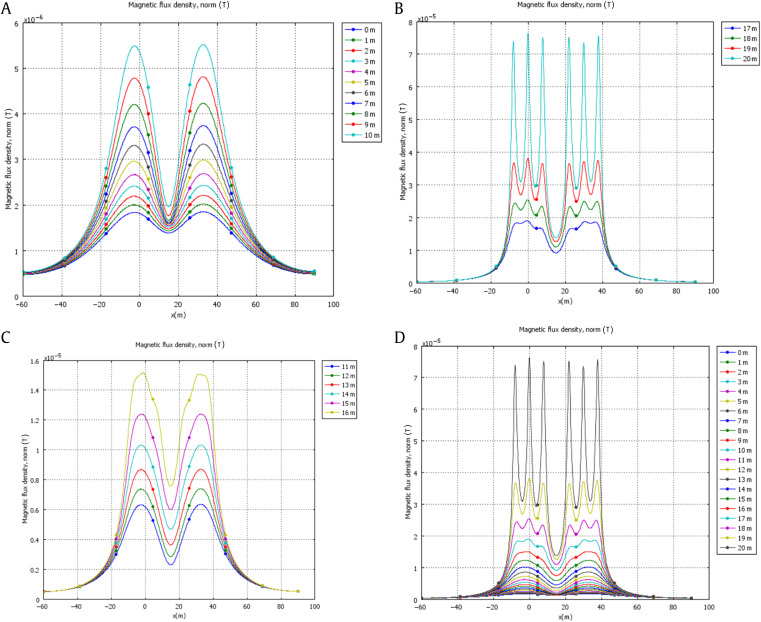
Fig. 8 and Fig. 9 show the simulated profiles of the electric and magnetic fields in the vicinity of the circuit of high voltage lines depending on the distance to several levels starting with level 0 m which represents the ground from to the level close to the location of the phases 20 m. For good visualization of the results we plotted the results on three curves, for the higher levels the strength of the electric fields simulated increase rapidly when the capacitive coupling between the two structures decrease with a significant amount. The profile of the electric field simulated at ground level (1 m) is similar to that measured.
|
|
|
Fig. 8. Simulated of electric field for the levels: (A) 0–10 m, (B) 17–20 m, (C) 11–16 m, (D) 0–20 m. |
|
|
|
Fig. 9. Simulated of magnetic fields for the levels: (A) 0–10 m, (B) 17–20 m, (C) 11–16 m, (D) 0–20 m. |
The same numerical modeling of the magnetic field profiles has been shown in three curves. The first one represents the value of electric or magnetic for the distance between 0 m and 10 m, the second between 11 m and 16 m, and the last between 17 m and 20 m. The magnitudes of magnetic field increase close to the line conductors at the same time the inductive coupling between the two 220-kV lines decrease from the 11-m level. The measured values approach those calculated, the difference is due to the extrapolation of electrical and geometrical data in the numerical simulation software.
4. Conclusion
This work has investigated the impact of the electromagnetic field generated by a circuit of two 220-kV lines located in eastern Algeria within a very high populated zone in the environment. An experimental and theoretical characterization of the electric and magnetic charges quantities has been conducted for the levels 0 m, 1 m, 1.5 m, and 1.8 m which affect the sensitive parts of the human body in case of power frequency fields exposure. The implications of the experimental results compared with current standards show that, the multi-lines power system studied present levels of electric and magnetic fields at levels 0 m, 1 m, 1.5 m and 1.8 m above the ground that in no case surpass the ICNIRP standards.
Analytical modeling results coincided with the experimental values recorded; therefore the model developed for calculus could be useful to approach theoretical lines study inside high voltage electrical posts. Numerical modeling based on the FEM method, recommended for the analysis of complex circuit configurations including levels close to line phases has allowed us to draw the profiles of electric and magnetic fields that are similar to those obtained by analytical modeling.
Experimental measurements for the other levels, 1–20 m, are scheduled in the framework of a research project in collaboration with the SONELGAZ, Annaba (Algerian Company of production of electricity).
Drawing on the ICNIRPs standards, we plan to set own national standards for exposure to electromagnetic fields, in order to achieve a regional database that will be at the disposal of partners concerned to ensure safety of people and mainly workers inside high voltage electrical substations.
Conflicts of interest
All authors have no conflicts of interest to declare.
Acknowledgments
This work is supported by the Ministry of Higher Education and Scientific Research of Algeria, in partnership with the Algerian company of electricity production SONELGAZ. The authors would like to thank Mr. Boulahbal Aref chief operating division of the company SONELGAZ (GRTE Annaba-Algeria).
References
- [1] M. Atudori, M. Rotariu; Electromagnetic field radiation near power lines and its environmental impact; UPB Sci Bull, 74 (2012), pp. 231–238
- [2] Milutinov M, Juhas A, Prša M. Electric and magnetic field in vicinity of overhead multi-line power system. Proceedings of the 2nd International Conference on Modern Power Systems MPS 2008; 2008 Nov 12–14; Cluj-Napoca, Romania. 2008.
- [3] A.Z. El Dein; Magnetic field calculation under EHV transmission lines for more realistic cases; IEEE Trans Power Del, 24 (2009), pp. 2214–2222
- [4] A.Z. El Dein, M.A.A. Wahab, M.M. Hamada, T.H. Emmary; The effects of the span configurations and conductor sag on the electric field distribution under overhead transmission lines; IEEE Trans Power Del, 25 (2010), pp. 2891–2902
- [5] El Dein AZ, Wahab MAA, Hamada MM, Emmary TH. Effect of towers' displacement and phases' arrangements of parallel two circuits OHTLs on their electric field distribution. Proceedings of the 2nd International Conference of Energy Engineering ICEE-2; 2010 Dec 27–29; Aswan, Egypt. High Institute of Energy. 2010.
- [6] D. Dib, H. Ali, C. Fayçal; The return-stroke of lightning current, source of electromagnetic fields (study, analysis and modelling); Am J Applied Sci, 4 (2007), pp. 42–48
- [7] K.H. Chiang, K.W. Tam; Electromagnetic assessment on human safety of mobile communication base stations at University of Macau; Am J Applied Sci, 5 (2008), pp. 1344–1347
- [8] European Commission. Les Champs Electromagnétiques Eurobaromètre Spécial 272a/Vague 66.2-TNS, Janvier–Février 2006;5:43–53 [in French].
- [9] Organisation Mondiale de la Santé (OMS) Champs Électromagnétiques et Santé publique: fréquence Extrêmement basses (ELF). Aidemémoire No: 205, 1998 [in French].
- [10] International Commission on Non-Ionizing Radiation Protection; Guidelines for limiting exposure to time-varying electric, magnetic, and electromagnetic fields (up to 300 GHz); Health Phys, 74 (1998), pp. 494–552
- [11] IEEE Societies and the Standards Coordinating Committees of the IEEE Standards Association (IEEE-SA) Standards Board. IEEE standard for safety levels with respect to human exposure to radio frequency electromagnetic fields, 3 KHz to 300 GHz. IEEE std c95.1. 1999 ed. Institute of Electrical and Electronics Engineers; 1999.
- [12] W. Tourab, A. Babouri, M. Nemamcha; Experimental study of electromagnetic environment in the vicinity of high voltage lines; AJEAS, 4 (2011), pp. 209–213
- [13] Tourab W, Babouri A, Nemamcha M. Characterization of the electromagnetic environment at the vicinity of power lines. Proceedings of the 21st International Conference and Exhibition on Electricity Distribution CIRED11; 2011 Jun 6–9; Frankfurt, Germany. 2011.
- [14] Tourab W, Babouri A, Nemamcha M. Characterization of high voltage power lines as source of electromagnetic disturbance. Proceedings of the 16th International Conference and Exhibition on Electromagnetic Compatibility CEM2012; 2012 Apr 25–27; Rouen, France. 2012.
- [15] Tourab W, Babouri A, Nemamcha M. Experimental and theoretical modeling of the electric and magnetic field behavior in the vicinity of high voltage power lines. Proceedings of the International Conference on Electrical, Computer, Electronic and Communication Engineering ICECECE 13; 2013 Jun 27–28; Paris, France. 2013.
- [16] A. Babouri, A. Hedjiedj, L. Guendouz; Experimental and theoretical investigation of implantable cardiac pacemaker exposed to low frequency magnetic field; J Clinical Monit Comput, 23 (2009), pp. 63–73
- [17] Babouri A, Hedjiedj A. In vitro investigation of eddy current effect on pacemaker operation generated by low frequency magnetic field. Proceedings of the 29th IEEE EMBS Annual International Conference; 2007 Aug 23–26; Lyon, France. 2007.
- [18] A. Babouri, A. Hedjiedj, L. Guendouz, J.P. Andretzko; The behaviour of dual chamber pacemakers exposed to a conducted low frequency disruptive signal; Int J Physiol Meas, 27 (2006), pp. 725–736
- [19] IEEE Standard Procedures for Measurement of Power Frequency Electric and Magnetic Fields From AC Power Lines, IEEE Std. 644–1994.
- [20] Narda Safety Test Solutions. System for the Electromagnetic Fields Measurement. Users Manual PMM 8053B. Document 8053 BEN-80805-3.03. Italy: NARDA; 2007.
- [21] C. Garrido, F. Oterio, J. Cidrasi; Low-frequency magnetic fields from electrical appliances and power lines; IEEE Trans Power Del, 18 (2003), pp. 1310–1319
Document information
Published on 07/10/16
Licence: Other
Share this document
Keywords
claim authorship
Are you one of the authors of this document?
