Abstract
Most of the local cities of Japan are suffering from the depopulation in central district (C.D.). In Okayama city, the government had induced some strategies such as supply more condominiums for local revitalization since 2000. From the Basic Resident Register of Okayama, the population in C.D. Okayama has increased recently. This study has the goal to clarify the situation of condominium supply in this district by an investigation. Compared with the result of a same survey in C.D. Kyoto, the following findings are confirmed: population recovery is happening in the central district in both of the 2 cities. The dimension of the condominiums in Okayama is larger than that in Kyoto. The average dimension of the condominiums in Okayama is 14 stories building with 61 units of 110 m2 . Contrastingly, that in Kyoto is 11 storied building with 59 units of 82 m2 . Most of the condominiums in C.D. Kyoto are located closely to the railway or subway station, while those in C.D. Okayama are randomly located, because of the high dependence of automobile traffic. The previous usages of the sites of condominiums in Okayama are parking, housing and financial institute, and in Kyoto they are parking, shop or business building.
Keywords
Condominium ; Population recovery ; Dimension ; Location ; Original land-use
1. Introduction
During the economic bubble in Japan, the influx of people to cities led to housing in fringe areas around the city, which at the time was a realistic solution to resident demands. Following the collapse of the economic bubble, however, land prices in the urban center have continuously fallen. At the same time, suburban residents were tired of the excessive time spent on commuting, and increasing numbers preferred to live near the urban center. These new residential needs have recently caused a construction boom for apartments in central areas of Japanese metropolises. In the central area of Kyoto city—Nakagyo-ku and Shimogyo-ku, the population has continually increased since 1999. Statistics indicate that this population recovery is due to the supply of newly built apartments and the opening of a new subway line (General Planning Bureau of Kyoto city, 2005 ).
On the other hand, most of the local cities of Japan are suffering from the depopulation in central district (C.D.) during the last 20 years. In Okayama city, the population in central district was decreased more than 4% from 1990 to 1995. Especial in the area of 1 km around Okayama station, the rate of decrease is more than 10%. The Okayama city government induced some strategies for local revitalization since 2000, including supplying more condominiums in the central district.
For the above reason, both in big cities and in local cities, the supply of newly built condominiums are increased in recent years. Investigation of condominiums in Kyoto city had been made in 2006. It clarified the condominium distribution in Kyoto city before and after 1999, and the supply and locations of condominiums in the central district of Kyoto those were completed from 1999 to 2006. The increased supply of condominiums has led to population recovery and a conversion of Kyoto to a more compact form (Tang, 2010 ).
To clarify the situation in local city, recently, we made an investigation in C.D. Okayama. This study has the goal to clarify the condominium supply and distribution in Okayama. And compared with the findings confirmed from the investigation in Kyoto, this study prefers to find the difference between big city and local city.
2. Investigation of the condominium supply
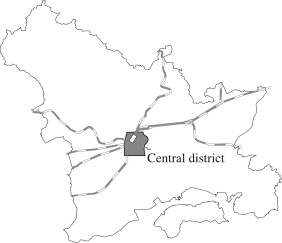
The investigation was made from August to September 2008. The Okayama city government induced some strategies for local revitalization since 2000, including supplying more condominiums in the central district. The investigation focused on the newly-built condominium completed from 2000 in the central district of Okayama (C.D. Okayama). C.D. Okayama is an area of 6.14 ha around Okayama station (Fig. 1 ). By the data of national population census in 2005, the population here is about 45,717 in 2005, and the population density is 7446 people/km2 . Table 1 shows the above basic information in C.D. Okayama city and in the central district of Kyoto city (C.D. Kyoto).
|
|
|
Fig. 1. Map of Okayama city (gray area is the investigation area). |
| Area (ha) | Population (by national population census in 2005) | Population density (people/km2 ) | |
|---|---|---|---|
| C.D. of Okayama | 6.14 | 45,717 | 7446 |
| C.D. of Kyoto | 14.2 | 179,464 | 12,638 |
The general information of the buildings, such as gross floor area (GFA), number of storey, height, floor-area ratio, number of dwelling unit, etc., are acquired by inspecting the construction outline in advertisements that published in real estate website.1 Locations of these condominiums were also identified and marked on the Digital Atlas Z map.2 By comparing the new residential map and that of 10 years before,3 we got the original land-use in each site. The survey was made both in Okayama and in Kyoto.
3. Results and discussion
3.1. Supply of condominiums built in the central district of Okayama
During the study period, the central district of Okayama contained a total of 132 condominiums. Of these, 52 were built since 2000, supplying 3169 dwelling units (see Appendix ).
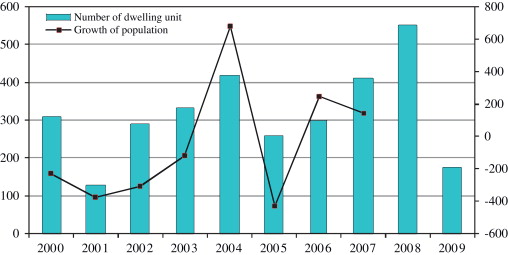
Table 2 presents annual variation in the supply of condominiums built in the central district from 2000 to 2008. From 2000 to 2004, the supply, represented as total gross floor area (GFA), increased, and a major construction boom took place from 2002 to 2004. Supply decreased in 2005, and another construction boom is shown from 2006 to 2008. These condominiums supply 3169 dwelling units to residents in the central district; that is, at full occupancy, more than 3000 households moved to the central district of Okayama during this period. Fig. 2 illustrates the growth of population from 2000 to 2007 in investigation area and the number of dwelling units supplied. The rate of change is similar for both these values, indicating that the supply of new condominiums was a primary factor in the population growth of the central district. The same situation was also shown in the result of Kyoto city (Tang, 2010 ).
| Year of complete | Total GFA (m2 ) | Number of object | Number of dwelling unit | Average GFA of 1 unit (m2 ) |
|---|---|---|---|---|
| 2000 | 28,749.8 | 7 | 308 | 93.3 |
| 2001 | 14,725.1 | 3 | 128 | 115.0 |
| 2002 | 27,816.2 | 4 | 290 | 95.9 |
| 2003 | 37,927.4 | 6 | 332 | 114.2 |
| 2004 | 46,768.1 | 4 | 418 | 111.9 |
| 2005 | 22,091.2 | 5 | 259 | 85.3 |
| 2006 | 29,827.7 | 6 | 301 | 99.1 |
| 2007 | 42,902.9 | 6 | 409 | 104.9 |
| 2008 | 47,048.7 | 9 | 550 | 85.5 |
| 2009 | 24,493.0 | 3 | 174 | 140.8 |
| Total | 322,350.1 | 53 | 3196 | – |
|
|
|
Fig. 2. Relationship between supply of condominiums and growth of population in C.D. Okayama. |
During the study period, almost all of the dwelling units of the condominiums are family type, with the GFA of more than 55 m2 . There is no one-room dwellings in these newly built condominiums. The average GFA of the dwelling units is 110 m2 . While from the investigation of Kyoto, 20% of units were one-room dwellings, indicating a one-person household. Because approximately 49% of all households in Nakagyo-ku and Shimogyo-ku were composed of only one person.3 The average GFA of dwelling units in Kyoto city is only 81 m2 .
As we know, there are serious building height restrictions in Kyoto city, so that the newly-built condominiums could not be built higher than 45 m, even in some area it could not higher than 30 m. From Table 3 , the average number of floor of condominiums in C.D. Kyoto is 11 stories, and that in C.D. Okayama is 14 stories. The highest condominiums in Kyoto is 15 stories, while in Okayama is 32 stories. Average number of units in 1 condominium in Kyoto and in Okayama seems the same. Above this, the newly-built condominiums in C.D. Okayama have larger dimension than those in C.D. Kyoto. This reflects the different need and resident level in the two cities.
| Average GFA of unit (m2 ) | Average height (stories) | Average number of unit in 1 condominium (units) | |
|---|---|---|---|
| C.D. of Okayama | 110 | 14 | 61 |
| C.D. of Kyoto | 81 | 11 | 59 |
3.2. Locations of newly-built condominiums
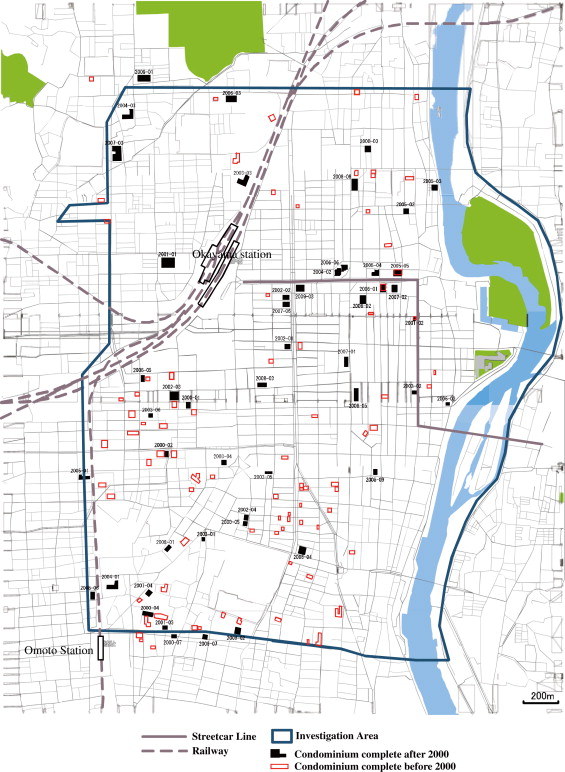
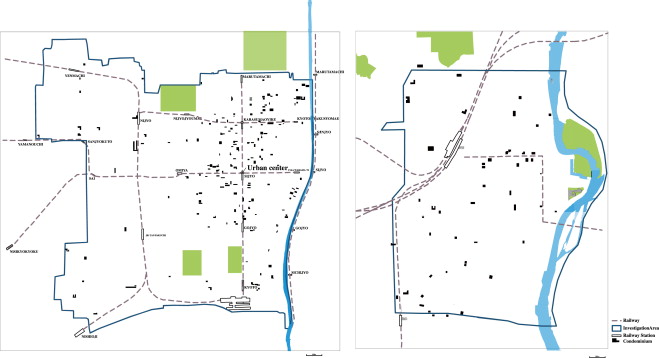
Fig. 3 presents the locations of condominiums in C.D. Okayama. And Fig. 4 illustrates the distributions of the condominiums in C.D. Okayama (right), and those in C.D. Kyoto (left).
|
|
|
Fig. 3. Location of condominiums in C.D. Okayama. |
|
|
|
Fig. 4. Distributions of the condominiums in C.D. Okayama (right), and those in C.D. Kyoto (left). |
In Kyoto, there is a well-defined urban center “Karasuma-Sijyo”. From Fig. 4 left, it is clear that most of the condominiums were located near the railway stations or subway stations, especially the 2 stations that are close to the urban center. In the central area of Kyoto city, the personal trip depends on the public transport. So condominium developers used building sites near the urban center to provide commuting convenience to the urban center, which is an important housing requirement.
While in Fig. 4 right, we cannot find the rule of the distribution of condominiums. There has no obvious urban center. The condominiums are not located in the area that very closely to Okayama station. It is because there is no subway in this city and the mainly public transport is bus and streetcar. Both of them are inconvenience, most of the personal trips are made by private car.
3.3. Original land-use of the sites
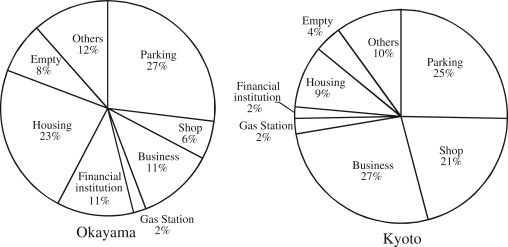
The original usage in each site of condominium is used to clarify the transformation of the land-use in central district of a city. The original usages are classified into 9 types, including parking, empty, shop, office, house etc. The results of survey are shown in Table 4 and Fig. 5 .
| No. | Original usage | C.D. Okayama | C.D. Kyoto |
|---|---|---|---|
| 1 | Parking | 14 | 43 |
| 2 | Shop | 3 | 35 |
| 3 | Business building/company | 6 | 45 |
| 4 | Gas station | 1 | 4 |
| 5 | Financial institution | 6 | 3 |
| 6 | Housing | 12 | 16 |
| 7 | Empty space | 4 | 7 |
| 8 | Others | 6 | 17 |
| Total | 53 | 170 | |
|
|
|
Fig. 5. Proportion of original land-use in C.D. Okayama and in C.D. Kyoto. |
Both in the two cities, around 25% of the sites are used as parking and 2% of them are used as gas station in past years. The differences are, in C.D. Okayama, 23% of the condominiums are built in the sites which are originally housing site. But in Kyoto city the proportion is only 9%. In Okayama, some of the sites are transformed from private housing earth, some of them are transformed from company dormitory. Conversely, the proportion of business building or company and shop in Kyoto (27% and 21%) is higher than that in Okayama (11% and 6%). Another difference is much more sites of financial institute are turned to the sites of condominiums in C.D. Okayama (11%) than in C.D. Kyoto (2%).
4. Conclusions and perspectives
This study has the goal to clarify the situation of condominium supply in C.D. Okayama by conducting an investigation. Compared with the survey on the condominiums in C.D. Kyoto, which was made 2 years ago, we got the following findings:
Population recovery is happening in the central district in both of the cities. Especially in local city, stopping the decrease in population is a very hard task, and Okayama is now out of common.
The dimension of the condominiums in Okayama is larger than that in Kyoto. The average dimension in Okayama is 14 stories building with 61 units, and GFA of each unit is 110 m2 . And that in Kyoto is 11 storied building with 59 units of 82 m2 . It shows that the level of living in Okayama is higher than in Kyoto.
Most of the condominiums in C.D. Kyoto are located closely to the railway of subway station. Conversely, those in C.D. Okayama are randomly located, because of the high dependence of automobile traffic.
The sites of condominiums in Okayama are mainly transformed from the sites of parking, housing and financial institute, and while in Kyoto they are mainly transformed from sites of parking, shop and business used land.
Acknowledgments
This research has been made possible with the help of Humanities and Social Science Research Foundation (09YJCZH030 ) of Ministry of Education and National Social Science Funds (10CSH040 ) in China, and Ph.D. Programs Foundation of Ministry of Education of China (20100092120066 ).
Appendix
See Table A1 .
| Number | Original site usagea | Site area (m2 ) | Ratio of area to lot | Total GFA | Number of stories | Number of units | Average unit area (m2 ) | Arrange of unit area (m2 ) | |
|---|---|---|---|---|---|---|---|---|---|
| 2000 | |||||||||
| 1 | 2000–01 | P | 1355.82 | 4 | 5418.0 | 14 | 47 | 115 | 68.10–157.60 |
| 2 | 2000–02 | P | 1005.71 | 3.99 | 4012.8 | 13 | 48 | 84 | 76.85–85.35 |
| 3 | 2000–03 | H | 610.46 | 2 | 1220.9 | 6 | 11 | 111 | |
| 4 | 2000–04 | Unclear | 2340.03 | 4 | 9360.1 | 14 | 93 | 101 | 66.53–99.53 |
| 5 | 2000–05 | Unclear | 851.48 | 4 | 3405.9 | 15 | 42 | 81 | |
| 6 | 2000–06 | Unclear | 1908.9 | 2 | 3817.8 | 10 | 47 | 81 | 68.24–81.32 |
| 7 | 2000–07 | B | 757.13 | 2 | 1514.3 | 8 | 20 | 76 | 55.86–98.06 |
| 2001 | |||||||||
| 8 | 2001–01 | P | 6554 | 6 | 10,898.8 | 21 | 90 | 121 | |
| 9 | 2001–02 | B | 137.21 | 5 | 686.1 | 8 | 8 | 86 | |
| 10 | 2001–03 | G | 785.07 | 4 | 3140.3 | 11 | 30 | 105 | 70.54–82.10 |
| 2002 | |||||||||
| 11 | 2002–01 | H | 608.29 | 5 | 3041.5 | 13 | 24 | 127 | 82.45–144.84 |
| 12 | 2002–02 | O | 1623.82 | 6.6 | 10,717.2 | 23 | 95 | 113 | |
| 13 | 2002–03 | P | 2660.35 | 4 | 10,641.4 | 14 | 129 | 82 | 63.86–85.92 |
| 14 | 2002–04 | E | 854.04 | 4 | 3416.2 | 15 | 42 | 81 | |
| 2003 | |||||||||
| 15 | 2003–01 | P | 588.23 | 4.93 | 2900.0 | 13 | 29 | 100 | 69.28–154.72 |
| 16 | 2003–02 | P | 609.07 | 5 | 3045.4 | 14 | 37 | 82 | |
| 17 | 2003–03 | E | 6095 | 3.6 | 21,943.2 | 15 | 147 | 149 | 77.39–120.37 |
| 18 | 2003–04 | F | 2012.4 | 13 | 26 | 77 | |||
| 19 | 2003–05 | P | 938.53 | 5 | 4692.7 | 14 | 55 | 85 | |
| 20 | 2003–06 | P | 833.48 | 4 | 3333.9 | 14 | 38 | 88 | 75.32–122.72 |
| 2004 | |||||||||
| 21 | 2004–01 | E | 3305 | 4 | 13,221.4 | 14 | 130 | 102 | 64.05–100.15 |
| 22 | 2004–02 | P | 1787.62 | 7.6 | 18,908.3 | 32 | 130 | 145 | 51.79–171.20 |
| 23 | 2004–03 | S | 3551.11 | 2 | 7102.2 | 9 | 72 | 99 | 71.97–149.60 |
| 24 | 2004–04 | H | 3768.14 | 2 | 7536.3 | 10 | 86 | 88 | 66.56–88.65 |
| 2005 | |||||||||
| 25 | 2005–01 | P | 2987.68 | 2.66 | 7947.2 | 10 | 89 | 89 | 66.01–110.97 |
| 26 | 2005–02 | H | 267.54 | 4 | 1070.2 | 11 | 20 | 54 | 42.22–58.40 |
| 27 | 2005–03 | H | 2109.6 | 6 | 19 | 111 | 75.59–137.55 | ||
| 28 | 2005–04 | F | 6 | 5367.6 | 14 | 79 | 68 | 55.3695.53 | |
| 29 | 2005–05 | S | 932.77 | 6 | 5596.6 | 14 | 52 | 108 | 77.79–120.31 |
| 2006 | |||||||||
| 30 | 2006–01 | F | 1364.48 | 6 | 8186.9 | 18 | 93 | 88 | 64.68–123.80 |
| 31 | 2006–02 | P | 2462.4 | 12 | 33 | 75 | 56.57–71.34 | ||
| 32 | 2006–03 | H | 3952.8 | 13 | 45 | 88 | 77.58–142.64 | ||
| 33 | 2006–05 | B | 3096.0 | 10 | 54 | 57 | 54.5–70.5 | ||
| 34 | 2006–06 | F | 1240.65 | 7.14 | 12,129.6 | 29 | 76 | 160 | 70.00–170.44 |
| 2007 | |||||||||
| 35 | 2007–01 | B | 808.77 | 6 | 4852.6 | 14 | 51 | 95 | 83.11–104.63 |
| 36 | 2007–02 | F | 1409.38 | 6 | 8456.3 | 23 | 121 | 70 | 47.83–200.01 |
| 37 | 2007–03 | B | 4690.33 | 2 | 9380.7 | 14 | 94 | 100 | 72.28–104.50 |
| 38 | 2007–04 | H | 1322.4 | 4 | 5289.6 | 14 | 52 | 102 | 78.00–105.58 |
| 39 | 2007–05 | P | 958.91 | 2 | 1917.8 | 7 | 24 | 80 | 64.52–94.18 |
| 40 | 2007–06 | H | 2117.68 | 5 | 13,005.9 | 15 | 67 | 194 | 80.68–102.72 |
| 2008 | |||||||||
| 41 | 2008–01 | H | 588.89 | 6 | 3533.3 | 14 | 52 | 68 | 65.47–98.49 |
| 42 | 2008–02 | S | 614.2 | 6 | 3685.2 | 14 | 63 | 58 | |
| 43 | 2008–03 | O | 1275.31 | 4 | 5101.2 | 12 | 66 | 77 | 61.12–88.06 |
| 44 | 2008–04 | P | 1064.44 | 3.96 | 4215.2 | 13 | 61 | 69 | 53.60–65.72 |
| 45 | 2008–05 | B | 2029.08 | 6 | 12,174.5 | 15 | 112 | 109 | 86.44–120.88 |
| 46 | 2008–06 | H | 1216.37 | 2 | 2432.7 | 10 | 29 | 84 | 75.66–84.04 |
| 47 | 2008–07 | P | 1330.13 | 4.12 | 5478.4 | 14 | 53 | 103 | 72.8–94.9 |
| 48 | 2008–08 | H | 1035.62 | 5 | 5178.1 | 13 | 60 | 86 | |
| 49 | 2008–09 | F | 877.14 | 4.99 | 5250.0 | 15 | 54 | 97 | 62.58–109.81 |
| 2009 | |||||||||
| 50 | 2009–01 | E | 2279.82 | 2 | 4559.6 | 15 | 45 | 101 | |
| 51 | 2009–02 | H | 798.03 | 3.34 | 2663.1 | 10 | 37 | 72 | 53.12–64.59 |
| 52 | 2009–03 | O | 1888.63 | 7 | 17,270.3 | 20 | 92 | 188 | 57.38–106.58 |
a. P: parking, B: business building, H: housing, O: others usage; F: financial institute, E: empty space and G: gas station.
References
- General Planning Bureau of Kyoto city, 2005 General Planning Bureau of Kyoto city, 2005. .
- Tang., 2010 P. Tang.; An evaluation of CO2 emission reduction based on the supply of condominiums in Central Kyoto ; Journal of Asian Architecture and Building Engineering (2010), pp. 63–70
Notes
1. http://www.mansionbank.com/Mansion Bank, A real estate website of the condominiums in Okayama, including the information of more than 400 condominiums.
2. A PC map software “Digital Atlas Z Series” developed by ZENRIN CO., LTD.
3. Data are from the “ZENRIN Residential map—Okayama No. 1-2008” and “ZENRIN Residential map—Okayama No. 1-1999”.
Document information
Published on 12/05/17
Submitted on 12/05/17
Licence: Other
Share this document
Keywords
claim authorship
Are you one of the authors of this document?
