Abstract
Open public spaces provide venues for cultural, recreational events and promote informal social contact between citizens. Successful outdoor spaces promote comfort and invite people to stay outdoors. Provision of thermal comfort outdoors present a challenge, as an extended range of environmental conditions must be dealt with. The present study examines whether climatic characteristics in Dublin facilitate exercising long-term outdoor activities during summer, and investigates the extent to which urban planning and the resulting urban morphology of the built environment influences microclimates created, from the viewpoint of wind environment. Microclimates at Grand Canal Square have been simulated by ENVI-met. Wind velocity has been expressed in relation to that of the “background” climate in order to verify if the site has a wind protecting character or to the contrary, it enhances airflow. The results show for the dominant wind directions (W, SW, S) that 60% higher wind velocity than at Dublin Airport can occur around building corners and at restricted flow sections—preventing any kind of long-term outdoor activity during a “typical” day. S and SW winds cause 15%–20% acceleration at the W waterfront area. Windy urban environment can call forth a limited frequentation of urban space.
Keywords
Human thermal comfort ; Microclimate ; Wind ; Urban planning ; PET ; ENVI-met ; RayMan ; Dublin ; Grand Canal Square
1. Introduction
Open public spaces provide venues for cultural events, commercial activities, recreation and promote informal social contact between city dwellers through their various functions. Successful public spaces invite people to spend time outdoors and they create “life” in a city. Much social interaction takes place between buildings: people sitting on park benches, others waiting for a bus at a station, pedestrians walking by, a group of people chatting and having a drink on a café terrace, children playing with fountains, a busker entertaining shoppers ( Erell et al., 2011 ). These various outdoor activities are influenced by a number of conditions. Physical environment including air movement, temperature distribution, and solar access, together with the architectural design affect the perception of users, related to particular places (Gehl, 2011 ). The architects' mission consists in the shaping of both environmental and morphological (building and vegetation form, size, geometry, orientation etc.) parameters.
Urban design determines the quality of urban life that is related to physical and climatic ambiance but also to social aspects: cities are social products and not results of unconnected events emerging spontaneously (Pahl, 1975 ). Moore (2008) adds that cities reflect the societies that have shaped them and they actively participate in shaping human behavior.
The Earths population is growing rapidly. According to the 2010 Revision of World Urbanization Prospects United Nation Report 50.5 per cent or 3.5 billion of the people on Earth were living in cities in 2010. The number of urban dwellers is drastically increasing: more than 84 per cent of the global population is expected to become urban by 2050 (United Nations, 2010 ). The urban population is exposed to various strains urban environment implies: noise, odors, exhaustion due to accelerated lifestyle, various kinds of air pollution, light pollution and last but not least thermal stress (Unger, 1999 ). Public spaces such as squares, waterfront promenades and parks provide places for rest, recreation and various kinds of informal social activity. Research focusing on comfort and health in open urban spaces, and the global quality of urban life is growing (Thorsson et al ., 2003 ; Gál and Unger, 2006 ; Emmanuel et al ., 2007 ; Andrade and Alcoforado, 2008 ; Blocken and Carmeliet, 2008 ; Knez and Thorsson, 2008 ; Alcoforado et al ., 2009 ; Égerházi et al ., 2009 ; Andrade et al ., 2011 ). A growing urban population implies more and more people frequenting outdoor public spaces—urging a change in planning attitude: the adoption of a health and comfort focused design approach. Urban planning projects are interdisciplinary in nature, and as a consequence they require cooperation between the actors of all involved disciplines: climatology, architecture, urban planning, landscape architecture, sociology and biometeorology, to name a few.
The present study explores Irish climate characteristics in relation to wind comfort at outdoor locations, through a case study—an urban square situated at the vibrant city core in a regenerated urban quarter, the Docklands of Dublin. The selected urban space, the Grand Canal Square, forms a substantial part of the Docklands cultural quarter and provides space also for recreation. The research studies the link between contemporary urban planning in Ireland and the created urban microclimates through the example of a cultural city quarter. This topic is timely, as urban policy makers promote creation of cultural and mixed use environment for living, working and entertainment, as part of place boosterism and marketing strategies, in the hope of attracting investment (Fox-Rogers, 2011 ). In addition, cities promote outdoor, healthy living and urban design that encourages citizens to engage in recreational activities.
The core strategy of the Dublin City Development Plan 2011–2017 evokes shaping Dublins character through transforming the citys form and structure into a compact, green, well connected and quality mixed use environment (Dublin City Council, 2007 ). This strategy implies health conscious city planning and provision of cultural and recreational facilities within the city core—again, also in the spirit of place boosterism. It is therefore likely that the number of cultural quarters will grow in the future and more urban squares of this character will emerge as this policy approach continues to be in vogue (Fox-Rogers, 2011 ).
2. The climate of Ireland
Ireland is situated on the very western boundary of Europe, between latitude 51° and 55°N and longitude 5° and 10°W. The two major elements shaping Irelands climate are the proximity of the Atlantic Ocean (and the Gulf Stream) and the westerly atmospheric circulation that ensures Irelands climate is dominated by maritime influences (Rohan, 1975 ). Irelands climate may be described as middle-latitude, marine west-coast (Cfb according to Köppens classification (Péczely, 1979 )).
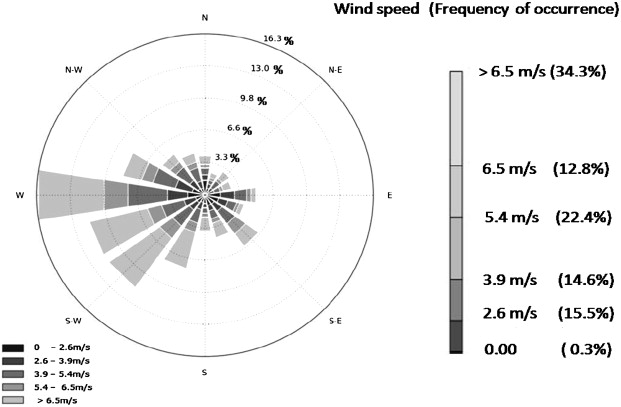
The island has a mild climate with a small annual temperature range around a mean temperature of 9 °C. Precipitation occurs throughout the year with receipt ranging from 800 to 2800 mm across the country. Mean annual wind speed is consistently high, with mean values of 7 m/s in the northwest. The prevailing wind directions are westerly and south-westerly, off the Atlantic Ocean. Dublins climate is slightly less windy and wet than the average for Ireland. However, the mean annual wind speed is high: 6 m/s. Figure 1 depicts the wind rose for Dublin Airport. It shows the frequency of occurrence of different wind speed intervals as percentage of the total time period, in function of the direction. Winds occur from the prevailing wind directions (W, WSW, SW, SSW and WNW) 57% of the total time period of wind occurrence.
|
|
|
Figure 1. Wind rose for Dublin. The numbers of the scale (3.3, 6.6, 9.8, 13.0 and 16.3) indicate in %, the fraction of the total time period of each wind speed interval, for each wind direction. Example: W winds exceeding 6.5 m/s occur about 6.5% of the year (difference between 16.3% and 9.8%). |
The numbers of the scale (3.3, 6.6, 9.8, 13.0 and 16.3) indicate in %, the fraction of the total time period of each wind speed interval, for each wind direction. Example: W winds exceeding 6.5 m/s occur about 6.5% of the year (difference between 16.3% and 9.8%).
Although the annual rainfall in Dublin is just 1000 mm, it receives this over 150 days as low intensity events (IMS, ; Szűcs and Mills, 2011 ). Not surprisingly then, cloud cover is often extensive and the annual number of bright sunshine hours is relatively low. Rain and high winds are the two sources of outdoor discomfort in Dublin - presenting a challenge in urban design. Atmospheric variables, altered by the convoluted morphology of urban areas, determine to a great extent the environmental quality of outdoor spaces and therefore thermal comfort of citizens frequenting them. In spite of its relevancy, the question of human thermal and wind comfort has received little attention in outdoor locations in Ireland; a study produced by Leech (1985) on summer thermal comfort in relation to adverse effect of rain seems to be the sole available publication in the field.
To compensate this paucity, the present study aims to shed light on the wind characteristics in a recently refurbished urban environment through a case study.
The presence of cities modifies natural wind conditions at regional, local and microclimatic scales. A city represents an ensemble of convoluted aerodynamic obstacles in forms of buildings, and mitigates wind velocity at regional and local scales. However, at microclimatic scale buildings can also call forth substantial increase in wind velocity. Urban morphology results in numerous microclimates even within one city quarter, that are shaped by sun-shade, airflow–wind shelter, temperature and humidity—the quasi “invisible” but perceptible elements of architecture. Architects and planners need to consider climatic and human aspects during the design process; otherwise urban spaces will not function and operate according to the architectural concept. In an Irish climatic context, high wind speeds associated with shade and low temperatures can result in adverse biometeorological effect, such as lower frequentation of public spaces.
Therefore, the airflow characteristics of the selected site have been compared to those of Dublin Airport. The last is the chosen as reference site that presents practically identical wind characteristics as the case study site. The two sites are situated relatively close to each other, close to the seashore and there is no significant topological obstacle between them. Therefore it is assumed that the case study site with no buildings, would be characterized by very similar airflow features as Dublin Airport.
Comfortable wind velocity ranges, in function of the activity exercised outdoors, have been defined by the American Society of Civil Engineers (ASCE)—based on 20% probability of exceedance. Table 1 depicts the wind velocity values—that signify both mean wind velocity and gust equivalent mean velocity (UGEM ). The UGEM is the ratio of the peak 3 s-long gust exceeded about once every 5 to 10 min and the representative fixed gust factor, G , typically taken as about 1.85 ( ASCE, 2003 ).
| Activity | Comfortable ranges (m/s) |
|---|---|
| Sitting | 0–2.6 |
| Standing | 0–3.9 |
| Walking | 0–5.4 |
| Uncomfortable for any activity | >5.4 |
Other authors refer to similar threshold values: Gandemer and Guyot established a maximum average wind velocity of 5 m/s as a general outdoor comfort limit, with a turbulence intensity of 0.2, i.e., 1 m/s and proposed an average wind velocity of 3.0 m/s with a turbulence intensity of 0.2, i.e., 0.6 m/s for long outdoor stay and sedentary or very moderate physical activity, such as following a football match at an open stadium or having at drink at a terrace (Gandemer and Guyot, 1976 ; CSTB, 2002).
Safety criteria are stricter, regarding the probability of exceedance, than wind comfort criteria. The gust speeds that are sufficient to blow people over have been estimated by various authors and are in the range of 15–30 m/s, depending on other factors including the size, weight, reaction time, health and clothing of the person (ASCE, 2003 ). If these wind thresholds are exceeded two or three times a year, the chance of someone being injured becomes unacceptably high. Two or three times per year corresponds to an occurrence of 0.1% of the time (ASCE, 2003 ).
The wind rose for Dublin Airport indicates that high wind velocities (exceeding the 5.4 m/s threshold) are frequent from W, WSW, SW, SSW and WNW directions; and they occur during about three-quarter of the total time period. Regarding all directions, during daytime (between 9 am and 9 pm) wind exceeds the 5.4 m/s wind comfort threshold value during 872 h of the year and results in excessive wind, unsuitable for any type of outdoor activity. Table 2 illustrates wind data collected at Dublin Airport for year 2005. It indicates that during more than 80% of the year—altogether 3873 h out of 4745—wind conditions are suitable to exercise outdoor activity in Dublin during the day, according to the ASCE criteria.
| Wind direction | Length of time period suitable for various activities–expressed in hours | ||||
|---|---|---|---|---|---|
| Sitting (0–2.6 m/s) | Standing (2.6–3.9 m/s) | Walking (3.9–5.4 m/s) | Uncomfortable (>5.4 m/s) | Total | |
| Calm | 5 | 0 | 0 | 0 | 5 |
| North | 218 | 183 | 247 | 79 | 727 |
| East | 345 | 251 | 231 | 42 | 869 |
| South | 223 | 195 | 473 | 256 | 1147 |
| West | 375 | 414 | 713 | 495 | 1997 |
| Total | 1166 | 1043 | 1664 | 872 | 4745 |
3. Study area
Dublin is one of the most popular tourist destinations in Europe with visitor numbers exceeding 6.6 million per year. Most of the visitors, almost 50%, come from the UK and a third from Europe Mainland (NTDA, 2010 ). Visitors welcome outdoor and semi-outdoor locations where they can enjoy cultural and retail facilities. Compared to cities with similar climate characteristics and latitudes, there are few facilities available in Dublin inviting people to spend outdoors for a longer time period. In the past, the focus on establishing indoor comfort has detracted attention from the outdoor climates, which for much of the year in Ireland, is suitable for outdoor activities.
3.1. Historical overview
The case study area, the Grand Canal Square is part of the most dynamic quarters of Dublin, the Docklands and is located on the E side of the city close to the Liffey River estuary. The area belonged to the once prosperous Dublin port and hosted principally trade related activity. During the twentieth century, changing in cargo handling technology, namely the adoption of containerisation – resulting in the abandonment of manual work – and also the reduction of international passenger movement by ferry due to air travel cost decrease, which led to the restructuring of the port. As a consequence, some tracts of land were filled with industrial functions: until the 1970s the Grand Canal Dock was synonymous with the production of the town gas (Moore, 2008 ). The location of gasworks where the town gas was produced from imported coal took advantage of the availability of water. The gas production gave rise to a number of by-products that were used for the chemical industry. The redevelopment of this industrial site was far from straightforward: the legacy of contamination had to be dealt with before raising private sector interest. The Docklands area became one of the most strategically sited brownfield sites in Ireland, and aspired to the establishment of a vibrant, mixed-use development (Moore, 2008 ).
Since the 1970s Dublin discovered new roles and attracted global economic institutions (international banking, finance and insurance industry). This economic transformation gave rise to complex social, economic, cultural and ecological alterations. The city began to be marketed as an attractive commodity that could be bought by investors and generates economic growth (Moore, 2008 ). The aim of the Docklands regeneration was to transform a brownfield area and to re-integrate it within the city. The Dublin Docklands Development Authority leading the transformation had the mission—as the slogan states—to create an exemplary European urban quarter:
“We will develop the Dublin Docklands into a world-class city quarter paragon of sustainable inner city regeneration - one in which the whole community enjoys the highest standards of access to education, employment, housing and social amenity and which delivers a major contribution to the social and economic prosperity of Dublin and the whole of Ireland. ” ( DDDA, 2011 )
3.2. Urban planning context
The rejuvenation of Dublins Docklands provided an opportunity for planners and developers to take advantage of the potential offered by the waterfront to create a vibrant urban quarter. This type of urban transformation is not unusual: it presents some aspects of resemblance with cities that have undergone economic, social and physical restructuring from Cape Town to St. Petersburg and from Boston to Tokyo (Moore, 2008 ), and it fits within the broader context of urban entrepreneurialism where cities compete to market themselves for investment (Fox-Rogers, 2011 ). A key means of urban entrepreneurialism, also in the case of Dublin, is adopting “successful” regeneration schemes from elsewhere with the results (economic, social) that other cities with similar waterfront developments have (Fox-Rogers, 2011 ). The redevelopment of this large urban quarter became a central element of the “Celtic Tiger” success associated with turn-of-the-millennium Ireland. Although the Docklands project initially emerged with the aim of providing solutions to the inner citys economic and social crisis, the redevelopment became strongly interconnected with national and global economic demands. The project became a spur for wider urban marketing measures to attract global investment (Moore, 2008 ).
The insertion of the square into the local urban tissue remedies one of the most striking planning concerns that existed in the Docklands in the 1980s: the lack of open public space and recreational amenities in the area. The urban regeneration project of the Docklands promoted the idea of the city as a location not only for business but also for living blended with cultural facilities. While the project presents successful aspects, it has borrowed little from its wider urban context; there is nothing particularly Irish about Dublin Docklands (Moore, 2008 ). In contrast to the dramatic improvement on the dereliction that once characterized the docklands, the “bland sameness” featuring the post-industrial, high-tech architectural articulation of “a new anonymous identity” present in cities in “global competition”—represents the downside of the development (Moore, 2008 ; Short, 1996 ).
3.3. The urban space case study
The Dockland transformation—that started in late 90s—facilitated the metamorphosis of derelict and depressed environments into vibrant urban quarters. The result is an “ensemble” of city quarters including the present case study.
The Grand Canal Dock development is anchored by a 0.6 ha “piazza”, the Grand Canal Square. The square is situated at the eastern end of the Grand Canal—a connection point between the canal system and the Port of Dublin. The Grand Canal square was designed by the landscape architect, Martha Schwartz. The square, including the surrounding performing arts center, the Grand Canal Theater, designed by the architect Daniel Liebeskind is the subject of the present study.
The provision of the cultural amenity is a primordial element of the planning strategy because it assured the attraction of a wide range of visitors to the site outside of the traditional working hours. The theater is juxtaposed by a luxury hotel designed by Manuel Aires Mateus and a tinted glass office building by Duffy Mitchell O'Donoghue Architects.
The study area measures about 250 m×250 m comprising the mentioned substantial buildings. The square itself has a solemn appearance: a “red carpet” reaches out from the theater towards the dock on a cantilever extension floating above the water.
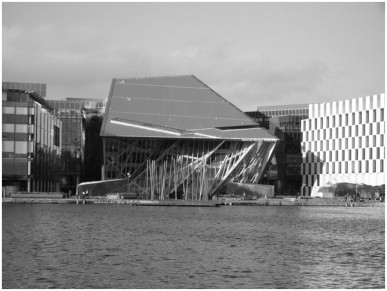
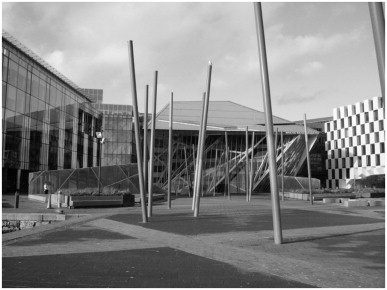
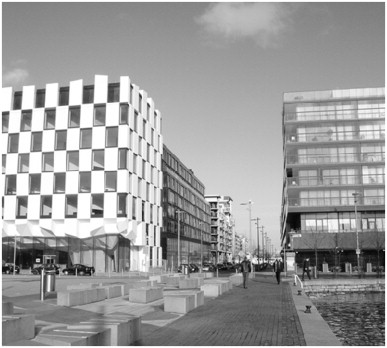
Oblique red sticks lit at night, planted to the ground emphasize this allegoric location—a “bridge” between the city and the sea (Figure 2 ). A vegetated “green carpet” crosses the red path over before the floating cantilever viewpoint. The square comprises granite-paved paths disposed in acute angles inciting the pedestrian to walk along them. Stone and metal benches provide place to rest, contemplate and enjoy the view of the dock and the closeness of water (Figure 3 ).
|
|
|
Figure 2. View of Grand Canal Square. |
|
|
|
Figure 3. View of Grand Canal Square with the theater in the center, office block to the left and hotel to the right. |
4. Thermal comfort and its assessment at outdoor locations
Human thermal comfort research has received little attention in outdoor locations in Ireland. As mentioned previously, a study on thermal comfort in summer in relation to the adverse effect of rain, carried out by Leech (1985) seems to be sole available source in the field. Thermal comfort indoors has received more focus, since it is regarded as directly related to health and productivity at work. However indoor comfort conditions and building energy consumption are strongly linked with outdoor climatic characteristics and deserve more attention. Citizens spend a considerable amount of time in public urban spaces, so the provision of comfort should be regarded as an environmental health question of paramount importance.
4.1. Energy balance of the human body
There is a significant difference in climatic loads and their amplitude the body is exposed to in an indoor and an outdoor environment. Extended ranges of environmental parameters, namely air temperature, air movement, humidity and radiation, are encountered outdoors compared to indoor environments: a light breeze experienced outdoors far more exceeds the velocities tolerated indoors (ASCE, 2003 ). Complaints of draughts are common in offices, in contrast same air velocities around the body, produced by a gentle walking pace are not perceived as uncomfortable (McIntyre, 1980 ). Wind represents one of the main differences between indoors and outdoors. The effects of wind on people can be divided into two categories: mechanical (direct effect of the wind force described by the Beaufort scale) and thermal (indirect effect on the thermal perception in combination with other climatic parameters) (ASCE, 2003 ).
Also, wider ranges of short and long wave radiation characterize outdoor locations. The radiant asymmetry caused by direct sunshine is far higher than the level regarded as comfortable in case of an indoor radiant heating system, yet people welcome and seek sunshine (McIntyre, 1980 ). The human body does not have selective sensors for the separate perception of all these individual climatic parameters and it can only register the overall thermal perception by thermoreceptors and make thermoregulatory response to any change in skin temperature and blood flow passing the hypothalamus (Höppe, 1999 ).
We are homeotherm, with a deep body temperature of 37 °C. This temperature must be maintained at a near constant value so that health is conserved. The constant deep body temperature is maintained by heat- and vapor-transport processes occurring within the body itself, at the skin surface and/or clothing surface. Heat is also transferred by breathing, from the body core towards the environment. The energy budget of the human body must account for all the exchanges—occurring in the form of radiation, convection and conduction. The exchanges (forms of energy transport) include at an outdoor environment:
- direct solar radiation,
- diffuse short- and long-wave radiation from the sky, ground, and other surfaces,
- reflected short-wave radiation,
- emitted long-wave radiation,
- convective sensible and latent heat exchanges (surface-air exchanges),
- conduction of heat into the substrate or adjacent surfaces.
Environmental conditions that the body is exposed to can, however, be attenuated, filtered or enhanced by architectural means, e.g., a canvas or vegetation can provide shading on a terrace, a wall can act as a windbreak or intensify airflow etc. Spagnolo and de Dear (2003) classify open, as well as covered or partially covered spaces, containing man-made building elements that provide some protection from the outdoor environmental conditions. The effect of environmental parameters cannot be eliminated in outdoor and semi-outdoor locations.
The overall thermal quality assessment of outdoor locations in Leechs study took into account the part of each day considered to be available in practice for recreation after omitting the “time lost” due to precipitation. Leech notes that in Ireland rain significantly limits the time available for outdoor activity:
“There is no doubt that , in practice the time lost to informal outdoor recreation due to precipitation is generally appreciably greater than its strict duration. Desire to avoid getting wet will usually cause abandonment of the activity before rain has started , and a delay in quitting shelter until the subsequent cessation of the rain seems well established.” ( Leech, 1985 )
Leechs study suggests that in spite of the rainy periods, there remains a considerable proportion of time during that climatic conditions are suitable for outdoor activity in light summer attire. Regarding thermal preference, he notes that as temperature rises above 18 °C in summer, conditions can become much too warm for comfort in Ireland. Temperatures of about 25 °C with a moderate wind of 1 m/s and an average center-day intensity of diffuse and direct radiation are regarded as unacceptably hot (Leech, 1985 ).
Thermal comfort, especially in outdoor locations is a great challenge to assess, since numerous environmental, personal (e.g., physiological and psychological) factors are involved: McIntyre (1980) outlines that thermal discomfort depends certainly on context, and that people carry their own environmental standards in them, based on their “thermal history” or experience. New stimuli are assessed towards and compared with the general experience. An environmental situation will be qualified “comfortable” or “uncomfortable” relative to experience and also expectation (Nikolopoulou et al ., 2001 ; Nikolopoulou and Steemers, 2003 ; Nikolopoulou and Lykoudis, 2006 ).
Nikolopoulou et al. evoke the role of adaptation and differentiate three forms of adaptation: physical, physiological and psychological. Physical adaptation involves changes such as altering clothing level, activity, posture, metabolic level (reactive adaptation) or altering the environment (interactive adaptation), such as opening a parasol. Physiological adaptation signifies the change in the physiological responses resulting from the repeated exposure to a particular stimulus. The repeated exposure causes a decreased strain, called physiological acclimatization. Psychological factors, such as naturalness, expectations, time of exposure, environmental stimulation, perceived control and experience also influence thermal perception of a space (Nikolopoulou and Lykoudis, 2006 ).
Design of urban spaces cannot alter all climatic components: it cannot change the outdoor rainfall apart from providing covered walkways and building canopies. However, there are a number of design strategies that can manage the outdoor wind environment—the main challenge in terms of climatic ambiance in an Irish context—and promote the use of outdoor spaces (Szűcs and Mills, 2011 ). High winds, accentuated by the convoluted morphology of the urban tissue, prevent open urban space use and can pose serious safety concerns, such as people losing footing.
Walton et al. (2007) points out that modern architecture and urban planning combined facilitate the adaptation of wind, sun and thermal conditions of inner city spaces, to mitigate or to enhance airflow and provide sunshine or shade. Understanding thermal comfort in outdoor settings has the potential to deliver benefits for the design and development of public spaces.
4.2. Thermal comfort indices
The perception in relation to the thermal ambience surrounding humans has been approached by empirical thermal comfort indices, such as wind-chill index (Steadman, 1971 ) or the apparent temperature (Steadman, 1979 ) that attempt to describe the combined effect of several environmental parameters, but they do not account for thermal physiology (Höppe, 1999 ). Thermal comfort models, such as Fangers PMV (Predicted Mean Vote) and its adapted version to complex radiation situations outdoors (Jendritzky and Nübler, 1981 ) known as Klima Michel Model were designed to calculate an integral index for the thermal component of climate and not for providing detailed information on thermoregulatory processes of the human body. Höppe mentions as an example that Fangers approach considers solely activity and clothing for mean skin temperature and sweat rate calculations and it does not take into account climatic conditions at all (Höppe, 1999 ). In contrast, the Munich Energy-balance Model for Individuals (MEMI) takes into account both environmental parameters and the bodys physiological responses to thermal strains. MEMI is the basis the basis for the calculation of the index PET—Physiological Equivalent Temperature (Höppe, 1984 ; Höppe, 1994 ). The PET index was introduced by Höppe and Mayer (1987). It expresses the thermal conditions at a given indoor or outdoor location in terms of the equivalent air temperature of a typical indoor setting (reference climate) that is required to maintain the heat balance of the body. The reference climate is described by the following parameters: MRT (Mean Radiant Temperature which is the average temperature of the surrounding surfaces, each weighted by the solid angle is subtends at the measurement point (Szokolay, 2008 )) equal to air temperature, air velocity is 0.1 m/s, water vapor pressure is 12 hPa (approximately equivalent to a relative humidity of 50% at 20 °C), 80 W of working metabolic rate added to basic metabolism, 0.9 clo of clothing heat resistance.
PET has been widely used in outdoor microclimate and comfort studies (Bouyer et al ., 2007 ; Gulyás et al ., 2006 ; Kántor and Unger, 2010 ; Oliveira and Andrade, 2007 ; Andrade et al ., 2011 ; Oliveira et al ., 2011 ) and has proved its adaptability to predict climatic load individuals are exposed to.
Bouyer et al. (2007) suggested, that PET values should be regarded together with wind conditions and various heat fluxes, as high PET values at a semi-outdoor location, in an open stadium, can both be due to intense solar radiation and high (even unacceptable) wind velocity or less air movement and less solar radiation.
Höppe (1999) remarks that various meteorological factors have different levels of importance depending on the weather situation: air temperature has more importance than mean radiant temperature on a windy day, since wind intensifies convective heat exchanges. In contrast, on days with moderate wind or the absence of air movement, MRT and air temperature have roughly the same importance from the viewpoint of human thermal comfort. The complex interactions of the relevant meteorological factors are only quantifiable in a realistic way by the means of heat balance models.
Leech (1985) employed the Predicted Mean Vote (PMV) model in his study to assess thermal conditions outdoors in summer. He notes that the PMV has been developed for steady state environmental conditions and therefore might not be suitable for comfort assessment outdoors. He outlines the dynamic character of environmental conditions outdoors: “a change occurring in the environmental conditions, might take appreciable time to have its effect on the thermal sensation of a person, and before it happens, another change might have occurred”.
Regarding wind speed, the study does not contain any thorough exploration on the applicability of the PMV model in case of high wind speeds. Leech (1985) demonstrated that climatic conditions in Kilkenny (the study site) are suitable for prolonged outdoor stay, both for sitting or light physical activity, such as walking. He underlined the advantage of the wind shelter in the Irish climate: compared to an open, wind-exposed site, the duration of thermally comfortable period is about 30% longer at a site protected by a wind screen that attenuates the wind velocity by 60%.
5. Materials and methods
First, the history of Dublin Docklands and the drivers of modern urban planning that have shaped the Dublin Docklands during the last few decades have been apprehended. Then, thermal comfort has been modeled computationally for the background climate, for the chosen reference year 2005, by the thermal comfort and microclimate simulation tool RayMan, using the thermal comfort index PET (Matzarakis et al ., 1999 ; Matzarakis et al ., 2007 ). The PET index has been chosen because it provides information on the global thermal environment taking into account both the environmental parameters and the physiological reaction of the human body.
Another reason is that PET values are easily to interpret, even for non-professionals of human physiology or bioclimatology, since PET is expressed in °C and it refers to a reference thermal environment mentioned above (Paragraph 4.2 Thermal comfort indices).
The thermal comfort analysis for the background climate has been completed by the distinct assessment of wind environment at the reference site, Dublin Airport, since wind—representing one of the main differences between indoors and outdoors (Bosselmann and Arens, 1995 )—is an influential parameter of bioclimate at open urban spaces. Airflow patterns have been modeled by ENVI-met software package, at Grand Canal Square created by Bruse and Fleer (Bruse and Fleer, 1998 ; Bruse, 2004 ).
5.1. Computational modeling of urban wind environment
Computational modeling, compared to physical measurements requires a computer in contrast to sophisticated measurement equipments, techniques (e.g., in case of airflow characterization—hot wire anemometer, wind tunnel, PIV—Particle Image Velocimetry) and physical models, used to carry out physical experiments. In case of computational modeling, a virtual model replaces the physical model. The abstract virtual model of an urban fragment can be modified relatively easily compared to physical model building. The simulation—depending on the resolution—might take several hours, days, weeks.
The model used for the present study is able to simulate microscale interactions between urban surfaces, vegetation and the atmosphere. It allows analyzing and apprehending the impact of small scale changes in urban design and landscape (for example: tree plantation, insertion of new buildings, replacement of mineral surfaces by vegetal ones etc.) on the microclimate (Bruse and Fleer, 1998 ). According to the available scientific literature, ENVI-met gives an adequate estimation of wind velocity, compared to observation and can be regarded as a valid tool for studying tendencies in airflow characteristics (De Maerschalck et al., 2010 ).
The selected urban quarter has been computationally modeled in order to study airflow characteristics by the means of computational simulation. The airflow characteristics have been described both by absolute and relative values, for the three most frequently occurring wind directions: W, SW and S. The absolute values give information on the specific wind speed belonging to specific locations (each grid point) in case a given reference wind speed. The relative wind velocity is the ratio between the computationally simulated wind velocity at the urban site and that recorded at the reference site, at Dublin Airport. In this manner tendencies regarding mean wind velocity in function of wind direction of the studied urban fragment can be studied—both in terms of relative and absolute values. Furthermore, the nature of the site from ventilation viewpoint can be determined, i.e . if it is of protecting character, and provides shelter from wind compared to an exposed, open “farmland” type site, or to the contrary, enhances airflow.
The purpose of the simulation was to create wind velocity maps in order to detect and depict wind-sheltered areas and zones of intense ventilation. High wind speed occurring between buildings can be, in extreme cases, the source of wind related accidents (e.g., people losing balance and footing) or it can disturb and/or disrupt recreational, cultural or social activities taking place at urban outdoor locations.
Airflow simulations have been carried out for a reference wind velocity of 8 m/s (at 10 m height) that occurs relatively frequently at Dublin Airport. At pedestrian height (at the center of gravity of an average adult: 1.1 m) at an open and unobstructed “farmland” type site it means about 5.8 m/s using the following equations (Gandemer and Guyot, 1976 ):
|
|
( 1) |
where
is the wind velocity at a height z
is the wind velocity at 10 m height (measured at the meteorological station)
α is the exponent of altitudinal swell determined by the surface roughness (0.14 for farmland type site)
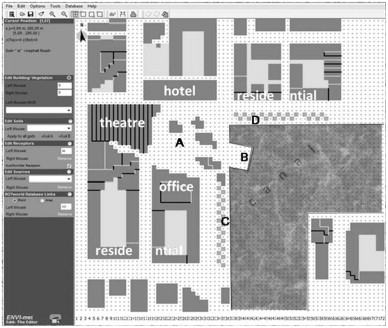
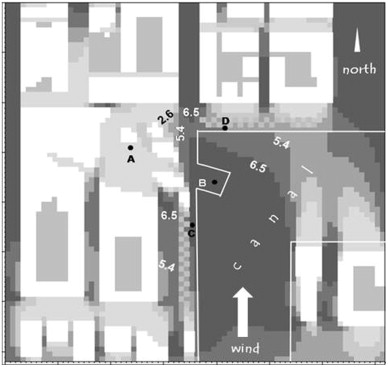
Four representative locations have been selected on the Grand Canal Square and the adjacent waterfront areas to describe typical (characteristic) wind conditions at the given site (Figure 4 ): point A—center point of the square, B—viewpoint at the end of the cantilever slab extending towards the canal, C—western waterfront, D–—northern waterfront (Szűcs and Mills, 2011 ).
|
|
|
Figure 4. Area input file representing Grand Canal Square with the theater, hotel, office and residential buildings and selected spots of interest (A) center of the square, (B) cantilever viewpoint extending over the water surface, (C) westerly waterfront, (D) northerly waterfront. |
5.1.1. ENVI-met
ENVI-met takes into consideration the interplays between buildings, vegetation and various surface coverings—all affecting the atmospheric conditions. The model is complex similarly to the real environment. ENVI-met consists of five model groups:
- The atmospheric model—calculates the air movement, three-dimensional turbulence, temperature, relative humidity and takes into account obstacles such as building and vegetation. The maximal height of the model is 2500 m. The variation of radiation due to vegetation and shading is also considered.
- The surface model—calculates the emitted long wave-, and the reflected shortwave radiation from the different surfaces, taking into account the incident long-, and shortwave radiation. It considers the albedo of the surfaces, the shading in function of the solar path and calculates the water vapor evaporation from the vegetation and the transpiration from the soil, taking into account the airflow-modifying effect of the vegetation. It is adapted to model flat surfaces.
- The vegetation model–calculates the foliage temperature and the energy balance of the leaves taking into account the physiological and meteorological parameters. The vegetation is characterized by the normalized leaf area density (LAD) and the normalized root area density (RAD). The evaporation rate and the turbulence calculation are based on the airflow fields around the vegetation and the tree shape. The evaporation rate at the leaf surface–regulated by the stomata–is affected by the heat exchange between the leaf and its environment. The absorption characteristics of the foliage are calculated in function of the sun path and the projected shade (Bruse and Fleer, 1998 in Balázs, 2008 ).
- The soil model—calculates the thermo-, and hydrodynamic processes in the soil and takes into account the combination of the natural and artificial surfaces of the urban quarter in question. The soil model can also calculate heat exchanges between a water body and its environment (Bruse and Fleer, 1998 in Balázs, 2008 ).
- The biometeorological model—calculates the PMV index from the meteorological data.
ENVI-met requires input data that are contained in two files: the area input file and the configuration file. The area input file consists of a three dimensional grid that is used to outline buildings, vegetation and ground surfaces. The configuration file contains the date, the chosen time period of study (length of simulated time period), time step, roughness length of the selected urban quarter and meteorological data related to the simulation, such as wind velocity and direction at 10 m height, specific humidity at 2500 m height, relative humidity and atmosphere temperature at pedestrian height.
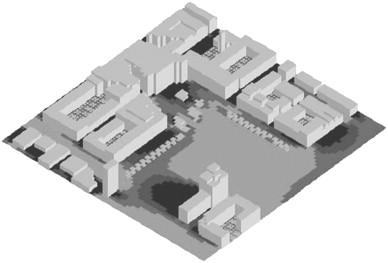
Figure 5 represents the three dimensional simplified model of the selected urban setting from a birds eye view. It depicts the abstracted building volumes and the vegetation (trees and lawn) surrounding the Grand Canal Square and the adjacent waterfronts.
|
|
|
Figure 5. Three-dimensional model of the area showing vegetation and building volumes. |
The view has been produced by the interactive visualization and analysis tool for ENVI-met: Leonardo. Leonardo is part of the ENVI-met software package.
6. Results and discussion
At a first instance, thermal comfort has been studied through the calculation of PET (Höppe and Mayer, 1987) at the chosen reference, or background site, the Dublin Airport, that is considered representative of natural climatic conditions, not disturbed by the presence of any physical obstacles (buildings) of the city.
The PET thermal comfort index has been calculated by the model RayMan, for the summer months of the chosen reference year: 2005. The PET—contrary to the PMV—has been “par excellence” designed both for indoor and outdoor situations. It takes into account both the environmental characteristics and the physiological response of the human body to the thermal strains of the environment.
Finally, the most relevant climatic parameter that influences thermal comfort of pedestrians at an Irish context in urban environments, the wind has been modeled by the ENVI-met program package at the Grand Canal Square in order to inform on the extent urban morphology alters the natural wind conditions.
6.1. Thermal comfort
The PET has been calculated for summer months, by the radiation and thermal bioclimate model RayMan, based on meteorological data recorded at Dublin Airport, namely dry bulb temperature (DBT), relative humidity (RH), global radiation and wind speed (Matzarakis et al., 2007 ).
The extension of the conventional PET comfort interval (18–23 °C) used for continental Europe is proposed based on Leechs statement on thermal comfort temperature range, considering thermal experience and expectation aspects. He suggests in his comfort study that in an Irish climatic context, 25 °C with a light wind (1 m/s) and average early afternoon intensity of direct and diffuse solar radiation is perceived as uncomfortably hot. He adds, that in case temperatures rise above 18 °C in summer, thermal conditions can become much too warm for Ireland, i.e., thermal preference is shifted towards lower temperatures (Leech, 1985 ).
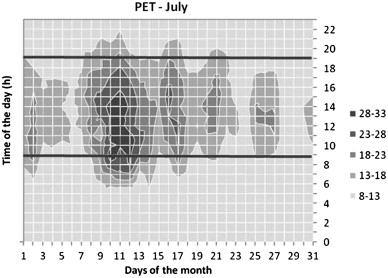
Therefore, this research takes into account an adapted comfort interval of 13–23 °C, to an Irish bioclimatic context. Figure 6 illustrates an example of the PET chart for July 2005, at Dublin Airport, at the height of the pedestrian.
|
|
|
Figure 6. Example of PET chart for Dublin Airport for July 2005. |
The darker the zone, the higher the PET value. The lightest zone indicates PET values under 13 °C, regarded as thermally discomfortable (cold), while the two darkest zone represent warm discomfort.
Slight warm discomfort outdoors is often tolerated and can be regarded as acceptable if people have the opportunity to move to a sheltered location or alter clothing. Based on the PET calculations, summer months of 2005 can be regarded as a thermally comfortable during daytime since presenting favorable characteristics for long-term outdoor activity, except for a limited number of days when permanent rainfall prevented outdoor activity.
The PET index enables anyone, not conversant with the fields of biometeorology or thermophysiology to assess the thermal component of climate based on his own experience (Höppe, 1999 ). The PET values refer to a reference indoor situation that is conceivable for anyone. When dealing with thermal comfort outdoors it cannot be ignored that people actively adapt to microclimatic conditions. They increase or decrease clothing, limit or prolong exposure time, sit in favorable locations (Walton et al., 2007 ). Regarding the influence of various environmental parameters on human thermal comfort outdoors, Walton et al. (2007) have separately evaluated the contribution of various environmental parameters to thermal comfort, namely that of wind, sun and temperature; and found that the maximum wind gust factor was the most influential in predicting adaptability. It was followed by and associated with 10-minute mean wind speed.
6.2. Wind environment
The airflow simulation results, presented in terms of advised activity types per location for the five wind directions (Table 3 ), show that discomfort occurs for S and SW wind directions, i.e., higher wind speed than the 5.4 m/s threshold occurs. The most exposed points to wind are situated in the direct vicinity of the Grand Canal: the northern and western waterfronts and the cantilever viewpoint. Nonetheless, the “bay” of the Grand Canal Square remains protected for all tested wind directions.
| Location/Wind direction | South | West | South-west |
|---|---|---|---|
| A —square “bay” | Standing (<3.9 m/s) | Sitting (<2.6 m/s) | Sitting (<2.6 m/s) |
| B —cantilever | Discomfort (>5.4 m/s) | Standing (<3.9 m/s) | Discomfort (>5.4 m/s) |
| C —waterfront W | Discomfort (>5.4 m/s) | Sitting (<2.6 m/s) | Discomfort (>5.4 m/s) |
| D —waterfront N | Walking (<5.4 m/s) | Walking (<5.4 m/s) | Walking (<5.4 m/s) |
Various wind velocity zones—characterized by absolute wind velocity values—are shown on Figure 9 for S wind direction, for a summer day with average wind conditions. In case of southerly wind the Grand Canal Square “bay”—depicted by point A—remains sheltered from wind. The square is situated in the low pressure field (called also “wake zone”) of the hotel building and therefore is protected by it. Wind velocities remain below the critical 5.4 m/s value, so the location is suitable for any type of long-term outdoor activity (sitting, standing, walking etc.) during summer months.
The threshold values in terms of mean wind velocity allow calculating the approximate wind gust pedestrians are expected to be exposed to. Gandemer et al. suggest the following approximation of the gust speed (Gandemer and Guyot, 1976 ; Gandemer and Guyot, 1981 ):
|
|
( 2) |
where
is the gust speed
is the mean wind velocity
is the standard deviation of the wind velocity from the mean wind value
The 5.4 m/s mean wind velocity threshold corresponds to a gust speed of about 11 m/s. This wind velocity corresponds to the 6th class of the Beaufort scale qualified as “strong breeze” (Gandemer and Guyot, 1976 ; Gandemer and Guyot, 1981 ). On land this class is characterized by the movement of larger tree branches and whistling in wires. On the sea larger waves of 8–13 ft appear and whitecaps become common. Strong breeze, nevertheless, does not cause significant difficulty in walking. The wind velocity, critical from security viewpoint because it can project pedestrians to the ground, based on physical and aerodynamic criteria is about 15 m/s (Gandemer and Guyot, 1976 ; Gandemer and Guyot, 1981 ).
6.2.1. South wind direction
South winds occur about 24% of the total time period, during daytime.
The simulated airflow pattern changes drastically within short distances and results in intense ventilation at the western waterfront (point C) and the cantilever extending over the canal (point B). Both areas are situated in the alignment of the NS oriented canyon street joining into the square from the north (Figure 7 ; Figure 8 ). The canyons restricted flow section accelerates airflow, in case wind direction is parallel to the longitudinal axis of the street.
|
|
|
Figure 7. Airflow pattern in case of S wind. Light gray colors indicate zones suitable for long term sitting and standing; middle gray those for walking. Dark gray depicts locations with average wind speed exceeding 5.4 m/s, i.e., unsuitable for the practice of any prolonged outdoor activity. |
|
|
|
Figure 8. View of Grand Canal Square from the western waterfront (point C) towards the north, along the longitudinal axis of the joining canyon. |
Western waterfront area including the cantilever is directly exposed to southerly winds. As a consequence, the immediate waterfront, where fixed benches and mineral cubes—essential elements of the urban scenery designed for rest and contemplation—are situated, is pretty windy. The inviting urban landscape contributes therefore little to promote long-term outdoor stay—such as reading a book, sipping a coffee or contemplating the reflection of sunlight on the water surface.
A relative wind velocity value of 0.5 means that compared to an open, natural site where no obstacles modify the airflow the wind velocity at the selected urban location is 50% lower. A value of 1.2, in this manner, signifies that the wind is 20% higher at the urban location than at Dublin Airport (reference meteorological site). This way of expression is didactic and easily understandable even for those not conversant with meteorology or wind engineering.
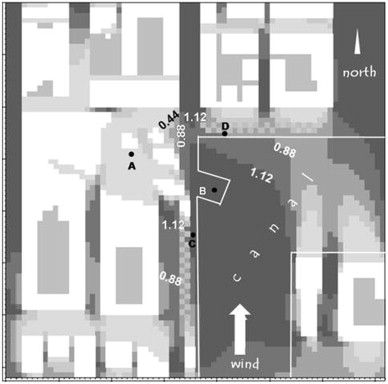
Figure 9 shows the airflow pattern in case of S winds, expressed in terms of relative wind velocity. It is depicted by the airflow maps that the urban tissue can intensify air movement in between buildings and can result in higher wind velocities than those experienced in Dublin Airport. S winds generate about 20% acceleration on the western waterfront (point C) and the cantilever viewpoint area (point B).
|
|
|
Figure 9. Airflow patterns in case of S wind expressed in terms of relative wind velocity, compared to the background climate. |
At the canyon entrance leading to the square 15% acceleration can be observed. In contrast, in the middle of the canyon 60% higher wind velocities can occur – compared to the reference wind speed at pedestrian height, at Dublin Airport!
The N waterfront (point D) remains protected due to its position. It is situated between canyons, and at the shelter of trees adjacent to the N shore of the canal. In this zone the wind velocity is reduced by about 40% compared to the reference point. The protective character of this area is favourable for enjoying the restaurants and terraces located there, right in front of the buildings facing the canal. The area right in front of the theatre, the square “bay” (point A) remains sheltered as well with very low velocities: about 50% lower than those occurring at Dublin Airport.
6.2.2. West and south-west wind directions
Figure 10 ; Figure 11 illustrate airflow patterns for wind of W and SW sectors—prevailing in Dublin; the provision of a comfortable and healthy outdoor environment for these wind directions is therefore of great importance. W winds occur more than 40% and SW winds more than 20% of the total time period, during daytime.
|
|
|
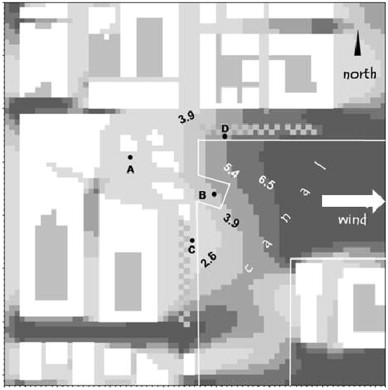
Figure 10. Airflow patterns in case of W wind expressed in terms of absolute, wind velocity. |
|
|
|
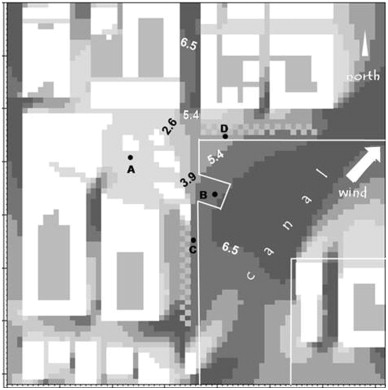
Figure 11. Airflow patterns in case of SW wind expressed in terms of absolute, wind velocity. |
Wind environment in case of W winds is adequate for long-term outdoor activity, practically on the entire studied area (Figure 10 ). Occurring wind velocities are adequate for exercising prolonged sitting (in point A), standing (in points B and C) and walking activity (in point D).
Airflow is accelerated by 15% in the canyon street with EW axis, situated in the S part of the study area. Even higher wind speeds occur on the building corner, close to the canal, where the airflow is deflected, detached from the building. Wind velocity at this area exceeds by 60% those measured at Dublin Airport. Pedestrians arriving from the wind sheltered square and circumventing the building will be exposed to significant wind blasts that can slow their march.
The square bay is well protected by the high theatre and office buildings: wind is reduced by 70–80% in this zone.
As a contrast, SW winds cause more perturbation regarding airflow: W waterfront including the viewpoint on the cantilever slab (point B) falls outside of the wake zone of the buildings and is exposed to SW airflow (Figure 11 ). As a consequence, point B presents discomfort due to excessive wind. In relative terms it means about 10–15% of exceedance compared to wind force at Dublin Airport. This phenomenon is of concern, since gusts almost twice higher than the reference wind might occur. In addition, the cantilever viewpoint is the preferred location of visitors, offering a magnificent view towards the canal, and also the “icon” of the square, the Grand Canal Theatre. The visitor experiences a feeling of “floating” above the water and has a closer contact with the water surface at this point.
Critically high wind speeds occur around sharp building corners, where the airflow detachment starts, and also in the canyon street leading towards the Liffey river, to the N. At building corners wind speeds exceed by 60–70% those at Dublin Airport, while in the canyon street by 15–20%. High buildings along narrow streets (in other words: canyon street or restricted flow section) oriented towards critical wind directions, enhance significantly the ventilation intensity. Canyon street conjugated with other phenomena, such as airflow detachment on building corners amplifies the airflow intensification. This can be observed in case of SW wind, in the vicinity of the theatre building, where high wind speeds occur in between two high buildings, on the corner of the theatre building (close to point A). Wind speed is about 30% higher in this zone, than at Dublin Airport.
6.3. Potential design interventions
Wind poses a veritable problem in this newly refurbished urban quarter that has been designed as a vibrant location where space between buildings (i.e., streets, urban squares, waterfront areas, malls etc.) has a key social role. Principally mineral surfaces and relatively modest quantity of vegetation – composed mainly of young trees and turf – characterise the location. Mobile wind protection, such as membrane structure, rigid windscreen or mobile vegetation shelterbelt could provide solution for the protection of the exposed zones, before young trees grow older. However, any intervention posteriori present a challenge to integrate to the existing urban landscape without hurting the original concept; and in addition, it might involve significant investment.
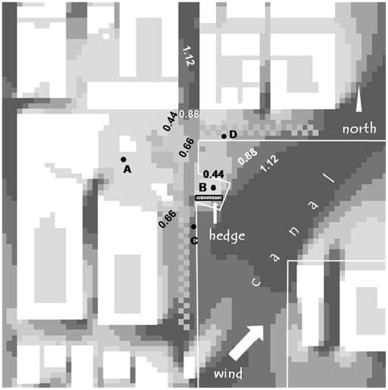
An alternative solution, namely placing 2 m high, 25 m long, dense hedge on the square in order to protect the cantilever viewpoint from S and SW winds has been studied by ENVI-met, in order to examine if a small scale intervention can ameliorate the wind conditions.
The results seem reassuring because the vegetation shelter protects the cantilever viewpoint (B); it significantly reduces wind speed to less than half of that measured at Dublin Airport. In this manner, the area becomes suitable even for long-term sitting activity. Figure 12 illustrates that airflow becomes more homogeneous on the square with wind speeds not exceeding those measured at Dublin Airport. Nevertheless, the NS oriented canyon street remains slightly strongly ventilated: the reference wind velocity is exceeded by 10–15%.
|
|
|
Figure 12. Airflow pattern with a 2 m high hedge shelter, for SW wind; expressed in terms of relative wind velocity. |
The obtained results are similar in case of S winds.
The example of a relatively modest intervention shows that the quality of the wind environment can be significantly improved by inserting provisional or permanent wind protection.
7. Conclusion
The study shed light on the consequences urban planning can have on wind comfort at an urban environment. The focus has been placed on wind, in the first instance, since it is the climatic parameter urban morphology and architectural design can have the most extended influence on. Wind has a great effect on human thermal comfort through its influence on both latent and sensible heat exchange. Its optimization is a key point in creating pleasant climatic ambiance in open urban spaces, especially in a naturally well vented geographical location, such as Ireland.
Increasing urbanization dedicates increasingly important role to public spaces, since with the growth of urban population, the number of people using these spaces augments as well. Besides social role, urban space helps maintain health and facilitates contact with nature. In addition, urban space use involves decrease in energy use inside the buildings, since less energy is used indoors while urbanites stay outdoors.
Urban spaces in Dublin have become focal point of urban planning and renewal strategy. The emergence of cultural quarters, functions within the city, and in a broader perspective that of the public realm—contributed to the transformation of the city and to the shaping of its image. Cities use particular buildings, spaces as “icons” to distinguish themselves from other cities while at the same time attempting to provide an urban realm that can be perceived as similar as in other European cities: safe, clean, commercially orientated and providing a social mix (Lawton, 2008 ). In this competitive context, wind environment and thermal comfort receive often less attention during the routine design process compared to aesthetical and commercial aspects. The physical transformation of the urban spaces in Dublin happened also with no significant attention devoted to climatic characteristics and ambience that results from this transformation. Nevertheless, orientation, size and positioning of buildings, streets, vegetation type, size, emplacement, surface covering material choice all affect thermal and airflow characteristics that the pedestrians using urban spaces are exposed to.
The example of Grand Canal Square demonstrates that within the protective urban tissue airflow intensity can be increased by the convoluted morphology of the urban quarter, compared to an open, obstacle free site. Great variation of wind velocities (4–5 m/s) occur within short distances calling forth discomfort at some locations.
In case of the prevailing W, S and SW winds the square bay, situated right in front of the theater remains well sheltered with relatively low wind velocity, reduced by 40–50% of the reference wind. In contrast, in case of S and SW winds both the cantilever viewpoint (point B) and the westerly waterfront area (point C) present wind velocities exceeding by 15–20% those measured at Dublin Airport. The airflow intensity is similar in the canyon street with NS axis, leading to the square—in case of SW wind. However, pronounced acceleration occurs in the canyon street in case of S wind: 60% increase compared to the reference wind—preventing any kind of long term outdoor activity. Similarly high velocities occur at building corners, in the southern part of the study area, close to the canal where the airflow begins to deflect from the building.
Space use and frequentation are, self intended, influenced by the microclimates featuring the place. Urbanites will probably prefer “crossing” the case study square instead of “staying” there and spending time, when severe wind conditions occur.
The study also demonstrates, that wind conditions can be significantly improved by a relatively small intervention, namely by the introduction of a 2 m high dense vegetation that acts as windscreen.
The idea of studying microclimate incorporates the aim of raising attention to available methods and tools that facilitate planning with health and comfort in mind. Urban planning decisions including landscape transformation, rejuvenation—all determine the thermal and aerodynamic conditions, the bioclimatic load users will be exposed to. Therefore the involvement of all relevant disciplines in the design process, cooperation and communication between various professionals (architecture, planning, climatology and biometeorology) is therefore of paramount importance.
Acknowledgements
The EMPOWER post-doctoral research project has been financed by the IRCSET—Irish Research Council for Science, Engineering and Technology .
The author expresses her gratitude to Gerald Mills for his guidance, Linda Fox-Rogers for her valuable comments, Dr. Bernadett Balázs, Dr. Tamás Gál, Dr. Ágnes Gulyás and Dr. Erwan Liberge for their help through the familiarization with the programs ENVI-met, RayMan and Python programming language.
The author acknowledges that preliminary results of the study have been published in the Proceedings of the PLEA 2011 (Szűcs and Mills, 2011 ).
References
- Alcoforado et al., 2009 M.-J. Alcoforado, H. Andrade, A. Lopes, J. Vasconcelos; Application of climatic guidelines to urban planning. The example of Lisbon (Portugal); Land Urban Plan, 90 (2009), pp. 56–65
- Andrade and Alcoforado, 2008 H. Andrade, M.-J. Alcoforado; Microclimatic variation of thermal comfort in a district of Lisbon (Telheiras) at night; Theoretical and Applied Climatology, 92 (3–4) (2008), pp. 225–237
- Andrade et al., 2011 H. Andrade, M.-J. Alcoforado, S. Oliveira; Perception of temperature and wind by users of public outdoor spaces: relationship with weather parameters and personal characteristics; International Journal of Biometeorology, 55 (2011), pp. 665–680
- ASCE, 2003 ASCE—American Society of Civil Engineers, 2003. Outdoor Human Comfort and its Assessment: State of the Art. Task Committee on Outdoor Human Comfort.
- Balázs, 2008 Balázs, E., 2008. Comparative human thermal comfort and microclimate study at Ady square (in Hungarian) Diploma project prepared at Szeged University. Department of Climatology and Landscape Ecology.
- Blocken and Carmeliet, 2008 B. Blocken, J. Carmeliet; Pedestrian wind conditions at outdoor platforms in a high-rise apartment building: generic sub-configuration validation, wind comfort assessment and uncertainty issues; Wind and Structures, 11 (1) (2008), pp. 51–70
- Bosselmann et al., 1995 E.A. Bosselmann, E. Arens, K. Dunker, R. Wright; Urban form and climate; Journal of American Planning Association, 61 (2) (1995), pp. 226–239
- Bouyer et al., 2007 J. Bouyer, J. Vinet, P. Delpech, S. Carré; Thermal comfort assessments: application to comfort study in stadia; Journal of Wind Engineering and Industrial Aerodynamics, 95 (2007), pp. 963–976
- Bruse, 2004 Bruse, M., 2004. ENVI-met website 〈http://www.envimet.com〉 (retrieved 16.01.10).
- Bruse and Fleer, 1998 M. Bruse, H. Fleer; Simulating surface-plant–air interactions inside urban environments with a three-dimensional numerical model; Environmental Modelling and Software, 13 (1998), pp. 373–384
- De Maerschalck et al., 2010 De Maerschalck, B., Maiheu, B., Janssen, S., Vankerkom, J., 2010. CFD-Modelling of Complex Plant-Atmosphere Interactions: Direct and Indirect Effects on Local Turbulence. CLIMAQS Workshop ‘Local Air Quality and its Interactions with Vegetation’ 2010, Antwerp, Belgium. Online: 〈http://193.191.168.142/AQ-Vegetation-workshop/abstract/DeMaerschalck.pdf〉 (retrieved 05.02.2012)
- DDDA, DDDA—Dublin Docklands Development Authority Online: 〈http://www.docklands〉 .i.e. (retrieved 01.05.2011)
- Dublin City Council, 2007 Dublin City Council, Dublin City Development Plan 2007–2011. Online: 〈http://www.dublincity.ie/Planning/DublinCityDevelopmentPlan/pages/citydevelopmentplan〉 . aspx (retrieved 02.09.2011).
- Égerházi et al., 2009 L. Égerházi, N. Kántor, Á. Gulyás; Investigation of human thermal comfort by observating the utilization of open-air terraces in catering places—a case study in Szeged; Acta Climatologica et Chorologica Universitatis Szegediensis, 42, 43 (2009), pp. 29–37
- Emmanuel et al., 2007 R. Emmanuel, H. Rosenlund, E. Johansson; Urban shading–a design option for the tropics? A study in Colombo, Sri Lanka; International Journal of Climatology, 27 (2007), pp. 1995–2004
- Erell et al., 2011 E. Erell, D. Pearlmutter, T. Williamson; Urban microclimate. Designing the Spaces between Buildings; Earthscan, London (2011)
- Fox-Rogers, 2011 L. Fox-Rogers; Personal Communication (2011)
- Gál and Unger, 2006 T. Gál, J. Unger; Detection of ventilation paths using high-resolution roughness parameter mapping in a large urban area; Building and Environment, 41 (2006), pp. 198–206
- Gandemer and Guyot, 1976 Gandemer, J., Guyot, A., 1976. Intégration du phénomène vent dans la conception du milieu bâti—guide méthodologique et conseils pratiques. La Documentation Française Paris.
- Gandemer and Guyot, 1981 Gandemer, J., Guyot, A., 1981. La protection contre le vent. Aérodynamique des brisevents et conseils pratiques, 132 (pp.)
- Gehl, 2011 J. Gehl; Life Between Buildings. Using Public Space; Islandpress, Washington, D.C (2011)
- Gulyás et al., 2006 Á. Gulyás, J. Unger, A. Matzarakis; Assessment of the microclimatic and human comfort conditions in a complex urban environment: modelling and measurements; Building and Environment, 44 (2006), pp. 713–1722
- Höppe, 1984 P. Höppe; Die Energiebilanz des Menschen (dissertation); Wissenschaftliche Mitteilungen, Meteorological University of München (1984), p. 49
- Höppe, 1994 P. Höppe; Die Wärmebilanzmodelle MEMI und IMEM zur Bewertung der thermischen Beanspruchung am Arbeitsplatz; Verh Dtsch Ges Arbeitsmed Umweltmed, 34 (1994), pp. 153–158
- Höppe, 1999 P. Höppe; The physiological equivalent temperature–a universal index for the biometeorological assessment of the thermal environment; International Journal of Biometeorology, 43 (1999), pp. 71–75
- IMS, IMS—Irish Meteorological Service Online. The climate of Ireland 〈http://www.met.ie/climate〉 /Climate of Ireland (retrieved 04.02.2011).
- Jendritzky and Nübler, 1981 G. Jendritzky, W. Nübler; A model analyzing the urban thermal environment in physiologically significant terms; Meteorology and Atmospheric Physics, 29 (4) (1981), pp. 313–326
- Kántor and Unger, 2010 N. Kántor, J. Unger; Benefits and opportunities of adopting GIS in thermal comfort studies in resting places: an urban park as an example; Landscape Urban Plan, 98 (2010), pp. 36–46
- Knez and Thorsson, 2008 I. Knez, S. Thorsson; Thermal, emotional and perceptual evaluations of a park: cross-cultural and environmental attitude comparisons; Building and Environment, 43 (2008), pp. 1483–1490
- Lawton, 2008 P. Lawton; Evaluating the role of urban public space in Dublins evolution as an entrepreneurial city; Progress in Irish Urban Studies, 4 (2008), pp. 1–12
- Leech, 1985 Leech, L.S., 1985. A provisional assessment of the recreational quality of weather in summer, in terms of thermal comfort and the adverse effect of rainfall. Irish Meteorological Service Technical Note no. 47.
- Matzarakis et al., 1999 A. Matzarakis, H. Mayer, M. Iziomon; Applications of a universal thermal index: physiological equivalent temperature; International Journal of Biometeorology, 43 (1999), pp. 76–84
- Matzarakis et al., 2007 A. Matzarakis, F. Rutz, H. Mayer; Modelling radiation fluxes in simple and complex environments—application of the RayMan model; International Journal of Biometeorology, 51 (2007), pp. 323–334
- McIntyre, 1980 D.A. McIntyre; Indoor Climate; Applied Science Publishers Ltd. Barking, Essex, England (1980)
- Moore, 2008 N. Moore; Dublin Docklands reinvented. The Post-Industrial Regeneration of a European City Quarter; Four Courts Press, Dublin (2008)
- Nikolopoulou and Steemers, 2003 M. Nikolopoulou, K. Steemers; Thermal Comfort and psychological adaptation as a guide for designing urban spaces; Energy and Building, 35 (2003), pp. 95–101
- Nikolopoulou et al., 2001 M. Nikolopoulou, N. Baker, K. Steemers; Thermal comfort in outdoor urban spaces: the human parameter; Solar Energy, 70 (2001), pp. 227–235
- Nikolopoulou and Lykoudis, 2006 M. Nikolopoulou, S. Lykoudis; Thermal comfort in outdoor urban spaces: analysis across different European countries; Buildings and Environment, 41 (2006), pp. 1455–1470
- NTDA, 2010 NTDA—Failte Ireland, 2010. National Tourism Development Authority. Report 2009 Tourism Facts online: 〈http://www.failteireland.ie〉 /Research-Statistics/Tourism-Facts/Annual-Tourism-Facts (retrieved 20.06.11).
- Oliveira and Andrade, 2007 S. Oliveira, H. Andrade; An initial assessment of the bioclimatic comfort in an outdoor public space in Lisbon; International Journal of Biometeorology, 52 (2007), pp. 69–84
- Oliveira et al., 2011 S. Oliveira, H. Andrade, T. Vaz; The cooling effect of green spaces as a contribution to the mitigation of urban heat: a case study of Lisbon; Buildings and Environment, 46 (2011), pp. 2186–2194
- Pahl, 1975 R.E. Pahl; Whose city? And Further Essays on Urban Society; Penguin, London (1975)
- Péczely, 1979 Péczely, Gy., 1979. Éghajlattan—Climatology in Hungarian. Nemzeti Tankönyvkiadó, Budapest.
- Rohan, 1975 P.K. Rohan; The Climate of Ireland; The Stationery Office, Dublin (1975)
- Short, 1996 J.R. Short; The Urban Order: An Introduction to Cities, Culture and Power; Blackwell, Cambridge (1996)
- Spagnolo and de Dear, 2003 Spagnolo, de Dear; Field study of thermal comfort in outdoor and semi-outdoor environments in substropical Sydney Australia; Buildings and Environment, 38 (2003), pp. 721–738
- Steadman, 1971 R.G. Steadman; Indices of wind chill of clothed persons; Journal of Applied Meteorology, 10 (1971), pp. 674–683
- Steadman, 1979 R.G. Steadman; The assessment of sultriness, part II: effects of wind, extra radiation and barometric pressure on apparent temperature; Journal of Applied Meteorology, 18 (1979), pp. 874–884
- Szokolay, 2008 S.V. Szokolay; Introduction to Architectural Science. The Basis of Sustainable Design; Architectural Press—Imprint of Elsevier, Oxford (2008)
- Szűcs and Mills, 2011 Szűcs, Á., Mills, G., 2011. Exploring outdoor climates and urban design in a historic square in Dublin. In: Proceedings of PLEA 25th Passive and Low Energy Architecture, Brussels, Belgium.
- Thorsson et al., 2003 S. Thorsson, M. Lindqvist, S. Lindqvist; Thermal bioclimatic conditions and patterns of behavior in an urban park in Göteborg, Sweden; International Journal of Biometeorology, 48 (2003), pp. 149–156
- Unger, 1999 J. Unger; Comparisons of urban and rural bioclimatic conditions in the case of a central-European city; International Journal of Biometeorology, 43 (1999), pp. 139–144
- United Nations, 2010 United Nations, 2010. Department of Economic and Social Affairs, Population Division, Population Estimates and Projections Section. World Urbanization Prospects. United Nations Report online: 〈http://esa.un.org/unpd/wup/doc_press-release.htm〉 (retrieved 16.04.11).
- Walton et al., 2007 D. Walton, V. Dravitzki, M. Donn; The relative influence of wind, sunlight and temperature on user comfort in urban outdoor spaces; Buildings and Environment, 42 (2007), pp. 3166–3175
Document information
Published on 12/05/17
Submitted on 12/05/17
Licence: Other
Share this document
Keywords
claim authorship
Are you one of the authors of this document?
