Abstract
Based on the observations from 239 meteorological stations located in Central China (Henan, Hubei and Hunan provinces), this paper focuses on the climate change facts during 1961–2010. There was a significant increasing trend in annual mean temperature for Central China during 1961–2010. The increasing rate was 0.15°C per decade, which was lower than the national trend. Since the mid-1980s, temperature increasing was obvious. Large increasing rate was observed in the mid-eastern part of Central China. For the four seasons, the increasing rate in winter was the largest (0.27°C per decade). The increasing rate in the annual mean minimum temperature was larger than that in the annual mean maximum temperature from 1961 to 2010. As a result, the diurnal range of temperature decreased at the rate of –0.10°C per decade. The extreme high temperature events were increasing while the extreme low temperature events were significantly decreasing. There was no obvious trend in annual precipitation for Central China during 1961–2010. Precipitation in summer and winter significantly increased; change of precipitation in spring was not obvious; precipitation in autumn was decreasing. The decreasing rate of annual rainy days was –3.4 d per decade. The precipitation intensity increased at the rate of 0.25 mm d–1 per decade. Heavy-rain days significantly increased. Spring and summer started earlier while autumn and winter started later. As a result, spring and summer duration was expanding whereas autumn and winter duration shortened.
Keywords
Central China ; climate change ; temperature ; precipitation
1. Introduction
According to the IPCC Fourth Assessment Report (AR4) [ IPCC, 2007 ], the second half of the 20th century could be the warmest 50 years in the past 1,300 years. During the 50 years from 1956 to 2005, temperature had increased 0.65°C. The warming was most significant in winter. While the global land precipitation in the 20th century had increased 2%; the changes in various regions were not the same to say the least. In China, the national mean temperature had increased 1.38°C from 1951 to 2009; precipitation had no obvious trend; the extreme precipitation events had increased and intensified in the middle and lower reaches of the Yangtze River as well as in southeastern and western China [ECSCNARCC, 2011].
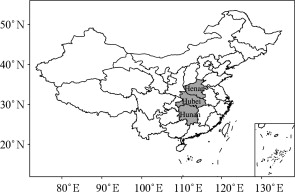
Central China is referred to as the region of three provinces: Henan, Hubei and Hunan. It is located in the transition zone of north-south climate regimes, which is sensitive to climate change (Fig. 1 ). With global change, climate in Central China has also undergone significant changes. There have been researches focused on individual province in Central China [ Zheng et al., 2002 , Ni et al., 2009 , Li et al., 2012 , Gu et al., 2010 , Zhang et al., 2008 and Luo et al., 2008 ]. However, few have taken the whole Central China as the research area to study the regional climate change and its impact.
|
|
|
Figure 1. The schematic figure of Central China |
Central China plays an important role in China’s economic development. It is an important grain production base. Researches on climate change in Central China will certainly provide scientific basis for adaptation to and mitigation of climate change and ensure the sustainable development of regional economy. Researches on climate change in Central China will provide the refinement and supplement to the National Assessment Report [ ECSCNARCC, 2011 ] on the regional scale. It is also the basis for the provinces in the region to address climate change.
2. Data and methodology
2.1. Data
The observational data at 239 national meteorological stations from 1961 to 2010 are from the meteorological archives of Henan, Hubei and Hunan provinces, including daily data of mean temperature, maximum temperature, minimum temperature, and precipitation. The climate base years are from 1971 to 2000.
2.2. Methodology
According to Zhai and Pan [2003] , the 95th percentile or 5th percentile is selected as the threshold of extreme event. The 95th percentile of daily maximum temperature from 1971 to 2000 is defined as the threshold for extreme high temperature events. Similarly, the threshold of the extreme low temperature events is defined as the 5th percentile of daily minimum temperature.
In this paper, the standard to divide the four seasons is critical temperature. When the 5-day running average daily mean temperature steadily passes a critical value, a new season has started. Specifically, the first day of the 5-day running average steadily above 10°C and 22°C is the first day of spring and summer, respectively; and the last day of the 5-day running average steadily below 22°C and 10°C is the first day of autumn and winter, respectively.
High-temperature days are the days with daily maximum temperature ≥ 35°C. Hot days are the days with daily maximum temperature ≥ 30°C and daily minimum temperature ≥ 27°C. Rainy days are the days with daily precipitation ≥ 0.1 mm. Rainstorm days are the days with daily precipitation ≥ 50 mm but < 100 mm. Heavy-rain days are the days with daily precipitation ≥ 100 mm. Precipitation intensity is annual precipitation total divided by annual rainy days. Each regional mean element for Central China is the arithmetic average at all the stations.
Five different homogeneity tests are used in this paper: 1) standard normal homogeneity test [ Alexandersson, 1986 ]; 2) Buishand test [ Buishand, 1982 ]; 3) Pettitt test [ Pettitt, 1979 ]; 4) binomial regression test; 5) multi-linear regression test [ Vincent, 1998 ]. When a time series passes any two of these tests, it is said to be homogeneous.
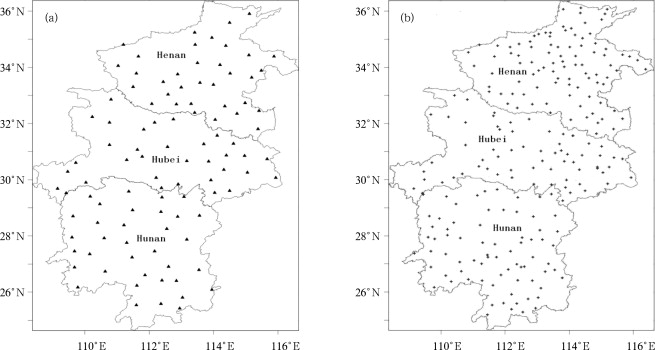
Temperature series at 117 stations passed the homogeneous tests. In order to make the distribution of stations more uniform, 102 stations were selected for temperature analysis (Fig. 2 a) [ Wang and Liu, 2012 and Li et al., 2005 ]. By the same approach, 233 stations were selected for precipitation analysis (Fig. 2 b). The linear trend is calculated by linear regression; decadal variation analysis is through polynomial fitting [ Wei , 2007 ]. The statistically significant level for linear trend test is 0.05.
|
|
|
Figure 2. Distribution of the selected stations in Central China for the analysis of (a) temperature and (b) precipitation |
3. Results
3.1. Temperature
3.1.1. Annual mean temperature significantly increasing, most obvious in the mideastern part and in winter
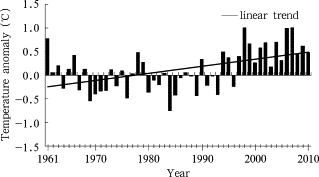
During 1961–2010, there was a significant increasing trend in annual mean temperature for Central China (Fig. 3 ). The temperature increasing rate is 0.15°C per decade, which is lower than the national mean increasing rate (0.23°C per decade from 1951 to 2009) [ ECSCNARCC, 2011 ] and slightly higher than the global increasing rate (0.13°C per decade from 1956 to 2005) [ IPCC, 2007 ]. There has been significant increasing since the mid-1980s, especially since 1994. From 1997 to 2010, the abnormally high temperature persisted for 14 consecutive years.
|
|
|
Figure 3. Variation of annual mean temperature anomalies for Central China from 1961 to 2010 |
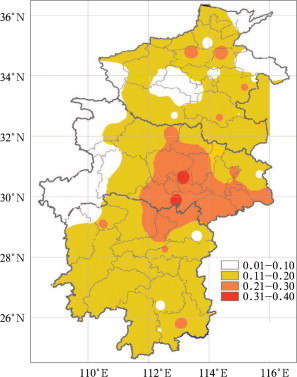
The increasing rate in annual mean temperature during 1961–2010 was large in eastern Hubei and northeastern Hunan, at the rate of 0.21 to 0.32°C per decade. There was no obvious increase in western Hubei, northeastern and central Henan (Fig. 4 ).
|
|
|
Figure 4. Spatial distribution of linear trends in annual mean temperature in Central China during 1961–2010 (linear trend for station in the shadow area is statistically significant at 0.05; unit: °C per decade) |
The increasing rates for mean temperature in winter, spring and autumn from 1961 to 2010 were statistically significant, with the largest in winter (0.27°C per decade) followed by spring (0.23°C per decade). Slightly decreasing trend was found in summer.
During 1961–2010, the increasing rate in the annual mean maximum temperature was 0.13°C per decade. There was also a significant increasing trend in the annual mean minimum temperature, 0.23°C per decade, which was much larger than that in the annual mean maximum temperature. As a result, the annual mean diurnal range of temperature was significantly decreasing at the rate of –0.10°C per decade.
3.1.2. More extreme high temperature events and fewer extreme low temperature events
The extreme high temperature events showed interdecadal variations from 1961 to 2010 in Central China. There were more extreme high temperature events in the 1960s. The extreme high temperature events were the least from the early 1980s to 1990s. Since the mid-1990s, there has been a significant increasing trend. High-temperature days also showed the same interdacadal variations. High-temperature days in the 1960s were the highest followed by those in the 2000s. On average, there were 4.6 d hot days per year at each station. During 1961–2010, hot days increased at the speed of 0.6 d per decade. The average annual hot days in the 2000s were 6.8 d, which was the highest of all time (Fig. 5 ).
|
|
|
Figure 5. Variations of hot days for Central China from 1961 to 2010 |
The extreme low temperature events were more than normal from the 1960s to 1980s, with the most in the 1960s, while less than normal from the 1990s to 2000s. There were only 2 d in 2006 and 2009, and 6 d in 2010. There was a significant decreasing trend in the days with minimum temperature less than 0°C during 1961–2010, with the most in the 1960s and least in the 2000s.
3.2. Precipitation
3.2.1. No obvious trend in annual precipitation
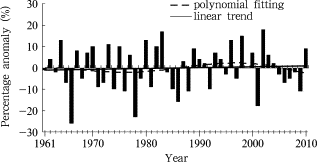
From 1961 to 2010, there was no obvious linear trend in annual precipitation for Central China. However, interdecadal variations were significant. Before the early 1990s, 2- to 3-year oscillation was prevalent. There were more precipitations from 1993 to 2004. Since 2005, annual precipitation began to decrease (Fig. 6 ).
|
|
|
Figure 6. Variations of annual precipitation percentage anomalies for Central China from 1961 to 2010 |
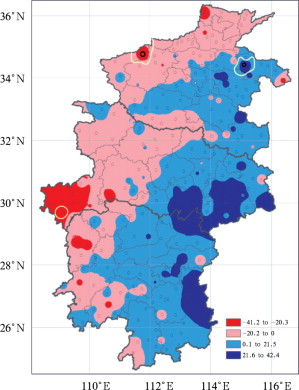
For the spatial distribution, weak increasing trends were observed in eastern Hunan, eastern Hubei and eastern Henan, whereas slight decreasing trends were found in northwestern Henan, western Hubei and western Hunan (Fig. 7 ). From 1961 to 2010, there was a significant increasing trend in precipitation in summer and winter for Central China, with the rate of 15.9 and 6.3 mm per decade, respectively. The increasing rate in spring was not obvious. Precipitation in autumn was decreasing at the rate of –12.2 mm per decade during 1961–2010.
|
|
|
Figure 7. Spatial distribution of linear trends in annual precipitation in Central China during 1961–2010 (uint: mm per decade; trends in the white circle are significant at 0.05) |
3.2.2. Rainy days decreasing significantly while precipitation intensity increasing
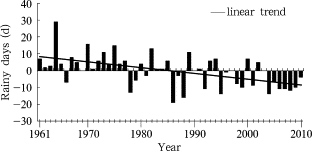
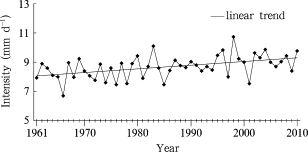
From 1961 to 2010, annual rainy days for Central China was 128 d per year in average which had a significant decreasing trend at the rate of-3.4 d per decade (Fig. 8 ). There were more rainy days from the 1960s to 1970s and less from the mid-1990s to 2000s. Rainy days were lower than normal in 13 years among the 16 years after 1995. There was a significant increasing trend in precipitation intensity for Central China during 1961–2010, with the rate of 0.25 mm d–1 per decade (Fig. 9 ). This means that precipitation in Central China was more concentrated with increasing temporal inhomogeneity. In 1998, the precipitation intensity was the largest (10.7 mm d–1 ) because there were more precipitation processes from June to August, with more rainstorm days and more precipitation amount in Hubei and Hunan induced by the abnormal Meiyu. The year of 1966 was a dry year with the least precipitation amount and precipitation intensity (6.7 mm d–1 ).
|
|
|
Figure 8. Variations of annual rainy days anomaly for Central China from 1961 to 2010 |
|
|
|
Figure 9. Variations of annual precipitation intensity for Central China from 1961 to 2010 |
There was a significant increasing trend in annual rainstorm days from 1961 to 2010 in Central China. The heavy-rain days increased significantly at the rate of 0.03 d per decade. The annual rainstorm days and heavy-rain days were both more than normal during the past 20 years. The increasing trend in rainstorm days in Hunan province was the most significant in the three provinces [ Zhang et al., 2008 and Luo et al., 2008 ].
3.3. Earlier spring and postponed autumn; extended summer and shortened winter
The linear trend in the date of first day of spring, summer, autumn and winter from 1961 to 2010 for Central China is –1.9, –0.5, 1.0, and 0.6 d per decade, respectively. Spring started significantly earlier while autumn started significantly later. After entering the 21st century, the first day of spring came 8 days earlier than normal and the first day of autumn came 5 days later than normal.
There was an expanding trend in spring and summer duration from 1961 to 2010 while there was a shortening trend in autumn and winter duration. The liner trend in duration of spring, summer, autumn and winter was 1.3, 1.5, –0.1, and –2.4 d per decade, respectively. The expanding of summer duration and shortening of winter duration was statistically significant. In the 2000s, change in the four seasons’ duration was significant. The duration of spring and summer was 7 and 5 d longer than normal, respectively, while the duration of autumn and winter was 2 and 9 d shorter than normal.
4. Conclusions and discussion
(1) There was a significant increasing trend in annual mean temperature from 1961 to 2010 for Central China (0.15°C per decade). Large increasing rates were observed in the mid-eastern part of the region. The temperature increasing rates in winter, spring and autumn were significant, with the largest in winter, whereas temperature in summer showed a decreasing trend. The annual mean diurnal range of temperature had decreased significantly. The extreme high temperature events showed interdecadal variations. There was a significant increasing trend in hot days. Extreme low temperature events decreased from 1961 to 2010.
(2) There was no obvious linear trend in annual precipitation amount for Central China from 1961 to 2010. Weak increasing trends were observed in the eastern part of the region while slight decreasing trends were found in the western part. The precipitation amount in summer and winter displayed a significantly increasing trend. From 1961 to 2010, no significant change was observed in spring while a decreasing trend was found in autumn. There was a significant decreasing trend in annual rainy days. As a result, a significant increasing trend was found in annual precipitation intensity. Heavy-rain days in Central China increased significantly from 1961 to 2010.
(3) From 1961 to 2010, the date of spring first day for Central China advanced by 1.9 d per decade while the date of autumn first day postponed by 1.0 d per decade. Summer duration expanded at the rate of 1.5 d per decade and winter duration shortened at the rate of 2.4 d per decade.
The conclusions of the climate change facts for Central China are basically consistent with the results in the National Assessment Report [ ECSCNARCC, 2011 ] and with those from the studies for each individual province [ Luo et al., 2008 , Chen et al., 2009 , Wang et al., 2010 and Li et al., 2012 ], whereas slight differences exist in the change rates. The main reasons of the differences are: firstly, different number of stations and different time period of observations were used; secondly, climate change in Central China is also influenced by the regional geographic location, topography, urbanization and other factors [ Ren, 2008 ].
Under the background of global change, climate change in Central China is significantly influenced by greenhouse gases, land utilization change (including urbanization), aerosol and other human activities. At the same time, internal factors of the climate system also have significant influence on the climate change in Central China [ IPCC, 2007 , ECSCNARCC (Editorial Committee for Second China’s National Assessment Report on Climate Change, 2011 and Ren, 2008 ]. El Niño is one of the processes to cause abnormal temperature and precipitation in central China [ ECSCNARCC, 2011 ]. No doubt, the cause of climate changes in Central China still needs further research.
Acknowledgements
This research was supported by the Climate Change Special Project of China Meteorological Administration: The Assessment Report Preparation of the Climate Change of Central China (No. CCSF-10-04).
References
- Alexandersson, 1986 H. Alexandersson; A homogeneity test applied to precipitation data; Journal of Climatology, 6 (1986), pp. 661–675
- Buishand, 1982 T.A. Buishand; Some methods for testing the homogeneity of rainfall records; Journal of Hydrology, 58 (1982), pp. 11–27
- Chen et al., 2009 Z.-H. Chen, R.-Q. Shi, B. Chen; Responses of changing of climatic seasons to global warming: A case of Hubei province in Central China; Scientia Geographica Sinica (in Chinese), 29 (6) (2009), pp. 911–916
- ECSCNARCC (Editorial Committee for Second China’s National Assessment Report on Climate Change, 2011 ECSCNARCC (Editorial Committee for Second China’s National Assessment Report on Climate Change; Second China’s National Assessment Report on Climate Change (in Chinese)Science Press (2011), p. 710
- Gu et al., 2010 W.-L. Gu, J.-F. Wang, L.-L. Zhu; Changes in precipitation and water resources in Henan province in 1956–2007; Advances in Climate Change Research (in Chinese), 6 (4) (2010), pp. 277–283
- IPCC, 2007 IPCC; ,in: S.D. Solomon (Ed.), et al. , Climate Change 2007: The Physical Science Basis. Contribution of Working Group I to the Fourth Assessment Report of the Intergovernmental Panel on Climate Change. Cambridge University Press (2007), p. 996
- Li et al., 2005 Q.-X. Li, M.J. Menne, C.N. Williams Jr., et al.; Detection of discontinuities in Chinese temperature series using a multiple test approach; Climatic and Environmental Research (in Chinese), 10 (4) (2005), pp. 736–742
- Li et al., 2012 T.-X. Li, R.-H. Liu, J. Wang; The climate change analysis of the recent 50 years of Henan province; Henan Water Resources & South-to-North Water Diversion (in Chinese), 2 (2012), pp. 4–7
- Luo et al., 2008 B.-L. Luo, C. Zhang, H. Lin; Characteristics of climatic changes and catastrophe extreme precipitation in Hunan in recent 40 years; Meteorology Monthly (in Chinese), 34 (1) (2008), pp. 80–85
- Ni et al., 2009 L. Ni, G.-D. Zhang, L.-C. Zou, et al.; Wavelet analysis of variations of recent 60 years winter temperature and summer precipitation in Wuhan; Journal of China Three Gorges University: Natural Sciences (in Chinese), 31 (3) (2009), pp. 83–88
- Pettitt, 1979 A.N. Pettitt; A non-parametric approach to the change-point detection; Applied Statistics, 28 (1979), pp. 126–135
- Ren, 2008 G.-Y. Ren; History, current state and the uncertainty of studies of climate change attribution; Advances in Earth Science (in Chinese), 23 (10) (2008), pp. 1084–1091
- Vincent, 1998 L.A. Vincent; A technique for the identification of inhomogeneities in Canadian temperature series; J. Climate, 11 (1998), pp. 1094–1104
- Wang and Liu, 2012 H.-J. Wang, Y. Liu; Comprehensive consistency method of data quality controlling with its application to daily temperature; Journal of Applied Meteorological Science (in Chinese), 23 (1) (2012), pp. 69–76
- Wang et al., 2010 K. Wang, Z.-H. Chen, K.-Q. Liu, et al.; Variation of characteristics of the mean maximum, minimum temperature, and diurnal range of temperature in Central China during 1960–2005; Climatic and Environmental Research (in Chinese), 4 (2010), p. 418424
- Wei, 2007 F.-Y. Wei; The Statistical Diagnosis and the Prediction Technology of the Modern Climate (in Chinese) (2)China Meteorological Press (2007), p. 296
- Zhai and Pan, 2003 P.-M. Zhai, X.-H. Pan; Change in extreme temperature and precipitation over northern China during the second half of the 20th century; Acta Geographica Sinica (in Chinese), 58 (2003), pp. S1–S10
- Zhang et al., 2008 J.-M. Zhang, Z.-X. Li, X.-P. Zhang; Precipitation change in Hunan province; Advances in Climate Change Research (in Chinese), 4 (2) (2008), p. 101105
- Zheng et al., 2002 Z.-F. Zheng, J.-H. Chen, W. Qi; The character of climate variation of Hubei province during recent 50 years; Scientia Meteorologica Sinica (in Chinese), 22 (3) (2002), pp. 280–287
Document information
Published on 15/05/17
Submitted on 15/05/17
Licence: Other
Share this document
Keywords
claim authorship
Are you one of the authors of this document?
