Abstract
This study explores architectural design by examining air, fluid mechanics, and the natural ventilation of buildings. In this context, this research introduces a new way of dealing with the process of architectural synthesis. The proposed way can be used either to create new architectural projects or to rethink existing ones. This study is supported by previous investigation into the natural ventilation of buildings via computational and laboratory simulation (Stavridou, 2011 ; Stavridou and Prinos, 2013 ). The investigation into the natural ventilation of buildings provides information and data that affect architectural design through various parameters. The parameters of architectural synthesis that are influenced and discussed in this paper are the following: (i) inspiration and analogical transfer, (ii) initial conception of the main idea using computational fluid dynamics (digital design), (iii) development of the main idea through an investigatory process toward building form optimization, and (iv) form configuration, shape investigation, and other morphogenetic prospects. This study illustrates the effect of natural ventilation research on architectural design and thus produces a new approach to the architectural design process. This approach leads to an innovative kind of architecture called “breathing architecture.”
Keywords
Natural ventilation of buildings ; Computational fluid dynamics ; Architectural design ; Architectural synthesis ; Air ; Concept
1. Introduction
The application of fluid mechanics in architecture attracts research interest because of its potential to enhance the architectural quality and environmental performance of buildings. To achieve this conjunction between architecture and fluid mechanics, analytical investigation in both fields is necessary.
Chen (2004) explores the use of computational tools to factor wind into architectural environmental design. The study compares the available techniques used to study the wind effect in building design and illustrates several architectural indoor and outdoor environmental designs that utilize computational fluid dynamics (CFD). Weinstock and Stathopoulos (2006) discuss about advanced simulation in design and explain that the advanced physics of nonlinear behavior can be incorporated into generative computational design in exploring the dynamic changes undergone by structures and materials in response to changing conditions. The study further presents a visualization of the main wind flow parameters around a proposed building on a site in Chile. This work shows that the investigation into wind movement at the exterior environment of a building may provide interesting information on the form of the building in correlation with the building topography. Menges (2006) studies instrumental geometry and explains that parametric digital modeling alters the digital representations of architectural design from explicit geometric notation to instrumental geometric relationships. Hensel and Menges (2008) investigate the inclusive performance of built environment and efficiency versus effectiveness toward a morpho-ecological design approach. This study reveals that computational processes provide a potential for a high level of design synthesis and that analysis plays a critical role during the entire morphogenetic process. This analysis is possible not only by examining structural and environmental capacity but also by revealing the material and geometric behavioral tendencies of a system. Therefore, the instrumental contributions of tools such as CFD software are significant. Similar ideas were put forward in the study of McLean (2008) , where it is stated that a creative application of CFD tools can be developed in the design process. In the above study, the analysis of “aerodynamic principles” (Bernal, 1939 ) and the design of surface morphologies, with which the ventilation and protection of internal climate can be achieved by designing and envisioning airflows and turbulence, appear to be an interesting prospect. In his article on architectural design and research, Weinstock, (2008a) notes that architectural designs usually need an optimal resolution of conflicting parameters. When design goes beyond existing forms, spaces, or material systems, the design can converge with research to achieve the idea of new and preserve the goal of being optimal. Leach (2009) explores digital morphogenesis and observes a shift of focus within contemporary architectural design from an architecture based on purely visual concerns toward one that is justified by its performance. The privileging of performance within the design process is described as an interest in “morphogenesis.” Rahm (2009) hails the emergence of a new “meteorological architecture,” in which the invisible takes precedence over the visible and elements such as the atmosphere, conduction of heat, and shifting weather and climate conditions are foregrounded. This research provides a new sort of creations, which consists of typologies related with meteorology and physics, articulation of air movements, transformation of water into vapor, rates of renewal of air mass, sound pressure, temperature, respiration etc.
Mathematics (Dahan–Dalmedico, 2011 ) and parametricism (Schumacher, 2009 ) can be integrated with the dynamic processes of nature (Weinstock, 2008b ) to promote digital design. This creation path is directly connected to the use of computers (Woods, 2008 ) while its maturation may lead to the production of new forms and esthetics (Goldblatt, 2007 ).
Building performance (Lam and Yeang, 2009 ; Fisher, 2012 ; Hensel et al ., 2012 ; Hygh et al ., 2012 ; Aldawoud, 2013 ; Attia et al ., 2013 ) is an important issue in the literature. The integration of support tools into the early stages of architectural design (Lam and Yeang, 2009 ; Attia et al ., 2012 ; Fisher, 2012 ; Greenberg et al ., 2013 ) can contribute to the optimization of form and design (Attia et al., 2012 ; Ihm and Krarti, 2012 ). CFD simulation (Da Graça et al., 2012 ) provides leading information for the optimization of natural ventilation and building geometry. Lomas (2007) describes how the architecture of advanced naturally ventilated buildings can be shaped by considering environmental design and ventilation. Wu et al. (2011) compare the CFD results of natural ventilation with the original design concept to verify the architect׳s vision of realizing the design purpose. The integration of CFD results into energy simulation (Hiyama and Kato, 2011 ) promotes building performance while building form and its role on energy consumption (Zerefos et al., 2012 ) are also determining factors for eco-performative design. Energy efficiency depends on the natural ventilation strategy of a building (Schulze and Eicker, 2013 ). Therefore, CFD analysis (Givens, 2011 ; Suárez et al ., 2011 ; Wang et al ., 2012 ) can be decisive in bioclimatic architecture.
The literature shows that the investigation into architectural design with consideration of the natural ventilation of buildings and with information from computational and laboratory simulations constitutes a valuable research field.
The current research provides lines of architectural synthesis induced by air, its movement, and natural ventilation, which enable a building to “breathe.” Therefore, this study examines the impact of investigating the natural ventilation of buildings on various parameters of architectural design. The parameters influenced and analyzed in this study are (i) inspiration and analogical transfer, (ii) initial conception of the main idea using CFD (digital design), (iii) development of the main idea through an investigatory process toward building form optimization, and (iv) form configuration, shape investigation, and other morphogenetic prospects. This study illustrates the effect of natural ventilation research on these parameters and thus produces a new approach to architectural design that leads to "breathing architecture".
This paper is organized as follows. First, the concept of “breathing architecture” is analyzed, and the role of the natural ventilation of buildings in this kind of architecture is introduced. Subsequently, information on the computational and laboratory simulation of the natural ventilation of buildings is provided. Then, the effect of the investigation into the natural ventilation of buildings on vital parameters of architectural design is elaborated. Figures, descriptions, and discussions accompany the analyses of each parameter. Lastly, several conclusions are derived regarding a creative view of natural ventilation, architectural design through displacement ventilation, building form optimization, morphology and contours of velocity, turbulence intensity and turbulent kinetic energy for displacement, transitional and mixing ventilation, and the “breathing” attitude of architectural design.
2. The concept of “breathing architecture”
“Breathing architecture” is generated by a substantial concept concerning architectural synthesis and architectural design. The concept is based on the meaning of the word “air” and is formed as follows: 1. Air→Breath→Life, 2. Air→Oxygen→Indoor Air Quality, 3. Air→Fluid→Fluid Mechanics. The word “air” has a multidimensional meaning, and the concept of “breathing architecture” aims to enable the spaces to “breathe.”
From an anthropocentric perspective, “air” means breath, and breath denotes life. Therefore, the creation of a space to accommodate human lives should essentially include “air” in the synthetic architectural design process.
From an environmental perspective, air means oxygen. Oxygen is a basic component of good indoor air quality. The improvement of indoor air quality, the conservation of proper atmospheric oxygen levels, and the reduction of air pollutant concentrations have garnered immense scientific interest in recent years. Environmental organizations have set air quality limits, which are often exceeded inside houses. At the same time, extensive efforts have been exerted to decrease outdoor atmosphere pollutants. Therefore, good air quality, not only outdoors but also indoors where people spend most of their lives, is imperative.
From an engineering approach, air is a fluid and is therefore subject to the laws of fluid mechanics. The field of fluid mechanics deals with air flow, velocity, direction, temperature, and several other parameters that aid the analysis and comprehension of the movement and behavior of air masses.
Accordingly, through the scientific observation of air flow, the natural ventilation of buildings can be controlled, and thermal comfort can be achieved. Furthermore, air exchange rates can be optimized, and indoor air quality can be improved. These conditions may lead to proper oxygen concentration levels, which in turn contribute to the promotion of good health and pleasant living environment for the inhabitants. Consequently, the architectural synthesis of a building or space, as well as the use of high technology and technical expertise to achieve high-quality indoor atmosphere, enables the ability of the building or space to “breathe” (Stavridou, 2009 ).
2.1. Natural ventilation of buildings in “breathing architecture”
The triple meaning of the word “air” reveals that the natural ventilation of buildings can become a substantial architectural design tool that leads to “breathing architecture.” The above statement can be grounded on the following: 1. natural ventilation enables the supply of fresh air into buildings and supports the healthy breathing of the building inhabitants; 2. natural ventilation also provides oxygen and removes air contaminants, thereby promoting good indoor air quality; 3. supplying air into the building constitutes a process that is subject to the laws of fluid mechanics and can be elaborated analytically. Therefore, such an architectural design tool is harmonized completely with the concept of “breathing architecture,” as illustrated in Section 2 .
3. Computational and laboratory simulation of the natural ventilation of buildings
To effectively utilize the natural ventilation of buildings in the architectural design process, investigating the relevant scientific fields is essential. The natural ventilation of buildings is investigated using computational and laboratory simulation (Stavridou, 2011 ; Stavridou and Prinos, 2013 ). CFD software is used for the computational simulation while the laboratory simulation is conducted in the Laboratory of Hydraulics, Department of Civil Engineering, Aristotle University of Thessaloniki.
In the computational simulation, the software FLUENT 6.0.12 is used (Fluent Incorporated, 2001 ), and the problem is solved using the unsteady Reynolds-averaged Navier–Stokes (RANS) equations in conjunction with the energy equation and the turbulence model RNG k–ε. The geometry and grid of the simulation is created using Gambit (Fluent Incorporated, 2000 ).
In the laboratory simulation, natural ventilation due to buoyancy assisted by wind is investigated by using an open channel. The experimental model in the simulation represents a building form with an orthogonal shape.
3.1. Building design and experimental model
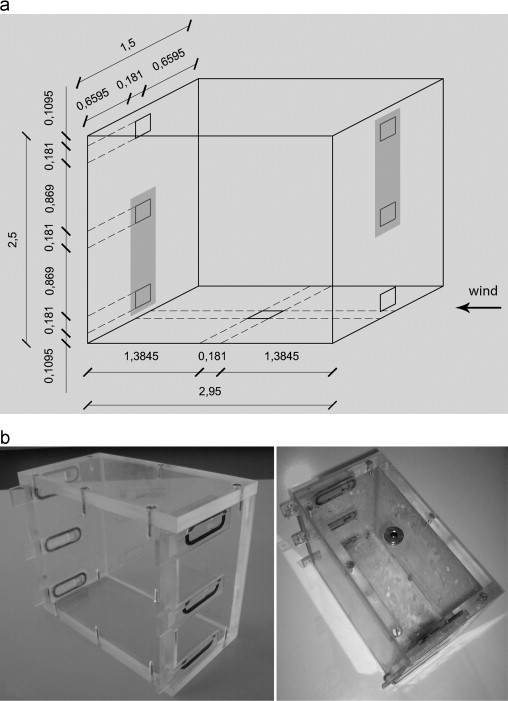
A three-dimensional digital volume is designed (scale 1:1) for the computational simulation of the building form depicted in Figure 1 a. The dimensions of the building form are as follows: height=2.5 m, width=1.5 m, and length=2.95 m. The enclosure has a volume of 11 m3 and has been designed with three windward and three leeward openings. Each square-shaped opening has the following dimensions: height=length=0.18 m. Only the low windward opening and the high leeward opening are used in the present study. The vertical distance between the midpoints of the low and high openings is 2.1 m.
|
|
|
Figure 1. (a) Dimensions of the building form (three-dimensional space), (b) Experimental model made of plexiglass. |
For the laboratory simulation, an experimental model is designed and constructed to represent the building form described above (Figure 1 b). The experimental model is made of plexiglass and has a scale of 1:18. The interior dimensions are as follows: length=16.3 cm, width=8.3 cm, and height=13.8 cm. Each opening has an area of 1 cm2 while the thickness of the walls, the floor, and the ceiling is 1 cm. A feed hole is opened at the top of the model and sealed with a metallic valve.
3.2. Use of Froude number
For the geometry examined in this study, the dimensionless Froude number is used to classify the flow types and the types of the natural ventilation of buildings. The initial Froude number is given by
|
|
( 1) |
where is the reduced gravity at t =0, U is the wind velocity, and h is the vertical distance between the midpoints of the windward and leeward openings. The reduced gravity is given by
|
|
( 2) |
where g is the acceleration due to gravity; ΔT and Δρ are the temperature and density difference between the internal and external environments, respectively; and T and ρ are the temperature and density of the external environment, respectively. It is noted that for an ideal gas, Δρ /ρ =ΔΤ /Τ .
3.3. Decline rate of mean temperature in function of time
In the computational simulation (Stavridou, 2011 ; Stavridou and Prinos, 2013 ), for defining the duration of the phenomenon of natural ventilation, the decline rate of mean temperature in the function of time is introduced and is defined as the ratio . The variable ΔΤinitial is defined as the temperature difference between indoor and outdoor air at t =0 min. The variable ΔΤn is defined as the temperature difference between the mean temperature of indoor air at each new time selected (t =n ) and the temperature of outdoor air. The indoor mean temperature of each time selected changes as time passes while the outdoor temperature is considered to be constant.
Note that when the decline rate of mean temperature is of about 95% or higher than that, the transient phenomenon is considered to be completed.
4. Impact of the investigation into the natural ventilation of buildings on four parameters of architectural design
The natural ventilation of buildings can constitute an incentive for innovative architectural design. Thorough comprehension and analytical research is essential for this innovation to be effective.
Accordingly, the impact factor of natural ventilation on the synthetic process of architectural design is important to be investigated not only from the early development stages of an idea but also before the inception of a particular project. In this manner, directions can be given that promote architectural quality and proper ventilation in each case studied, contributing to a new level of bioclimatic function that enables a space to “breathe.”
The natural ventilation of buildings and architectural design are interdependent. Changes in natural ventilation strategies affect architectural design, and vice versa. Architectural design and its components can form different types of ventilation based on the architectural synthesis of each building. The investigation into the natural ventilation of buildings (Stavridou, 2011 ; Stavridou and Prinos, 2013 ) provides data and information that affect architectural design. This influence refers to different parameters that constitute fundamental parts of the synthetic process and the structure of architectural design. In this section, the following four substantial parameters are examined: (i) inspiration and analogical transfer, (ii) initial conception of the main idea by using CFD (digital design), (iii) development of the main idea through an investigatory process toward building form optimization, and (iv) form configuration, shape investigation, and other morphogenetic prospects.
Autodesk 3ds Max 2008 and Autodesk AutoCAD 2008 (www.autodesk.com) are used to design the building forms.
4.1. Inspiration and analogical transfer
Inspiration refers to the source of an idea. Investigating natural ventilation of buildings can become the source of important conceptual ideas in architectural design. If a concept is involved in the design process, then architectural synthesis can be said to be under the influence of the inspirational concept. Hence, an analysis and research on the inspirational concept can enable architects to move toward improved architectural design. For example, assuming that “air” is the inspiration of an architectural synthesis, several parameters related with “air” have to be analyzed. The analysis should cover the manner by which this theme is connected with the concept selected by the architect, as for example “breathing architecture.”
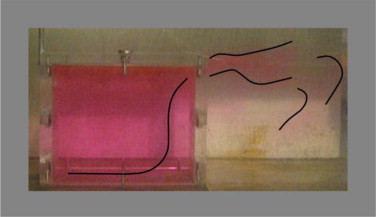
Analogical transfer, in this study, refers to the creative analogical transfer of elements from the subject of inspiration (namely, air and natural ventilation of buildings). Creative analogical transfer constitutes a logic that provides freedom for the architect because such transfer offers the potential of choice, selection, estimation, evaluation, and creation of elements for each synthesis. In case of the investigation of natural building ventilation, analogical transfer can be used, either through laboratory simulation (Figure 2 ) or through computational simulation with the view of creating architectural synthesis that reflects, reveals, and releases airflow. In Figure 2 , two windows of the model are opened (low windward and high leeward openings).
|
|
|
Figure 2. Analogical transfer lines from the laboratory simulation of natural ventilation of buildings. |
4.2. Initial conception of the main idea using CFD
The initial conception of the main idea using CFD is particularly important and falls under the field of digital design. A building form that may come from the computational simulation of a phenomenon (e.g., natural ventilation) that is going to occur within this form is of significant interest. Computational simulation can elaborate dynamic changes of phenomena and physical processes. Investigating the natural ventilation of buildings (Stavridou, 2011 ; Stavridou and Prinos, 2013 ) produce data, digital information, configurations, and shapes that can be used creatively by architects. Digital outcomes, in combination with the architectural design objective of each synthesis (e.g., better ventilation), can constitute the main idea for the design of various buildings.
4.2.1. Architectural synthesis of a building form generated by air motion in displacement ventilation
During the investigation into the natural ventilation of buildings (Stavridou, 2011 ; Stavridou and Prinos, 2013 ) and the analysis of various ventilation types, one crucial question emerges: “What formation and type of natural ventilation can be formed inside a building form which is shaped by taking into account air motion caused by natural ventilation?” Therefore, a new building form is designed.
The architectural synthesis of the building form, described in this section, is produced by the investigation into the flow field and the temperature profile of the displacement ventilation in an orthogonal building volume with low windward and high leeward openings. A simple unit as an orthogonal volume provides useful information even for complicated systems because such volume can constitute a kind of synthesis “cell”.
As observed through computational and laboratorial analysis, displacement ventilation with low windward and high leeward openings (Fr0 =1.15) has great interest and often generates better time results compared with other ventilation types, as for example, mixing ventilation due to the position of the inlet opening (high windward and high leeward openings) ( Stavridou and Prinos, 2006b ; Stavridou, 2011 ). Moreover, for constant wind velocity and geometry with low windward and high leeward openings, displacement ventilation (Fr0 =1.15) results in the emptying of the indoor space faster (at a lower duration of time) than transitional (Fr0 =2.79) or mixing (Fr0 =4.85) ventilation ( Stavridou, 2011 ; Stavridou and Prinos, 2013 ). Therefore, the design of a volume in which shape comes from indoor air movement under this type of ventilation is found to be appropriate.
To design a building form that comes from indoor air motion, the natural ventilation phenomenon is observed in two-dimensional fields and then extended to three-dimensional cases.
In Figure 3 , representations of indoor air movement in various two-dimensional spatial geometries (two-dimensional rectangular spaces with various opening positions) are presented. Accordingly, in this figure various morphological configurations that come from contour lines of parameters such as velocity, temperature, pressure, and turbulent kinetic energy, are observed. This careful observation provides architects with the opportunity to get into air behavior and realize its tendency. This attitude is important and releases architectural design, as designing is not limited by restrictions but is guided by an adopted behavior.
|
|
|
Figure 3. Two-dimensional depictions of indoor air flows (various two-dimensional simulations). Contours of parameters as velocity, temperature, pressure, turbulent kinetic energy. |
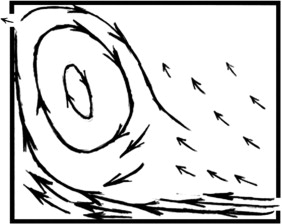
Figure 4 depicts a sketch based on the observation of the natural ventilation phenomenon in buildings. The natural ventilation of different types, the contours of various parameters, the displacement ventilation with low windward and high leeward openings, and the configurations produced by computational simulation and laboratory experiments converge to the shape that is illustrated.
|
|
|
Figure 4. Sketch generated by the observation of the phenomenon of natural ventilation of buildings. |
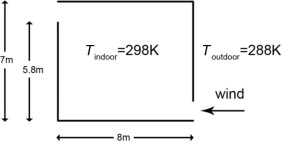
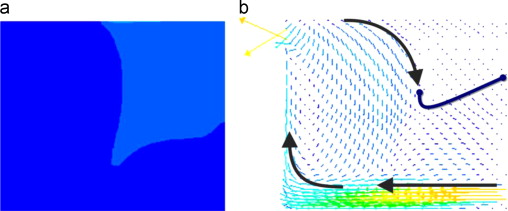
The two-dimensional case, shown in Figure 5 , refers to natural ventilation with low windward and high leeward openings and represents a space (two-dimensional domain) with a height of 7 m and width of 8 m; the height of each opening is 1.2 m (Stavridou and Prinos, 2006a ). The initial temperature difference between the internal and external environments is ΔΤinitial =10 Κ. Computational results of this case at t =200 s are presented in Figure 6 . In particular, the contours of temperature are depicted for two different wind velocities (3 and 1 m/s); the velocity vectors for the wind velocity of 3 m/s are depicted as well. A curved shape (as an arcuation) at the bottom left corner of the space is observed both in the temperature profile and in the flow field. As shown in Figure 6 b, a black curved arrow indicates the characteristic flow direction at the respective region.
|
|
|
Figure 5. Space configuration and position of openings (two-dimensional case). |
|
|
|
Figure 6. Two-dimensional domain, t =200 s: (a) Contours of temperature for wind velocity equal to 3 m/sec, (b) Velocity vectors for wind velocity equal to 3 m/sec, with note of curved arrow, (c) Contours of temperature for wind velocity equal to 1 m/sec. |
The three-dimensional space (scale 1:1) described in Section 3.1 and presented in Figure 1 a is used for the computational simulation (three-dimensional domain). Figure 7 depicts the temperature profile and the flow field in the central longitudinal section (z =0.75 m) of the three-dimensional space. This case refers to the displacement ventilation with low windward and high leeward openings and an initial Froude number equal to 1.15 (Fr0 =1.15, U =0.62 m/s). The indoor and outdoor temperatures at t =0 min are equal to 292 K and 288 K, respectively. The time shown in Figure 7 is t =30 min. For this time instant, the phenomenon is considered to be completed (in particular, for t =30 min, the decline rate of mean temperature is higher than 95%). The black arrows indicate the main flow direction while the blue line indicates the outline of the area with velocities of relatively high value.
|
|
|
Figure 7. Central longitudinal section (z =0.75 m) of the three – dimensional space presented in Figure1 (a): Displacement ventilation with low windward – high leeward opening for Fr0 =1.15 at t =30 min (a) Contours of temperature (b) Velocity vectors with note of curves showing the main flow field. |
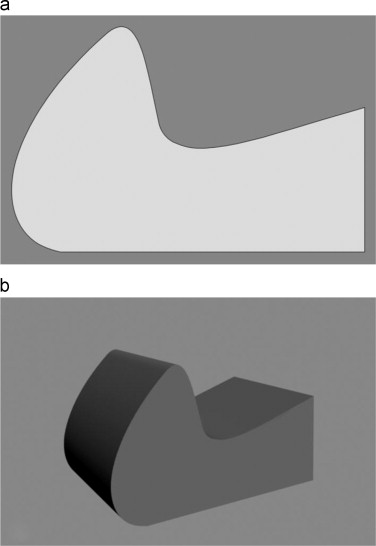
Through this process of observing, marking, analyzing, elaborating, and understanding natural ventilation, a new building form is designed. The form generated is organic. Its main facade is depicted in Figure 8 a while the total volume is presented in Figure 8 b. This configuration comes from the investigation into indoor air flow and natural ventilation, which yields extensive useful data from the computational and laboratory simulations. Nevertheless, the synthesis follows a free course without strict constraints and limits. With the creation of this architectural volume, the expression of non-visible elements of the natural ventilation of buildings and their involved fluidity is achieved.
|
|
|
Figure 8. Organic form: (a) Facade, (b) volume. |
4.3. Development of the main idea through an investigatory process toward building form optimization
The development of the main idea constitutes a fundamental part of the synthetic process because the final result depends directly on the direction to which this development moves. This section deals with the investigation into the development of the main idea to the direction of building form optimization.
The investigatory process begins with specific conditions of a selected type of natural ventilation with good efficiency based on previous investigation into the natural ventilation of buildings. The process then continues by applying a logic of selecting the indoor region with the best air circulation. This logic intends to determine a direction for building form optimization and to assist the architect in reaching enhanced architectural design decisions.
The aim of the investigatory process is not to produce a univocal optimization solution but to reveal a course that can lead to refined architectural choices and refined configurations. Importance is attached to the route and the orientation instead of a unique destination. Therefore, this process can assist in producing advanced and improved solutions in comparison to conventional architectural design.
The outcomes of the computational simulation of the natural ventilation of buildings cover indoor air movement and temperature distribution (e.g., streamlines and contours of different parameters). Accordingly, an architect can move toward building form optimization considering the digital information produced.
4.3.1. Investigatory process toward building form optimization
The investigatory process examined here involves a methodology of isolating the indoor area with the best air circulation. This area defines a new form without regions of “trapped” air, that is, low-moving or stagnant air. In this way, architectural design can move toward building form optimization.
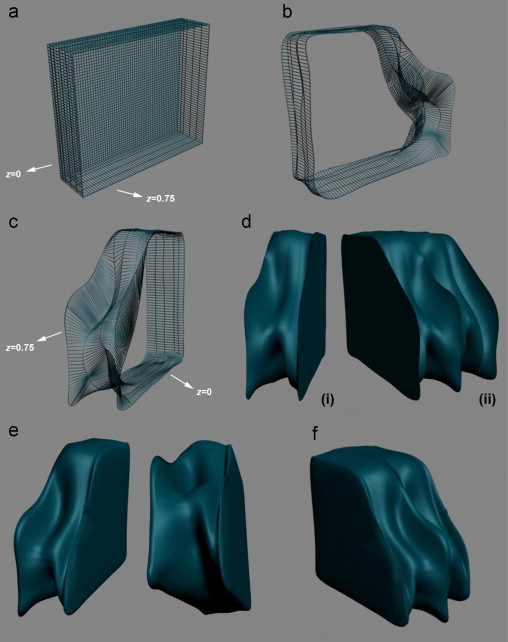
The building volume selected to undergo this process is the orthogonal three-dimensional building form (scale 1:1), described in Section 3.1 and presented in Figure 1 a. The methodology of isolating areas and avoiding “trapped” air is applied through five different techniques that produce five different yet related results. This process leads to a transition from an orthogonal form to five new forms with organic character.
To create a new form, a tangential outline is designed around swirls and velocity vectors with relatively large size to several longitudinal sections of the orthogonal form. The outlines are designed in a free manner so as to follow the main lines of air movement, noting the area with the best air circulation. Due to symmetry, the methodology is implemented at the half part of the volume, with the outcomes coinciding with the other half.
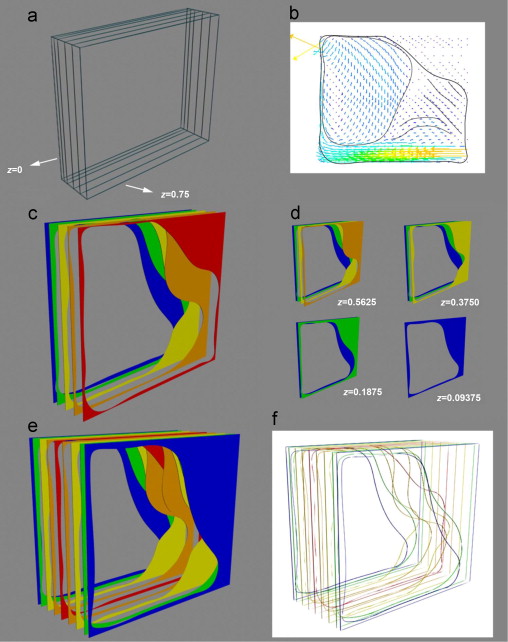
A fundamental part of the process is the selection of vertical planes that represent the longitudinal sections. In this work, five vertical planes are selected (at z =0.09375, 0.1875, 0.375, 0.5625, and 0.75 m), as shown in Figure 9 a. The side wall is at z =0 m, and the central vertical plane is at z =0.75 m. Figure 9 b depicts the outline design at the central vertical plane (z =0.75 m).
|
|
|
Figure 9. (a) Grid of the half orthogonal volume including the five vertical planes (z =0.09375, 0.1875, 0.375, 0.5625, 0.75 m), (b) Outline of the main air circulation for vertical plane z =0.75 m, (c) Technique of full and void areas at the five vertical planes, (d) Full and void areas at the four vertical planes forby the central one, (e) Total volume generated with the “full and voids areas” technique, (f) Wireframe depiction of the total volume. |
Two other fundamental parts of the process are as follows: (a) the selection of the phenomenon of natural ventilation, which is subject to the investigation; and (b) the design of the outline around circulation areas and firm streamlines, which are developed at each defined vertical plane. The phenomenon of natural ventilation, selected in this procedure, is the displacement ventilation with low windward and high leeward openings that occurs in an orthogonal form with an initial Froude number equal to 1.15 (Fr0 =1.15, U =0.62 m/s, ΔΤinitial =4 Κ). For this geometry, displacement ventilation is characterized by good efficiency in terms of temperature and duration (time taken for the space to empty) ( Stavridou, 2011 ; Stavridou and Prinos, 2013 ). For this reason, displacement ventilation is selected as the proper phenomenon for further investigation about building form optimization. The time selected for designing the outline is t =30 min. For this time instant, the phenomenon is considered to be completed (in particular, for t =30 min, the decline rate of mean temperature is higher than 95%).
Following the first technique, full and void areas are used per section (vertical plane) for the definition of a new building form (Figure 9 c to f). Distinct boundaries for the new volume are given for the five vertical planes, which are noted with color gradation from the center to the side wall (red, orange, yellow, green, and blue). However, the limits of the volume for the intermediate spaces are vague, free, and open.
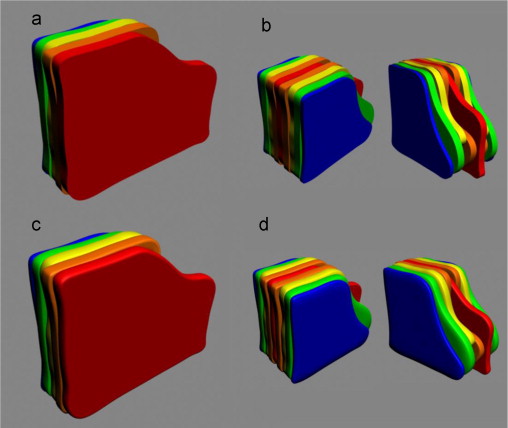
The second technique uses successive solid layers. This technique uses the outlines designed in the first technique and simultaneously subtracts the redundant volume. Figure 10 a to b depict the volume produced by this technique. Each solid layer has a width equal to the distance between two neighboring vertical planes.
|
|
|
Figure 10. Volume definition with the technique of solid layers (a) half part, (b) total volume. Volume definition with the technique of curved solid layers (c) half part, (d) total volume. |
The third technique is directly related to the second one but involves the extension of curving. This technique uses successive solid layers with curved edges, as shown in Figure 10 c to d. As observed through the investigation into the natural ventilation of a building volume of organic form using CFD (Stavridou, 2011 ), the air movement near a curved surface can contribute to a smoother and more normalized air movement near walls in comparison to the air movement near a corner of a right angle. Therefore, curving the cross section of each solid layer is chosen as a useful extension in this technique.
The fourth technique defines one solid volume. In this technique, designing moves from the orthogonal grid depicted in Figure 11 a to the organic grid presented in Figure 11 b to c. An adjustment of the orthogonal contour of each one of the five longitudinal sections (and the side wall, z =0) is made to the organic outline already defined in the first technique. To design the new geometry, the initial grid ( Figure 9 a) with the five longitudinal sections is divided in small parts so that each orthogonal contour can adapt precisely to the curved configuration of each outline. This volume definition is shown in Figure 11 d.
|
|
|
Figure 11. (a) Grid segmentation, (b) Grid of the “one solid volume” technique (side face of half part), (c) Grid of the “one solid volume” technique (back side of half part), (d) Form definition with “one solid volume” technique (i) half part (ii) total volume, (e) Form definition with “curved solid volume” technique (half part), (f) Form definition with “curved solid volume” technique (total volume). |
The fifth technique relates directly to the fourth one, as it refers to the creation of one solid volume. However, this technique also includes the extension of curving. The act of curving refers to the envelope of the volume, and particularly to the areas around the five vertical planes and the side wall. This volume definition is presented in Figure 11 e to f.
Consequently, different morphological configurations can be created through the investigatory process toward building form optimization. The selection and further development of each morphological configuration depend on the will of each architect. Meanwhile, computational simulations of natural ventilation for each new volume can support the quality of each choice.
4.4. Form configuration, shape investigation, and other morphogenetic prospects
The problem of form is a common challenge for architects. Building volume constitutes an inextricable part of the problem of form and has a determining role on the total architectural synthesis of the building. Morphogenetic prospects in architecture can move toward various forms encountered either in the visible or in the non-visible world. The adoption or transfer of such elements can diversely influence the volume and plasticity of an architectural piece.
Considering the investigation into the natural ventilation of buildings during the design process can transfer non-visible behaviors of nature into the visible world. This effect provides a new dimension in architectural design. This new dimension relates not only to esthetics harmonized with the laws of nature but also to the improvement of the efficiency of physical phenomena that occur in buildings.
In this section, three non-visible parameters of the natural ventilation of buildings (velocity, turbulence intensity, and turbulent kinetic energy) are presented and examined for three types of ventilation (displacement, transitional, and mixing).
Three initial Froude numbers are selected to represent each ventilation type: Fr0 =1.15 for displacement ventilation, Fr0 =2.79 for transitional ventilation, and Fr0 =4.85 for mixing ventilation. The building volume examined is the orthogonal three-dimensional building form (scale 1:1) with low windward and high leeward openings, as described in Section 3.1 and as shown in Figure 1 a. In the computational simulation examined here, Fr0 increases by changing wind velocity while the initial temperature difference between indoor and outdoor air is kept constant (ΔΤinitial =4 Κ). In particular, indoor and outdoor temperatures at t =0 min are equal to 292 K and 288 K, respectively. The values of wind velocity are 0.62, 1.5, and 2.6 m/s for Fr0 equal to 1.15, 2.79, and 4.85, respectively.
The three different wind velocities indicate different external conditions. Thus, the outcoming diagrams of the computational simulation cover a respective range of results. Accordingly, the estimation of the results generates a corresponding context of creative action in design that offers new potentialities and advanced prospects in form, shape, and morphology.
The three parameters presented at the contour diagrams of natural ventilation are defined as follows (Allen and Ditsworth, 1972 ; Fluent Incorporated, 2001 ):
Velocity ( ) is defined as the rate of change of position with respect to time. Turbulent kinetic energy (k ) is defined as
|
|
( 3) |
where , and are the fluctuation velocities in the x , y , and z directions, respectively.
Turbulence intensity (I) is defined as
|
|
( 4) |
where the reference velocity ( ) corresponds to the mean velocity magnitude for the flow. In this paper, the reference velocity is assumed to be equal to the inlet velocity at the low windward opening (0.62, 1.5, and 2.6 m/s for Fr0 equal to 1.15, 2.79, and 4.85, respectively).
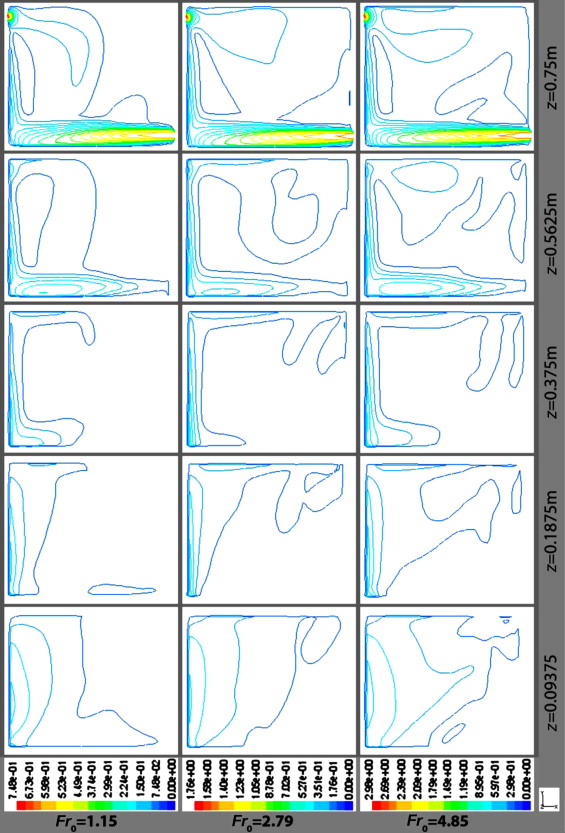
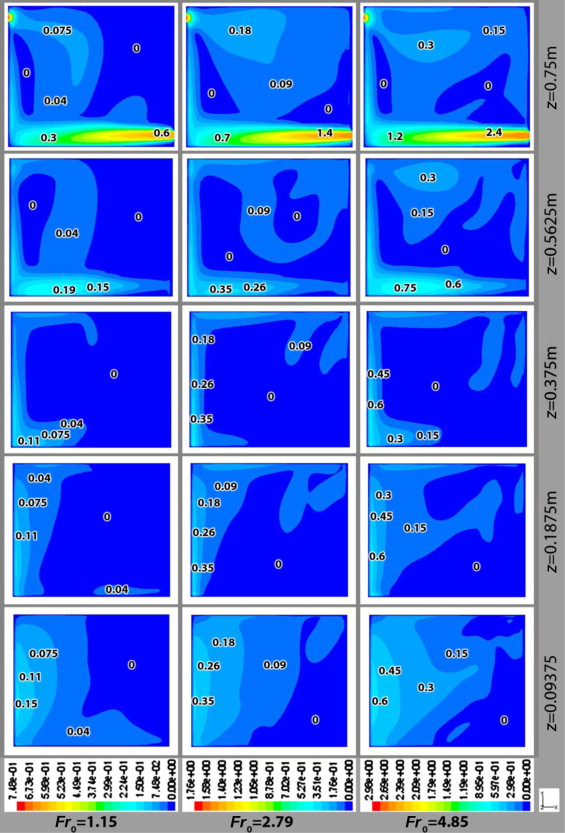
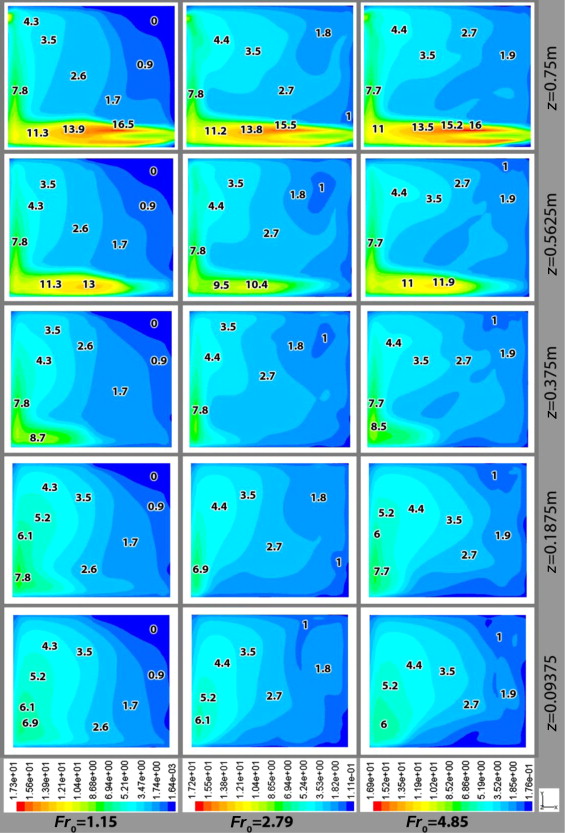
Figure 12 depicts the velocity contours in five vertical planes of the building volume (z =0.75, 0.5625, 0.375, 0.1875, and 0.09375 m) for three initial Froude numbers: (i) Fr0 =1.15, (ii) Fr0 =2.79, and (iii) Fr0 =4.85. The times are t =30 min, t =15 min, and t =10 min for Fr0 equal to 1.15, 2.79, and 4.85, respectively. These values are time instants for which the phenomenon is considered to be completed (in particular, for these time instants, the decline rate of mean temperature is higher than 95%). The filled contours of velocity with extra indicated values per region are shown in Figure 13 .
|
|
|
Figure 12. Configurations of velocity (m/s) contours for Fr0 =1.15, 2.79, 4.85 at t =30, 15, 10 min respectively, at z =0.75, 0.5625, 0.375, 0.1875, 0.09375 m. |
|
|
|
Figure 13. Filled velocity (m/s) contours for Fr0 =1.15, 2.79, 4.85 at t =30, 15, 10 min respectively, at z =0.75, 0.5625, 0.375, 0.1875, 0.09375 m. (Note: The velocity values indicated into the schemes of indoor space are considered to be approximative and they intend to present color variation. In particular, for image discernibility and space saving, each value depicted into the diagrams corresponds to the lower limit of each interval of values of the colorbar scale. The colorbar scale includes twenty color tones that correspond to twenty intervals of values.). |
Based on the configurations of the velocity contours, as the initial Froude number (Fr0 ) decreases, by changing wind velocity, the region with zero or approximately zero velocity increases. While as the initial Froude number increases, the configurations of the contours with relatively increased velocities (e.g., υ 0.09) approach the orthogonal form. This effect shows that an orthogonal form may have regions with extremely low velocity, particularly in days with weak wind. Digital configurations such as contours of velocity and streamlines assist in designing forms able to avoid low-moving or stagnant air areas. Such forms are particularly important when wind velocity is small. Speed gradation also guides distinguishing different space uses with different needs of air movement. This kind of architectural design is related to good air circulation and high ventilation efficiency.
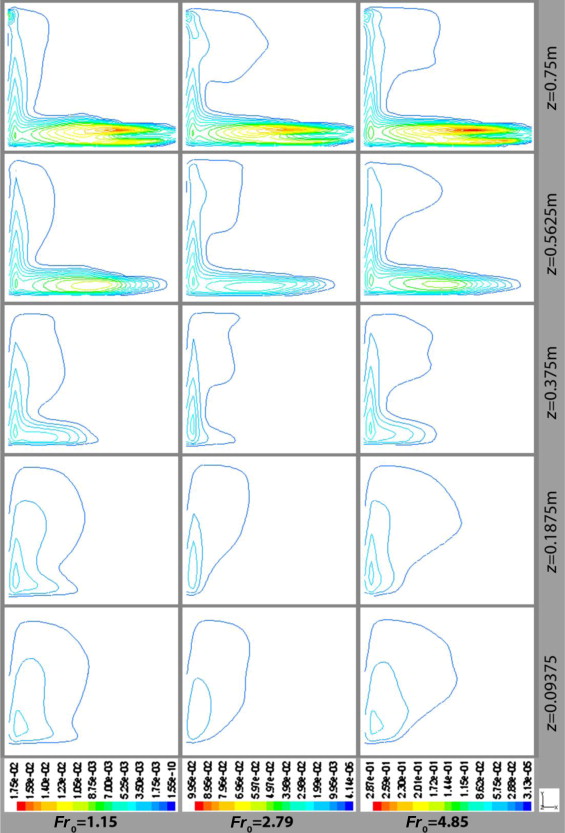
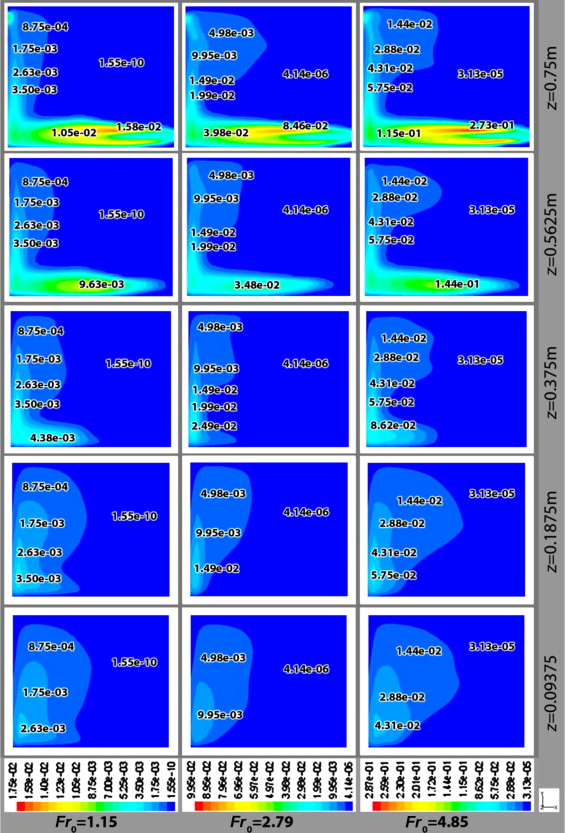
Figure 14 depicts the respective contours of turbulence intensity while Figure 15 shows the filled contours of turbulence intensity with extra indicated values per region. These configurations have several characteristics that are similar to those of velocity, but the two types of configurations are not alike. For Fr0 =1.15, the upper right corner of the space has low values of turbulence intensity (close to zero), while this area has also zero (or approximately zero) velocity values. As the initial Froude number increases, the contours with relatively increased turbulence intensity (e.g., I 1.8%) approach the orthogonal form. Nevertheless, the turbulence intensity configurations exhibit different shape characteristics in comparison to the velocity configurations, particularly at planes with z =0.1875 m and z =0.375 m. High turbulence intensity values are observed at the central zone (z =0.75, 0.5625 m) near the floor (approximately y 0.5 m). Increased turbulence intensity values and a relatively high gradient of turbulence intensity are also observed at the bottom left corner, particularly at the central vertical planes (z =0.75, 0.5625 m). The increased gradient is discerned by the close distance between successive contours. High turbulence intensity indicates high aesthesis of intensity for people residing in the respective areas. Moreover, increased turbulence intensity indicates increased pollutant diffusion. Accordingly, the bottom left corner and the central zone near the floor in this building geometry (low windward and high leeward openings) show better diffusion prospects than the upper right corner does.
|
|
|
Figure 14. Configurations of turbulence intensity (%) contours for Fr0 =1.15, 2.79, 4.85 at t =30, 15, 10 min respectively, at z =0.75, 0.5625, 0.375, 0.1875, 0.09375 m. |
|
|
|
Figure 15. Filled turbulence intensity (%) contours for Fr0 =1.15, 2.79, 4.85 at t =30, 15, 10 min respectively, at z =0.75, 0.5625, 0.375, 0.1875, 0.09375 m. (Note: The turbulence intensity values indicated into the schemes of indoor space are considered to be approximative and they intend to present color variation. In particular, for image discernibility and space saving, each value depicted into the diagrams corresponds to the lower limit of each interval of values of the colorbar scale. The colorbar scale includes twenty color tones that correspond to twenty intervals of values.). |
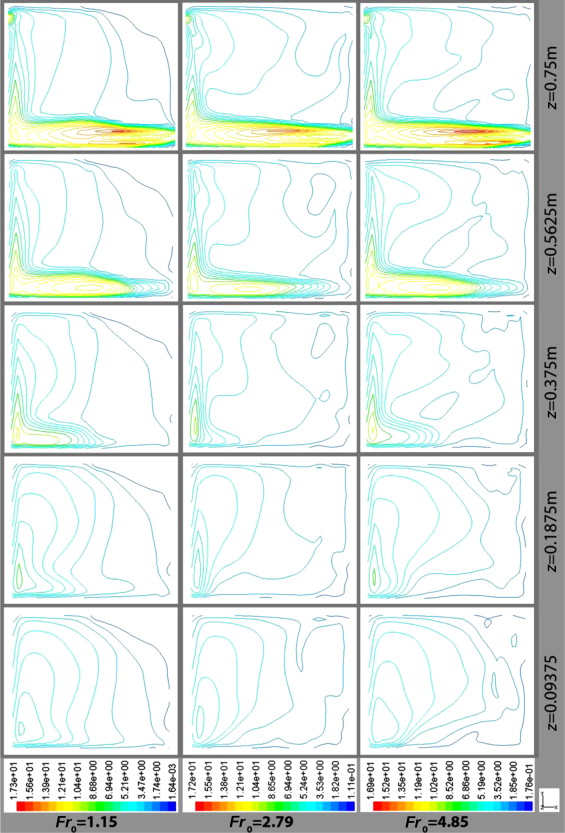
Figure 16 depicts the respective contours of turbulent kinetic energy. Meanwhile, Figure 17 shows the filled contours of turbulent kinetic energy with extra indicated values per region. These configurations differ from those of the two other parameters. Nevertheless, a relatively high gradient of turbulent kinetic energy is also observed at the bottom left corner of the space, particularly at the central vertical planes (z =0.75, 0.5625 m). Moreover, increased values of turbulent kinetic energy are shown particularly in the central zone near the floor (approximately y 0.5 m). As moving from the central vertical plane to the side wall, the configurations show a relatively loose morphology, and the turbulent kinetic energy values, especially those near the floor, decrease. In addition, as Fr0 increases, turbulent kinetic energy values also increase. Areas with increased values of turbulent kinetic energy indicate increased intensity perception, as well as increased pollutant diffusion.
|
|
|
Figure 16. Configurations of turbulent kinetic energy (m2 /s2 ) contours for Fr0 =1.15, 2.79, 4.85 at t =30, 15, 10 min respectively, at z =0.75, 0.5625, 0.375, 0.1875, 0.09375 m. |
|
|
|
Figure 17. Filled turbulent kinetic energy (m2 /s2 ) contours for Fr0 =1.15, 2.79, 4.85 at t =30, 15, 10 min respectively, at z =0.75, 0.5625, 0.375, 0.1875, 0.09375 m. (Note: The turbulent kinetic energy values indicated into the schemes of indoor space are considered to be approximative and they intend to present color variation. In particular, for image discernibility and space saving, each value depicted into the diagrams corresponds to the lower limit of each interval of values of the colorbar scale. The colorbar scale includes twenty color tones that correspond to twenty intervals of values.). |
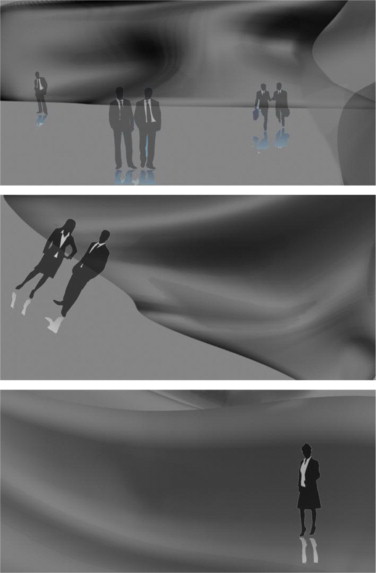
The above data provide useful information on air circulation and movement, as well as the aesthesis of intensity applied to the inhabitants due to turbulence intensity and turbulent kinetic energy. Architectural design can be influenced by one or more of the parameters analyzed above, depending on the intended results. Hence, architects can collect data, elements, configurations, lines, areas of intensity, regions of movement etc and create the synthesis that they desire in a free manner. Examples of building forms are depicted in Figure 18 .
|
|
|
Figure 18. Design of building forms influenced by the investigation of natural ventilation of buildings (The silhouettes of standing or walking people come from: Fotolia, 2010 ). |
Through this research, various morphological configurations can be generated and they are not only harmonized with different esthetic trends of contemporary architectural design but they also create a new substantial substratum. This substratum concerns the improvement of the natural ventilation of buildings, the expression of non-visible natural phenomena in buildings, and the advance of a new kind of design that uses new tools in an innovative, fresh, and virtually creative architectural design process.
5. Conclusions
This paper introduces the concept of “breathing architecture.” In particular, this research explores effects of the investigation into the natural ventilation of buildings on architectural design and thus proposes a new kind of architecture called “breathing architecture.” The investigation into the natural ventilation of buildings provides information and data that affect various parameters of architectural design. The parameters examined in this research are the following: (i) inspiration and analogical transfer, (ii) initial conception of the main idea using CFD (digital design), (iii) development of the main idea through an investigatory process toward building form optimization, and (vi) form configuration, shape investigation, and other morphogenetic prospects. The following conclusions are derived:
- The natural ventilation of buildings can serve as an inspirational motive and stimulate creative analogical transfer in architectural design. Careful physical, laboratory, or computational observation of the phenomenon generates vital synthetic lines and guides architects in achieving “breathing architecture.”
- Natural ventilation in a simple orthogonal building volume and, in particular, displacement ventilation with low windward and high leeward openings, can lead architectural design that wants to “breathe” in finding new and effective forms and geometries. This system constitutes a unity that provides useful information for various systems because it may act as a synthesis “cell.” Creating a form which comes from a phenomenon that is going to occur inside this form can become a substantial guide for a synthesis that moves toward a “breathing” direction.
A synthetic path that freely follows the master air flow without strict constraints and limits achieves the expression of non-visible elements of the natural ventilation of buildings and their involved fluidity, while simultaneously promotes freedom in architectural design.
- The direction of the development of the main idea is especially important because it drives the architectural outcome. An investigatory process toward building form optimization, which takes into account the natural ventilation of buildings, configures the route of a respective development. This process aids in making advanced decisions in designing and can lead to various building forms. Furthermore, the technique selected to define a generated building form has a significant role in the final result. The concept of isolating the indoor area with the best air circulation and excluding areas with low-moving or stagnant air can contribute to move toward optimization in design. Therefore, the created forms reflect the fluidity of natural ventilation while acquiring prospects of high natural ventilation performance.
- In the investigation into the natural ventilation of buildings, contours of velocity, turbulence intensity, and turbulent kinetic energy for a given geometry (here, an orthogonal form with low windward and high leeward openings, as shown in Figure 1 a) and for different initial Froude numbers (here, Fr0 =1.15, 2.79, 4.85 with U =0.62, 1.5, 2.6 m/s, respectively, and ΔΤinitial =4 Κ), provide data that can be used creatively in architectural morphology and architectural synthesis through various manners.
Velocity contours show that as the initial Froude number (Fr0 ) decreases, by changing wind velocity, the region with zero or approximately zero velocity increases. While as the initial Froude number increases, contours with relatively increased velocities approach the orthogonal form. Thus, architectural design influenced by streamlines has particular importance, especially when the initial Froude number is small and the wind velocity is low.
Turbulence intensity contours show that the upper right corner (interior of the windward side) of the space has very low values of turbulence intensity (close to zero) for Fr0 =1.15. This result alters gradually as the initial Froude number (Fr0 ) is increased. High values of this parameter are observed at the central zone near the floor while increased values and a relatively high gradient are observed at the bottom left corner (interior of the leeward side). High turbulence intensity indicates high aesthesis of intensity for people residing in the respective areas. Contour configurations obtain a loose morphology and curved face in opposite regions of the main flow area. Furthermore, these positions have relatively low values of turbulence intensity, thereby indicating a correspondingly smooth aesthesis of intensity. The areas with increased turbulence intensity also show better diffusion prospects in comparison to those with decreased turbulence intensity.
Turbulent kinetic energy contours show that a relatively high gradient is also observed at the bottom left corner of the space, particularly at the central vertical planes (z=0.75 m, z=0.5625 m). Increased values of turbulent kinetic energy are shown particularly in the central zone near the floor (approximately y 0.5 m). Moreover, as Fr0 increases by changing wind velocity, the values of turbulent kinetic energy also increase. Increased turbulent kinetic energy also relates to an increase in intensity perception, as well as the improvement of pollutant diffusion.
- Natural ventilation research infuses a “breathing” attitude to architectural design, thus underlining a new dimension for subjects such as synthesis, effectiveness, performance, configuration, geometry, form, energy, intensity, perception, and existence. This process sets a renascent relation between build environment and life.
Acknowledgments
This research was supported by a scholarship provided by IKY (State Scholarships Foundation, Greece) to the author. The author would also like to thank Professor Panagiotis E. Prinos (Division of Hydraulics and Environmental Engineering, Department of Civil Engineering, Aristotle University of Thessaloniki, Greece ) for his support and useful discussions about this paper.
References
- Aldawoud, 2013 A. Aldawoud; The influence of the atrium geometry on the building energy performance; Energy Build., 57 (2013), pp. 1–5
- Allen and Ditsworth, 1972 T. Allen Jr., R.L. Ditsworth; Fluid Mechanics. International Student Edition; McGraw-Hill Kogakusha, LTD, Tokyo-Auckland-Düsseldorf-Johannesburg-London-Mexico-New Delhi-Panama- São Paulo-Singapore-Sydney (1972)
- Attia et al., 2012 S. Attia, E. Gratia, A. De Herde, J.L.M. Hensen; Simulation-based decision support tool for early stages of zero-energy building design; Energy Build., 49 (2012), pp. 2–15
- Attia et al., 2013 S. Attia, M. Hamdy, W. O׳Brien, S. Carlucci; Assessing gaps and needs for integrating building performance optimization tools in net zero energy buildings design; Energy Build., 60 (2013), pp. 110–124
- Bernal, 1939 J.D. Bernal; The Social Function of Science, George Routledge & Sons, London (1939)
- Chen, 2004 Q.Y. Chen; Using computational tools to factor wind into architectural environment design; Energy Build., 36 (2004), pp. 1197–1209
- Da Graça et al., 2012 G.C. Da Graça, N.R. Martins, C.S. Horta; Thermal and airflow simulation of a naturally ventilated shopping mall; Energy Build., 50 (2012), pp. 177–188
- Dahan – Dalmedico, 2011 A. Dahan – Dalmedico; Mathematics and the sensible world: representing, constructing, simulating; Archit. Des., 81 (4) (2011), pp. 18–27
- Fisher, 2012 A. Fisher; Engineering Integration: Real-Time Approaches to Performative Computational Design; Archit. Des., 82 (2) (2012), pp. 112–117
- Fluent Incorporated, 2001 Fluent Incorporated, 2001. Fluent 6.0 documentation.
- Fluent Incorporated, 2000 Fluent Incorporated, 2000. Gambit 1.3 documentation.
- Fotolia, 2010 Fotolia, 2010.
- Givens, 2011 T. Givens; 10 Design: beyond neutrality; Archit. Des., 81 (6) (2011), pp. 112–117
- Goldblatt, 2007 D. Goldblatt; Lightness and fluidity: remarks concerning the aesthetics of elegance; Archit. Des., 77 (1) (2007), pp. 10–17
- Greenberg et al., 2013 D. Greenberg, K. Pratt, B. Hencey, N. Jones, L. Schumann, J. Dobbs, Z. Dong, D. Bosworth, B. Walter; Sustain: an experimental test bed for building energy simulation; Energy Build., 58 (2013), pp. 44–57
- Hensel and Menges, 2008 M. Hensel, A. Menges; Inclusive performance: efficiency versus effectiveness towards a morpho-ecological approach for design; Archit. Des., 78 (2) (2008), pp. 54–63
- Hensel et al., 2012 M. Hensel, D. Sunguroğlu Hensel, M. Gharleghi, S. Craig; Towards an Architectural History of Performance: Auxiliarity, Performance and Provision in Historical Persian Architectures; Archit. Des., 82 (3) (2012), pp. 26–37
- Hiyama and Kato, 2011 K. Hiyama, S. Kato; Integration of three-dimensional CFD results into energy simulations utilizing an Advection-Diffusion Response Factor; Energy Build., 43 (2011), pp. 2752–2759
- Hygh et al., 2012 J.S. Hygh, J.F. DeCarolis, D.B. Hill, S.R. Ranjithan; Multivariate regression as an energy assessment tool in early building design; Build. Environ., 57 (2012), pp. 165–175
- Ihm and Krarti, 2012 P. Ihm, M. Krarti; Design optimization of energy efficient residential buildings in Tunisia; Build. Environ., 58 (2012), pp. 81–90
- Lam and Yeang, 2009 K.P. Lam, K. Yeang; Computational building performance modelling and ecodesign; Archit. Des., 79 (5) (2009), pp. 126–129
- Leach, 2009 N. Leach; Digital morphogenesis; Archit. Des., 79 (1) (2009), pp. 32–37
- Lomas, 2007 K.J. Lomas; Architectural design of an advanced naturally ventilated building form; Energy Build., 39 (2007), pp. 166–181
- McLean, 2008 W. McLean; AD+McLean׳s nuggets; Archit. Des., 78 (3) (2008), pp. 120–121
- Menges, 2006 A. Menges; Instrumental geometry; Archit. Des., 76 (2) (2006), pp. 42–53
- Rahm, 2009 P. Rahm; Meteorological architecture; Archit. Des., 79 (3) (2009), pp. 30–41
- Schulze and Eicker, 2013 T. Schulze, U. Eicker; Controlled natural ventilation for energy efficient buildings; Energy Build., 56 (2013), pp. 221–232
- Schumacher, 2009 P. Schumacher; Parametricism: a new global style for architecture and urban design; Archit. Des., 79 (4) (2009), pp. 14–23
- Stavridou and Prinos, 2006a A. Stavridou, P. Prinos; Investigating natural ventilation in a room using computational fluid dynamics; Prot. Restor. Environmet VIII, July (2006), pp. 3–7 Chania
- Stavridou and Prinos, 2006b Stavridou, A., Prinos, P., 2006b. The impact of openings׳ position on natural ventilation of buildings (Greek version). 10th Pan-Hellenic Scientific Conference of G.H.U. (Greek Hydrotechnic Union), December 13-16, Xanthi.
- Stavridou, 2009 A. Stavridou; “Breathing House” – The house that “breaths” – Residence with a gallery and an atelier; Diploma thesis Department of Architecture, Faculty of Engineering, Aristotle University of Thessaloniki (2009)
- Stavridou, 2011 A.D. Stavridou; Investigation of natural ventilation of buildings with computational and laboratory simulation. Impact on architectural design; Ph.D. thesis (Greek version) Department of Civil Engineering, Faculty of Engineering, Aristotle University of Thessaloniki (2011)
- Stavridou and Prinos, 2013 A.D. Stavridou, P.E. Prinos; Natural ventilation of buildings due to buoyancy assisted by wind: Investigating cross ventilation with laboratory and computational simulation; Build. Environ., 66 (2013), pp. 104–119
- Suárez et al., 2011 M.J. Suárez, A.J. Gutiérrez, J. Pistono, E. Blanco; CFD analysis of heat collection in a glazed gallery; Energy Build., 43 (2011), pp. 108–116
- Wang et al., 2012 S. Wang, Z. Shen, L. Gu; Numerical simulation of buoyancy-driven turbulent ventilation in attic space under winter conditions; Energy Build., 47 (2012), pp. 360–368
- Weinstock and Stathopoulos, 2006 M. Weinstock, N. Stathopoulos; Advanced simulation in design; Archit. Des., 76 (2) (2006), pp. 54–59
- Weinstock, 2008a M. Weinstock; Can Architectural Design Be Research?; Archit. Des., 78 (3) (2008), pp. 112–115
- Weinstock, 2008b M. Weinstock; Metabolism and Morphology; Archit. Des., 78 (2) (2008), pp. 26–33
- Woods, 2008 L. Woods; Drawn into Space: Zaha Hadid; Archit. Des., 78 (4) (2008), pp. 28–35
- Wu et al., 2011 Y.-C. Wu, A.-S. Yang, L.-Y. Tseng, C.-L. Liu; Myth of ecological architecture designs: Comparison between design concept and computational analysis results of natural-ventilation for Tjibaou Cultural Center in New Caledonia; Energy Build., 43 (2011), pp. 2788–2797
- Zerefos et al., 2012 S.C. Zerefos, C.A. Tessas, A.M. Kotsiopoulos, D. Founda, A. Kokkini; The role of building form in energy consumption: The case of a prismatic building in Athens; Energy Build., 48 (2012), pp. 97–102
Document information
Published on 12/05/17
Submitted on 12/05/17
Licence: Other
Share this document
Keywords
claim authorship
Are you one of the authors of this document?
