Abstract
Decadal variations of extreme tropical cyclones (TCs) influencing China were investigated based on the tracks, landfall information, precipitation and wind data during 1949–2009. The extreme landfall date events are less in the 1970s and 2000s. The number of extreme events of maximum wind speed and minimum pressure near TC’s center reached the highest in the 2000s. The extreme rain duration events had the highest frequence in the 1970s, and the extreme strong wind duration events had the maximum frequence in the 1980s. The number of stations whereat the extreme maximum daily precipitation or process precipitation is observed, is the largest in the 1960s, and the number of stations whereat daily maximum wind speed events are observed, is the largest in the 1980s.
Keywords
tropical cyclone ; extreme events ; decadal variation ; maximum landfall intensity ; landfall date ; maximum precipitation
1. Introduction
Tropical cyclones (TCs) cause severe economic losses and death along the seashore of China every year [ Xu and Gao, 2005 and Zhang et al., 2009 ]. Global warming may influence the frequencies, landfall position and intensity of TCs [ Landsea et al., 1996 , Webster et al., 2005 , Emanuel, 2005 and Zhang et al., 2011 ]. Many researchers showed that the genesis, average intensity and extreme intensity of landfall TCs on China have decreasing long-term trends [ Cao et al., 2006 and Wang et al., 2007a ]. With the development of economy, the direct economic losses induced by TCs have been increasing while the death shows a decreasing trend in the period 1982–2006 [ Xiao and Xiao , 2010 ]. The influence of TCs on China does not only relate to TCs intensity, but also to the landfall position, affected area and influencing duration.
The maximum wind speed near the center of TCs while landing on China denotes the intensity of landfall TC. Under the background of global warming, the frequence and extreme intensity of TCs landfall on China show decreasing trends. The first landfall in the course of a calender year has been delayed, the last landfall has advanced and the typhoon season has been shortened [ Ding and Sun, 2006 , Wang and Ren, 2007 , Wang et al., 2007b , Ren et al., 2007 , Ren et al., 2008 and Hu et al., 2008 ]. The extreme events of TCs influencing China include the extreme envents of landfall date, minimum pressure near the center of TCs while landing on China, wind speed and rainfall of the influenced area, influencing duration of gale and rainfall. Since the studies on the extreme events of TCs influencing China are not considered deeply, we use the TCs data compiled by the Shanghai Typhoon Institute to analyze the characteristics and decadal variations of the extreme events of TCs influencing China.
2. Data and methods
The influencing TCs denote TCs bringing gales or rainfall to China. The information of influencing TCs during 1949–2009 are selected from the Typhoon Yearbook (1949–1988) and Tropical Cyclone Yearbook (1989–2009) compiled by Shanghai Typhoon Institute, including the landfall date, landfall position, intensity and influencing duration. The wind speed and precipitation data are from the meteorological gauge observations during 1949–2009 compiled by the Shanghai Typhoon Institute. The rain duration denotes the number of days with daily precipitation exceeding 10 mm. The gale duration denotes the number of days with maximum 10-minute-mean wind speed exceeding 10.8 m s–1 .
Usually, the percentile is used to select thresholds in the study of climate extreme events. Values exceeding the thresholds are considered as extremes [ Zhai and Pan, 2003 and Wang and Zhai, 2008 ]. The landfall date, frequency, maximum wind speed and minimum pressure near the TC’s center when landing on China, rain duration, and gale duration are ordered in ascending sequence and the 95% (5%) maximum (minimum) value is considered as the threshold. The results show that the thresholds of the extreme events of influencing TCs include landfall date before 7 June or after 18 October, landfall over 3 times, the maximum wind speed near TC’s center while landing on China exceeding 32.7 m s–1 , the minimum central pressure near TC’s center while landing on China less than 950 hPa, rainfall duration over 8 days, gale duration over 6 days.
To show the decadal variations of extreme TCs influencing China, sixty years from 1950 to 2009 are divided into six decades and each covers 10 years. For example, the 1990s denotes 1990–1999.
3. Characteristics of the extreme influencing TCs
3.1. Landfall date and frequency
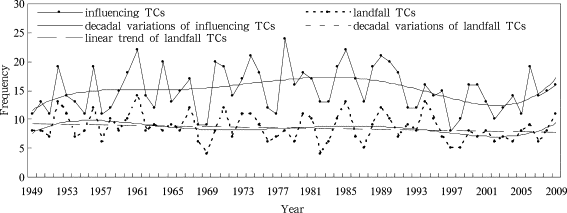
In average, there are about 15 TCs every year influencing China with 14 causing rainfall and 13 inducing gale. The annual frequency of influencing TCs has significant interdecadal variation. The frequency increased from 1949 to the end of the 1980s, decreased in the 1990s, and increased again in the 2000s (Fig. 1 ). Ma and Chen [2009] showed that most of TCs from the western North Pacific and South China Sea are generated in the ITCZ (inter-tropical convergence zone) which has weakened and moved toward the Equator during 1949–2007 and is not favorable for TCs genesis. There are about 9 TCs landing on China every year, accounting for about 60.3% of the total influencing TCs. The annual frequency of landfall TCs has a long-term decreasing trend and significant interdecadal variations which increased from 1949 to the end of the 1950s, then decreased until the end of the 1990s and increased in the 2000s (Fig. 1 ).
|
|
|
Figure 1. Annual frequency of China’s influencing TCs and landfalls during 1949–2009 |
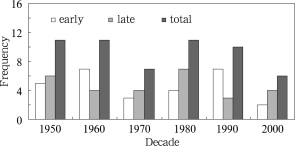
TCs from the western North Pacific and the South China Sea influence China all the year while the landfall TCs mainly occur from April to December. The landfall date of Neoguri in 2008 is 18 April which is the earliest since 1949. The landfall date of Nanmadol in 2004 is 4 December which is the latest since 1949. The extreme early events occurred more frequently in the 1960s and 1990s while less in the 2000s. The extreme late events occurred more frequently in 1950s and 1980s while less in the 1990s. In summary, the extreme landfall date events occurred less in the 1970s and 2000s (Fig. 2 ).
|
|
|
Figure 2. Decadal variation of the extreme events of landfall date |
During 1949–2009, 71.6% of the landfalling TCs (557) landed once, 24.1% landed twice, and 4.3% landed over 3 times. Only Trix in 1960 and Yancy in 1990 landed 4 times with the first landfall position in Taiwan and the landfall dates in August. According to Ren et al. [2008] , the landfall positions of TCs are divided into 3 types: Taiwan island, Hainan island, and mainland. The frequency of landfalls in one place were the highest, those in two places the next and only one TC made landfall in three places during 1951–2004. In all, most of the landfalls made landfall in one place and only a few more times or in more places.
3.2. Landfall intensity
The landfall intensity includes the maximum wind speed and minimum pressure near the TC’s center while the TC landing on China. According to the maximum wind speed during 1949–2009, the frequency of 12-grade (32.7–36.9 m s–1 ) is the highest (33.0%), the frequency of 11-grade (28.5–32.6 m s–1 ) is the next (13.6%), and the frequency of wind speed exceeding 12-grade is the least (2.0%). There are 11 extreme maximum wind speed events of landfall TCs with the maximum wind speed exceeding 12-grade which all occurred in 2006–2009. Four of them landed on mainland and 7 landed on Chinese Taiwan.
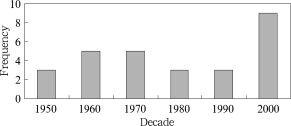
According to the minimum pressure near the center of landfall TCs during 1949–2009, the frequency of 990–1,000 hPa is the highest. There are 28 extreme minimum pressure events with the minimum pressure lower than 950 hPa from 1950 to 2009 which occurred more frequently in the 2000s and less in the 1950s, 1980s and 1990s (Fig. 3 ). The frequency of extreme maximum wind speed and minimum pressure events is high in the 2000s especially in 2005–2008. Some researches showed that although the extreme landfall intensity has a long-term decreasing trend [ Wang and Ren , 2008 ], the extreme landfall intensity increased significantly in 2005 and 2006 [ Liu et al. , 2009 ]. Saomai in 2006 had the most extreme landfall maximum wind speed of 17-grade and the most extreme landfall minimum pressure of 920 hPa.
|
|
|
Figure 3. Decadal variation of the extreme events of minimum pressure near the center of TCs when landing on China |
3.3. Tropical cyclone rainfall
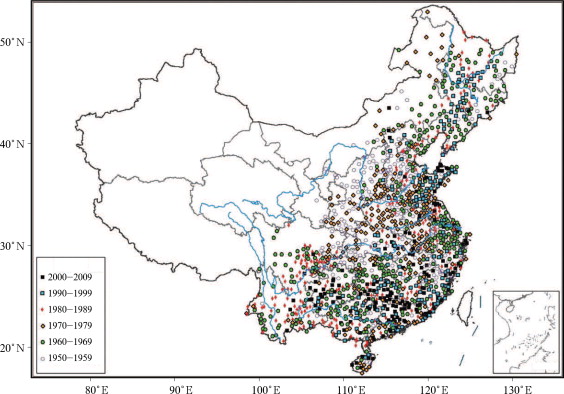
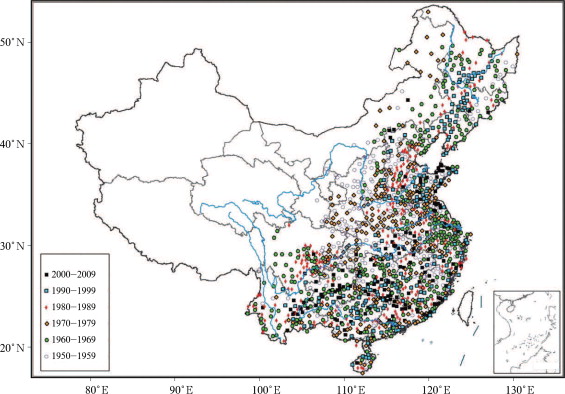
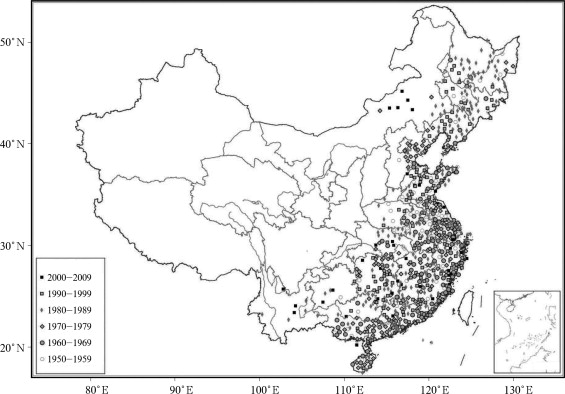
Rainstorm induced by TCs may cause extreme rainfall event on the seashore of southeast China and some part the inland areas [ Wang et al. , 2008 ]. The maximum daily precipitation induced by TCs is about 100–200 mm in South China, most part of Jiang-Nan, Jiang-Huai, Huang-Huai, eastern North China, Liaoning and Jilin provinces, and exceeds 200 mm in the seashore of South China, Fujian, Zhejiang, Jiangsu and the seashore of Shandong province during 1949–2009. The daily precipitation in Changdao, Shandong province achieved 839 mm on 10 July, 2006. About 24% of the maximum daily precipitation occurred in the 1960s. The frequency of maximum daily precipitation is high in the 1950s and 1970s in eastern Northwest China, the 1950s, 1970s and 1980s in North China, the 1970s, 1980s and 2000s in Huang-Huai, the 1960s, 1980s and 2000s in Jiang-Huai, the 1960s, 1980s and 1990s in Northeast China (Fig. 4 ).
|
|
|
Figure 4. Spatial distribution of decade when the maximum daily precipitation occured induced by tropical cyclones |
The maximum process precipitation induced by TCs is about 100–300 mm in South China, Jiang-Nan, Jiang-Huai, Huang-Huai, middle-east North China, eastern and southern Northeast China, southern Yunnan, Guizhou, about 300–600 mm along the seashore of South China, eastern Fujian, southeastern Zhejiang, and exceeds 600 mm in some part of the above areas during 1949–2009. The maximum process precipitation in Changjiang, Hainan province achieved 1,281 mm from 27 August to 12 September, 2001. About 49% of the maximum process precipitation occurred in the 1960s. Ren et al. [2006] showed that the annual precipitation induced by TCs in most part of China had a decreasing trend, accompanied by a decreasing trend in the annual frequency of influencing TCs. The stronger the landfall intensity is, the heavier is the process precipitation. However, there is no significant linear relationship between them [ Chen et al. , 2007 ]. The maximum process precipitation of different areas occurred in different eras. The frequency of maximum process precipitation was high in the 1950s and 1970s in eastern Northwest China and western North China, the 1970s and 1990s in Huang-Huai, the 1960s, 1980s and 2000s in eastern Southwest China, the 1970s, 1980s and 1990s in North China (Fig. 5 ).
|
|
|
Figure 5. Spatial distribution of decade when the maximum process precipitation occurred induced by tropical cyclones |
The influencing durations of TC rainfall and gale are important factors causing disasters. The average duration of TC rainfall is 4.6 days and the extreme threshold is 8 days. The frequency of extreme rainfall duration events increased from the 1950s to 1970s and then decreased from the 1980s to 2000s (Fig. 6 ). The longest rainfall duration is 22 days from 17 August to 7 September, 1986, which is caused by Wayne landing on China 3 times.
|
|
|
Figure 6. Decadal variation of the extreme durations of rainfall and gale induced by tropical cyclones |
3.4. Tropical cyclone gale
Yang and Lei [2004] showed that TC gale (wind speed over 6-grade) mainly occurred in the seashore of southeast China and the frequencies of TC gale paralleled with the seashore and decreased from seashore to inland. TC gales over 8-grade seldomly occurs north of the Hangzhou bay. The maximum TC gale is about 10.8–17.2 m s–1 in most part of South China, middle and east of Jiang-Nan, Jiang-Huai, eastern Huang-Huai, eastern and southern Northeast China, eastern Hebei, and exceeds 17.2 m s–1 along the seashore of South China and eastern Fujian. The TC gales in Dongshan, Fujian province is 48.0 m s–1 and occurred on 19 September, 1980. The frequency of extreme TC gale was 10.1% in the 1950s, increased to 30.2% in the 1980s and then decreased in the succeeding decades. The frequency of TC gales is high in the 1980s and 1990s in Northeast China, North China and Huang-Huai, the 1980s in Jiang-Han, the 1980s and 2000s in eastern Southwest China (Fig. 7 ).
|
|
|
Figure 7. Spatial distribution of decade when the extreme gale occurred induced by tropical cyclones |
The average TC gale duration is 4 days and the extreme threshold is 6 days during 1949–2009. The extreme TC gale duration events occurred most frequently in the 1970s and 1980s and then decreased in the succeeded decades (Fig. 6 ). The longest TC gale duration was 15 days from 15 to 29 September, 1976 caused by Iris that landed on China 3 times.
4. Conclusions
The thresholds of extreme events of TCs influencing China were defined to show the decadal variations under the background of global warming. The extreme early or late landfall date events occurred less in the 1970s and 2000s and more in the other decades. The extreme maximum landfall wind speed events occurred mostly during 2006–2009 and the extreme minimum landfall pressure events occurred most frequently in the 2000s. In all, although the total frequency of TCs influencing China has decreased during 1949–2009, the extreme landfall intensity increased since 2000. The frequencies of TCs influencing China were more in 1970s and 1980s than in other decades which caused more extreme events of rainfall and gale. The extreme TC rainfall duration events occurred most frequently in the 1970s. The maximum daily and process precipitation occurred most frequently in the 1980s. The extreme TC gale duration events and TC gales occurred most frequently in the 1980s.
Acknowledgements
This research was supported by the National Key Technology Research and Development Program (No. 2008BAC44B03, 2007BAC29B04).
References
- Cao et al., 2006 C. Cao, J.-Y. Peng, J.-H. Yu; An analysis on the characteristics of landfalling typhoons in China under global climate warming; Journal of Nanjing Institute of Meteorology (in Chinese), 29 (4) (2006), pp. 455–461
- Chen et al., 2007 Z.-Q. Chen, L.-S. Chen, Y. Liu, et al.; The spatial and temporal characteristics of tropical cyclone-induced rainfall in China during 1960–2003; Journal of Applied Meteorological Science (in Chinese), 18 (4) (2007), pp. 427–434
- Ding and Sun, 2006 Y.-H. Ding, Y. Sun; Recent advances in climate change science; Advances in Climate Change Research (in Chinese), 2 (4) (2006), pp. 161–167
- Emanuel, 2005 K.A. Emanuel; Increasing destructiveness of tropical cyclones over the past 30 years; Nature, 436 (2005), pp. 686–688
- Hu et al., 2008 Y.-M. Hu, L.-L. Song, A.-J. Liu, et al.; Analysis of the climatic features of landfall tropical cyclones in China during the past 58 years; Acta Scientiarum Naturalium Universitatis Sunyatseni (in Chinese), 47 (5) (2008), pp. 115–121
- Landsea et al., 1996 C.W. Landsea, N. Nicholls, W.M. Gray, et al.; Downward trends in the frequency of intense Atlantic hurricanes during the past five decades; Geophys. Res. Lett., 23 (1996), pp. 1697–1700
- Liu et al., 2009 Y. Liu, L.-X. Lin, Z. Huang, et al.; Climatic characteristics of landfalling tropical cyclones over China based on new grade standards; Meteorological Science and Technology (in Chinese), 37 (3) (2009), pp. 294–300
- Ma and Chen, 2009 L.-P. Ma, L.-S. Chen; The relationship between global warming and the variation in tropical cyclone frequency over the western North Pacific; Journal of Tropical Meteorology, 15 (1) (2009), pp. 38–44
- Ren et al., 2008 F.-M. Ren, X.-L. Wang, L.-S. Chen, et al.; Tropical cyclones landfalling in the mainland, Hainan and Taiwan of China and their interrelations; Acta Meteorologica Sinica (in Chinese), 66 (2) (2008), pp. 224–235
- Ren et al., 2007 F.-M. Ren, X.-L. Wang, W.-J. Dong, et al.; Changes in the first-landfall and last-landfall tropical cyclones in China; Advances in Climate Change Research (in Chinese), 3 (4) (2007), pp. 224–228
- Ren et al., 2006 F.-M. Ren, G.-X. Wu, W.-J. Dong, et al.; Changes in tropical cyclone precipitation over China; Geophysic, 33 (2006) http://dx.doi.org/10.1029/2006GL027951
- Wang and Ren, 2007 X.-L. Wang, F.-M. Ren; Variations in frequency and intensity of strong tropical cyclones affecting China during 1957–2004; Advances in Climate Change Research (in Chinese), 3 (6) (2007), pp. 345–349
- Wang and Ren, 2008 X.-L. Wang, F.-M. Ren; Variations in frequency and intensity of landfall tropical cyclones over China during 1951–2004; Marine Forecasts (in Chinese), 25 (1) (2008), pp. 65–73
- Wang and Zhai, 2008 X.-L. Wang, P.-M. Zhai; Changes in China’s precipitation in various categories during 1957–2004; Journal of Tropical Meteorology (in Chinese), 24 (5) (2008), pp. 459–466
- Wang et al., 2007a X.-L. Wang, Y.-M. Wang, F.-M. Ren, et al.; Interdecadal variations in frequencies of typhoons affecting China during 1951–2004; Advances in Climate Change Research, 5 (2007), pp. S66–S69
- Wang et al., 2007b Y.-M. Wang, W.-J. Li, F.-M. Ren, et al.; Study on climatic characteristics of China-influencing typhoons and the interrelations between them and their environmental factors; Journal of Tropical Meteorology (in Chinese), 23 (6) (2007), pp. 538–544
- Wang et al., 2008 Y.-M. Wang, F.-M. Ren, W.-J. Li, et al.; Climatic characteristics of typhoon precipitation over China; Journal of Tropical Meteorology (in Chinese), 24 (3) (2008), pp. 233–238
- Webster et al., 2005 P.J. Webster, G.J. Holland, J.A. Curry, et al.; Changes in tropical cyclone number, duration, and intensity in a warming environment; Science, 309 (2005), pp. 1844–1846
- Xiao and Xiao, 2010 F.-J. Xiao, Z.-N. Xiao; Characteristics of tropical cyclones in China and their impacts analysis; Natural Hazards, 54 (2010), pp. 827–837
- Xu and Gao, 2005 L.-Y. Xu, G. Gao; Features of typhoon in recent 50 years and annual disaster assessment; Meteorological Monthly (in Chinese), 31 (3) (2005), pp. 41–44
- Yang and Lei, 2004 Y.-H. Yang, X.-T. Lei; Statistics of strong wind distribution caused by landfall typhoon in China; Journal of Tropical Meteorology (in Chinese), 20 (6) (2004), pp. 633–642
- Zhai and Pan, 2003 P.-M. Zhai, X.-H. Pan; Change in extreme temperature and precipitation over northern China during the second half of the 20th century; Acta Geographica Sinica (in Chinese), 58 (2003), pp. 1–10
- Zhang et al., 2011 J.-Y. Zhang, L. Wu, Q. Zhang; Tropical cyclone damages in China under the background of global warming; Jounrnal of Tropical Meteorology (in Chinese), 27 (4) (2011), pp. 442–454
- Zhang et al., 2009 Q. Zhang, L. Wu, Q. Liu; Tropical cyclone damages in China 1983–2006; Bull. Amer. Meteor. Soc., 90 (2009), pp. 485–495
Document information
Published on 15/05/17
Submitted on 15/05/17
Licence: Other
Share this document
Keywords
claim authorship
Are you one of the authors of this document?
