1 Introduction
Explosions generate hazards to vulnerable infrastructures and the people using them including buildings, vehicles, chemical process facilities and many manufacturing operations. Regardless of the cause (deliberate or accidental), explosions arising from rapid combustion processes generate shock waves, intense heat, and gas whose pressure significantly exceeds the ambient condition.
In addition to the blast wave these explosions can lead to the generation of both primary fragments and secondary debris which can cause severe damage to the immediate surrounding environment. Primary fragments composed of pieces of the exploding structure, or of components that were in direct contact, can reach velocities in excess of 1000 ms-1. Secondary fragments, generated by the interaction of the shockwave and primary fragments with surrounding materials, can exhibit a wide range of dimensions and velocities (60 to 360 ms-1) [1]. Terrorist attacks across the globe continue to show the great vulnerability of civil and transport infrastructures to this kind of threat. Attacks in airports, railway and underground stations as well as both civil and governemental buildings have resulted in great damages and losses. This is further compounded when the explosion is followed by partial or full collapse of the immediate structures [2].
Materials are the cornerstone of blast/fragment protection solutions, not only through individual materials, but more efficiently through the use of material combinations. The consideration of multi-material synergies is important in the material design phase, in order to guarantee the overall desired efficiency of the developed system.
This paper shows the preliminary results of research focused on the study of the behaviour of metallic foam core composite structures under impulsive loads, namely impact. To that aim, a series of aluminium foam core panels have been designed based on two foam densities and three alumnium alloys in sheet form (with varying thickness). One of the alloys had two different thermal treatments assessed.
In addition to the ballistic projectile impact tests for the determination of the panel impact performance (resistance to projectile perforation and fragment retention ability), the tested panels have been assessed using visual inspection as well as infra-red thermography and X-ray tomography. The influence of panel deformation as well as the delamination between structural layers has been assessed.
2 Materials
2.1 Test panels
In this study, the authors have investigated multi-layer material impact behavior under relevant test conditions. The multi-layer specimens manufactured for this study were based on combinations of commercial materials typically used structurally in vehicles or buildings. Aluminium sheets of three alloy types (AW 1050 H24, AW 5005 (H24 and H28) and AW 6082 T6) were adhesively bonded to the aluminium foam cores using thixotropic structural adhesives supplied by Sika.
1050 aluminium alloy is an aluminium-based alloy in the "commercially pure" wrought family with high electrical conductivity, corrosion resistance, and cold workability.
5005 aluminium alloy is a member of the 5000 series of aluminum-magnesium wrought alloys and can attain moderate to high strength by cold working. 5005 has relatively high welded strength compared to other aluminum alloy families.
6082 aluminium alloy is an alloy in the wrought aluminium-magnesium-silicon series. It is typically formed by extrusion and rolling. It cannot be work hardened, but is commonly heat treated to produce tempers with a higher strength but lower ductility.
H24 refers to a roll hardened and then annealed to half hard grade alloy treatment, while H28 refers to full hardness treatment and T6 to a solution heat treament followed by artifical ageing of the aluminium. The alloys and treatments were selected for their different mechanical properties as well as their relevance to panels under study in other comparative studies carried out by the authors.
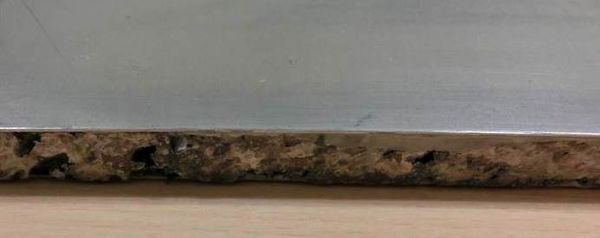
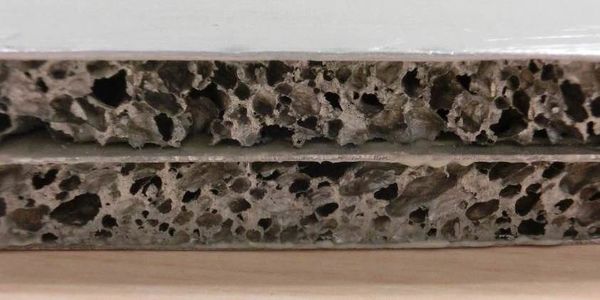
Foamed aluminium cores (SmartMetal™ stabilized aluminum foam from Cymat Technologies) were supplied with two densities: 7% and 16% density (200 and 430 kgm-3 respectively). Core thicknesses ranged from 12.7mm to 30mm and were arranged in either single or double core profiles (Figure 1). This arrangement was selected to determine if multiple cores performed better at absorbing the impact energy.
Table 1 lists the test panels manufactured and tested in this study. Several aluminium alloys were studied
| No | Panel | Thickness (mm) | |||
| Al sheet + Al foam density | Al Sheet | Al foam | Al sheet | Total | |
| 1 | 2.5mm Al 5005 sheet only | 2.5 | - | - | 2.5 |
| 2 | 0.8mm Al 5005 (16% foam) | 0.8 | 30 | 0.8 | 31.6 |
| 3 | 30mm 16% foam only | - | 30 | - | 30 |
| 4 | 0.8mm Al 1050 (7% foam) | 0.8 | 12.7 | 0.8 | 14.3 |
| 5 | 0.8mm Al 1050 (7% foam) | 0.8 | 26.6 | 0.8 | 28.2 |
| 6 | 0.8mm Al 1050 (7% foam double core) | 0.8 | 12.7/12.7 | 0.8 | 27.8 |
| 7 | 0.8mm Al 1050 (16% foam) | 0.8 | 12.7 | 0.8 | 14.3 |
| 8 | 0.8mm Al 1050 (16% foam) | 0.8 | 30 | 0.8 | 31.6 |
| 9 | 0.8mm Al 1050 (16% foam double core) | 0.8 | 12.7/12.7 | 0.8 | 27.8 |
| 10 | 1mm Al 5005 (16% foam) | 1.0 | 12.7 | 1.0 | 14.7 |
| 11 | 1.5mm Al 5005 (16% foam) | 1.5 | 12.7 | 1.0 | 15.2 |
| 12 | 2mm Al 5005 (16% foam) | 2.0 | 12.7 | 1.0 | 15.7 |
| 13 | 1mm Al 6082 T6 (16% foam) | 1.0 | 12.7 | 1.0 | 14.7 |
| 14 | 1mm Al 6082 T6 (16% foam) | 1.0 | 12.7 | 1.0 | 14.7 |
| 15 | 1mm Al 6082 T6 (16% foam) | 1.0 | 12.7 | 1.0 | 14.7 |
2.2 Mechanical Properties
Table 2 lists the density, ρ, Youngs modulus, Ε, yield strength, σy, poisons ratio, ν, and tensile strength, σ, of the four aluminium sheet materials and two aluminium foam cores used in the study.
| Material | ρ
(kg/m3) |
Ε
(GPa) |
σy
(MPa) |
ν | σ
(MPa) |
| AW1050 H24 | 2.71 | 71 | 85 | 0.33 | 145 |
| AW5005 H24 | 2.70 | 70 | 110 | 0.33 | 165 |
| AW5005 H28 | 2.695 | 70 | 195 | 0.33 | 185 |
| AW6082 T6 | 2.71 | 70 | 255 | 0.33 | 300 |
| Smartmetal Al foam 7% | 0.16 | 0.23 | 1.0* | NA | 0.7* |
| Smartmetal Al foam 16% | 0.43 | 1.2 | 4.0* | NA | 3.2* |
2.3 Impact Test Panels
Impact test panels were prepared to nominal dimensions of 250 x 250 mm for panels 1 to 9. Panels 10 to 15 were prepared with dimensions of 250 x 200 mm. Previous test results indicated that the change in panel dimensions for panels 10 to 15 had no impact on the results, except for effectively reducing the available impact area in each test for the projectile to strike.
3 Impact Tests
3.1 Test Characteristics
Impact tests were carried out with impact velocities between 128 ms-1 and 151 ms-1, within the typical range of secondary fragment velocities produced by an explosion.
3.2 Test Procedure
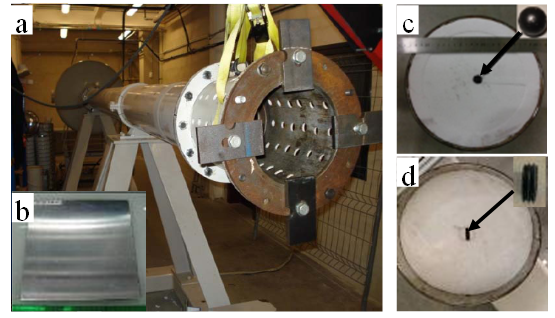
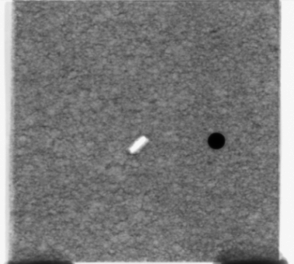
Impact projectiles (ball or disc) were fired from a pneumatic air cannon at medium energies (velocities between 120 to 140 ms-1) to simulate the interaction of secondary fragments with the test panels (Figure 2a). The secondary fragmentation impact tests were recorded using a high speed camera with a frame rate up to 500,000 fps. Incident and resulting velocities were determined by movement analysis software. The specimens were clamped top and bottom in a rigid support structure for both sets of tests to minimize the influence of the clamping on the multi-material response.
Two types of fragments were selected to simulate the secondary fragments:
- 1) steel balls with diameter 15.9 mm and weight 16.5g (Figure 2c) and,
- 2) threaded bolt section discs with diameter 21.0mm and weight 16.0 g (Figure 2d).
The threaded disc projectile was assessed specifically to increase the level of damage upon impact, due to the bolt threads creating a higher load concentration upon contact with the panel surface.
Both types of secondary fragments were embedded in a foamed polystyrene sabot for compatibility with the cannon bore diameter, to guarantee the desired impact velocity and to ensure repeatability. Fragment type A (ball) does not depend on the incident angle of the projectile itself, whereas for the type B fragment (threaded disc), the desired impact orientation was an “edge” impact. This orientation created contact between the sharp edged areas of the disc thereby causing higher damage levels, leading to a greater chance of projectile penetration for a given energy. This second fragment type was selected as being much closer to the shape of secondary fragments generated during an explosion. High speed camera footage was used to measure the incident and reflected/penetrative velocities of the fragments in order to calculate the energy absorbed by each panel.
The impact damage was determined by X-ray computed tomography (CT) on an YXLON Y. CT compact machine equipped with a 450 kV Metal-ceramic X-ray tube Y.TU/450-D09. 720 projections were recorded for each virtual cut done every milimeter. 3D images were reconstructed by VGStudioMax 2.0 Software.
4 Results
4.1 Impact
The initial impact velocities of the secondary fragments and the resulting fragment velocities, either as a consequence of full moment transfer to the multi-material through rebound/penetration phenomena, or partially, through perforation phenomena, are listed in Table 3. The calculated ballistic limit velocity and perforation energies are shown. The calculations for perforation velocity are conservative owing partially to the lack of full visibility of the secondary fragment when in close proximity to the test panel immediately after perforation. In addition the calculated velocity is also a function of the selected capture frame rate (i.e. the projectile movement that can be measured between each frame). High speed footage was used to measure the incident and resultant velocities before and after the fragment impact. Three phenomena were observed depending on material energy dissipation and resilience: deformation, penetration or perforation.
Table 3 lists the measured perforation or rebound velocities for all panels, regardless of whether the projectile perforated, rebounded or remainned embedded in the test panel.
The residual velocity of the penetrator has been used as a measure of ballistic performance. In such tests, the initial,Vinit, and the residual velocity, Vres, of the penetrator are compared for several test samples. However, the ballistic performance (absorbed energy, Ep) is often evaluated by comparison of the initial kinetic energy, Einit, and the residual kinetic energy, Eres, where Ep = Eint - Eres.
This is a more precise measure of ballistic performance, since it takes into account the residual mass of the penetrator. However, this also means that the penetrator has to be collected after perforation of the target in order for the energy to be calculated. In the case of this study, the projectiles were measured and no erosion was seen. The advantages of this method are, similar to the V50 test. The V50 is a ballistic test where projectiles are fired at higher and higher velocities until they start penetrating. The velocity of the bullets where 50% of the bullets do not penetrate, and 50% of the bullets do penetrate is the V-50 rating for that ballistic protection.
In the selected test a measurement of the (important) capability of the armour system to erode the penetrator can be found from the residual mass of the penetrator, and also that a comparison with numerical simulations is possible. A clear disadvantage of the test is, that it only compares armour systems that have failed since a prerequisite for comparison is perforation of the targets.
In the majority of cases the impact fragments did not penetrate the panels and several rebounded with a low velocity. Two approximations to quantitative results under conservative hypothesis are calculated; the ballistic limit velocity (Vb), calculated as an approximation to the difference between the velocity when the projectile just remains embedded or exits with a negligible velocity; and perforation energy (Ep), (i.e. the energy absorbed by the structure during perforation considering conservative and quasi-static impact conditions.)
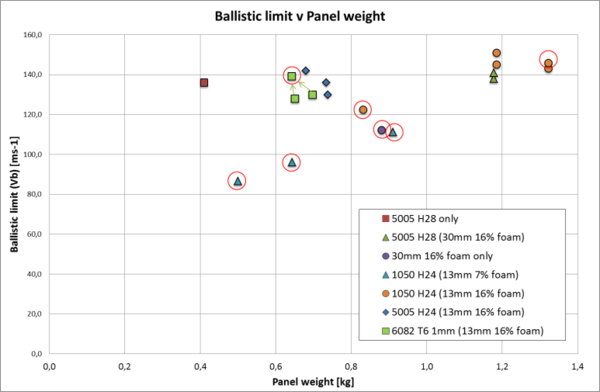
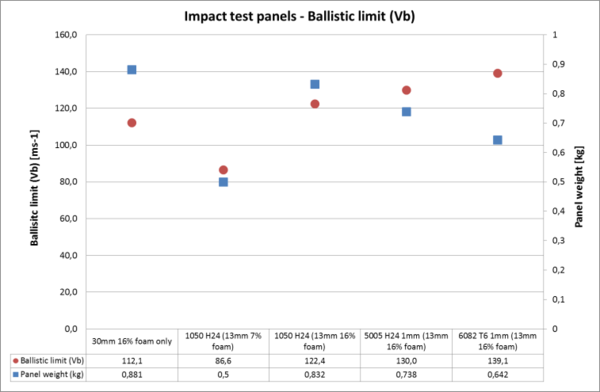
Figure 3 compares the ballistic limit (Vb) against the test weight of each panel. Circled values denote those panels that perforated during the test. Measurement of Vi and Vpof these panelsenabled the calculation of their ballistic limit, Vb. For all other panels, Vb is higher than Vi but the value is currently unknown. The true ballistic limit of these panels could not be calculated (due to lack of perforation).
This work aimed to enhance the impact performance of the panels whilst minimising panel weight. With the exception of the data from the sheet and foam only, in general it can be seen that the ballistic limit increases with increased panel weight. The 1050 aluminium series of panels show a clear trend of increased ballistic limit with increased panel weight (increased foam core thickness, as well as double foam core panels).
| No | Panel description | Thickness (mm) | Panel weight | Projectile type | Velocity
(ms-1) |
Absorbed energy
(J) |
Comments | ||||
| Foam | Total | (kg) | (D)isc
(B)all |
Vi | Vp | Vr | Vb | Ep | |||
| 1 | 2.5mm Al 5005 sheet only | 0 | 2.5 | 0.41 | D | 136 | 0 | 3 | >136 | 147.97 | Rebound |
| 2 | 0.8mm Al 5005 (16% foam) | 30 | 31.6 | 1.18 | B | 138 | 0 | 0 | >138 | 157.02 | Embed |
| D | 141 | 0 | 0 | >141 | 159.05 | Embed | |||||
| 3 | 30mm 16% foam only | 30 | 30 | 0.88 | B | 136 | 77 | 0 | 112.1 | 103.61 | Perforate |
| 4 | 0.8mm Al 1050 (7% foam) | 12.7 | 14.3 | 0.50 | B | 140 | 110 | 0 | 86.6 | 61.84 | Perforate |
| 5 | 0.8mm Al 1050 (7% foam) | 26.6 | 28.2 | 0.64 | B | 146 | 110 | 0 | 96.0 | 75.99 | Perforate |
| 6 | 0.8mm Al 1050 (7% foam double core) | 25.4 | 27.8 | 0.91 | B | 137 | 80 | 0 | 111.2 | 101.98 | Perforate |
| 7 | 0.8mm Al 1050 (16% foam) | 12.7 | 14.3 | 0.83 | B | 140 | 68 | 0 | 122.4 | 123.48 | Perforate |
| 8 | 0.8mm Al 1050 (16% foam) | 30 | 31.6 | 1.19 | B | 145 | 0 | 0 | >145 | 173.35 | Embed |
| D | 151 | 0 | 0 | >151 | 182.41 | Embed | |||||
| 9 | 0.8mm Al 1050 (16% foam double core) | 25.4 | 27.8 | 1.32 | B | 143 | 0 | 0 | >143 | 168.60 | Embed |
| D | 146 | 8 | 0 | 145.8 | 170.02 | Perforate | |||||
| 10 | 1mm Al 5005 (16% foam) | 12.7 | 14.7 | 0.74 | B | 130 | 0 | 0 | >130 | 139.34 | Embed |
| 11 | 1.5mm Al 5005 (16% foam) | 12.7 | 15.2 | 0.68 | B | 142 | 0 | 0 | >142 | 166.25 | Embed |
| 12 | 2mm Al 5005 (16% foam) | 12.7 | 15.7 | 0.73 | B | 136 | 0 | 2 | >136 | 152.50 | Rebound |
| 13 | 1mm Al 6082 T6 (16% foam) | 12.7 | 14.7 | 0.70 | B | 130 | 0 | 2 | >130 | 139.34 | Rebound |
| 14 | 1mm Al 6082 T6 (16% foam) | 12.7 | 14.7 | 0.64 | B | 154 | 66 | 0 | 139.1 | 159.62 | Perforate |
| 15 | 1mm Al 6082 T6 (16% foam) | 12.7 | 14.7 | 0.65 | B | 128 | 0 | 6 | >128 | 135.09 | Rebound |
However through the use of alternative aluminium alloy selection, it was possible to increase the ballistic limit of the panels whilst maintaining lower panel weights.
A comparison of panels with near identical configurations (aluminium skin with 12.7 mm thick Al foam core) is shown in Figure 4. These panels are compared against a 16% dense foam core with no aluminium skin applied, however it must be noted that this panel had a 30 mm thick foam core compared to 12.7 mm for all other panels.
The lower density foam core (7% density) performed significantly lower than the 16% density core and whilst low panel weight was desired, the results showed that the material was incapable of withstanding the impact energies of secondary fragments. A comparison of 12.7 mm thick foam core (16% density) showed an increase in the ballistic limit through the use of different aluminium alloys. Increased ballisitic performance with decreasing panel weight was possible through selection of the aluminium alloy used for the panel skin.
The investigation also looked at alternative foam core arrangements to enhance performance. A double core structure was manufactured for both foam densities and compared against a single foam core structure with similar thickness. The double core consisted of two 12.7 mm thick cores spearated by an additional solid aluminium layer in the centre of the panel. In the case of the lower density foam, the double core increased the Vb from 96 to 111 ms-1 compared to the single core.
For the 16% density foam core, it was not possible to define a clear influence as not all panels suffered perforation. However, in the case of the double core panel, the disc type projectile perforated the panel whilst the ball projectile did not. This result clearly showed the influence of projectile geometry on impact performance and was one of the panels selected for further analysis using X-ray tomography.
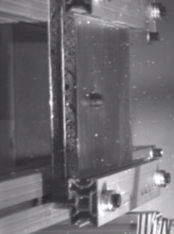
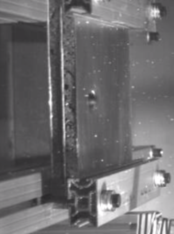
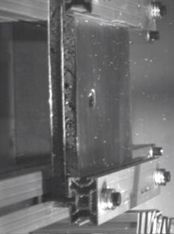
Figure 5. High speed footage of (top) ball impact and (bottom) disc impact on panel 9 (16% density foam double core)
Also of interest is the fact that the double core panel (#9) did not perform as well as the single core panel of near identical thickness (#8). The double core panel was perforated by the disc projectile (Vb = 145.8 ms-1), whilst the single core panel retained the disc projectile which actually had a higher impact velocity (Vb > 151 ms-1). It was expected that the double core panel would offer a greater level of protection but as seen by the results, this was not the case. The two panels (#8 and 9) were then analysed (along with other panels) using the IR thermography and X-ray tomogrpahy analysis techniques.
4.2 Infrared Thermography
In order to effectively measure the damages suffered by the panels after impact testing, non-destructive inspections have been carried out using Infrared Thermography and X-ray Tomography (See 4.3) techniques. Selected panels were analysed from those tested under impact conditions. It was necessary to optimize the IRT inspection procedure for each heating technology used in order to obtain the complete detection of the damages present in the panels.
Thermographic inspection parameters have greatly influenced the accuracy of measurement of the damage present in the specimens. The most important parameter in inspecting metallic materials by IRT is the image acquisition rate. Since the heat transfer phenomenon is very quick in this type of material a high acquisition rate is necessary for effective detection. In the inspections conducted in this study no detection was produced with acquisiton rates below 50 Hz while the results with 100 Hz were the optimal conditions producing both accurate detection and a relatively low file-size.
The correct choice of the applied thermal stimulation methodology was also a very important parameter in order to correctly measure the real extent of the damages produced during the tests. The heating methodologies used in these tests were optical and convective types. The non-contact, simplicity and rapidity of these methodologies ledto them being selected amongst the wide range of stimulation techniques available for IRT NDT inspections.
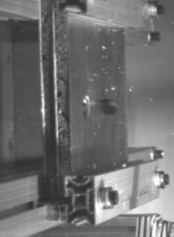
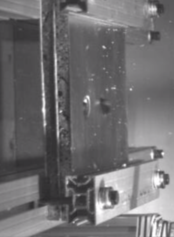
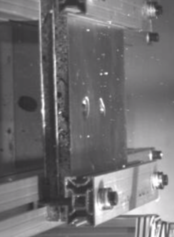
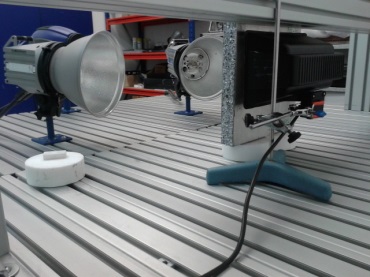
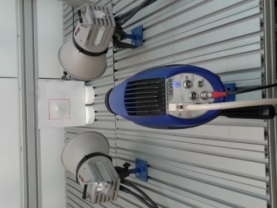
Different stimulation strategies were used with each technology. The thermal stimulation was applied in both reflection and transmission modes. The camera and stimulation source were placed on the same side of the specimen for reflection mode, and placed on opposite sides for transmission mode (Figure 6). The energy applied by the flash lamps was set to 12 KJ and the convective stimulation consisted in 5 seconds of direct air flow at 100°C.
Finally, processing the data collected by the thermographic camera by tsr methodology [3], it was possible to identify the surface affected by the impact damage.
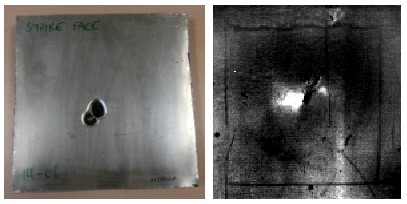
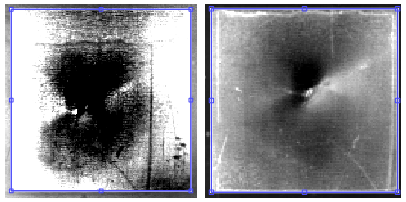
Figure 7 shows the imagery from the thermography analysis of one of the tested panels (Panel 8 – 30mm 16% density foam). The second image from the left shows a clear area in the middle which corresponds to the main damage in the sample produced by the impact. This area is identified by direct visualization. The third and fourth images from the left show (in darker colors) those damaged zones where the impact has affected the thermal properties of the material to a lesser extent, in other words, where the structure has been internally affected but has not been identified by direct visualization.
4.3 X-ray Tomography
The purpose of the X-ray tomography inspections was to determine the level of penetration of the projectiles and the damage caused both internally as well as in the back plate following an impact test. The impact zone has been inspected by making virtual cuts every millimeter. Combining the reconstruction software with the image analysis techniques, the maximum deformation dimensions, the total deformed volume of the front panel, the foam core and the back plate as well as the penetration of the projectiles have been determined.
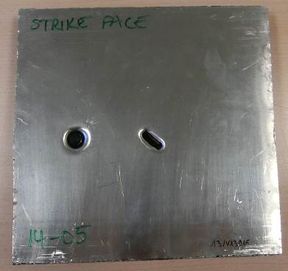
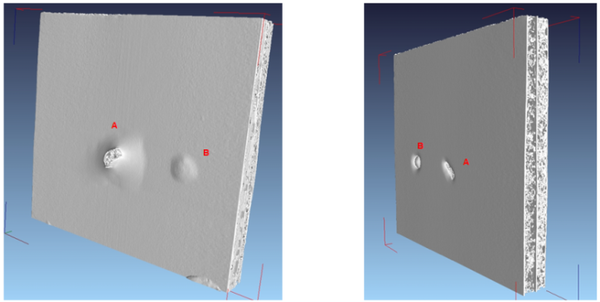
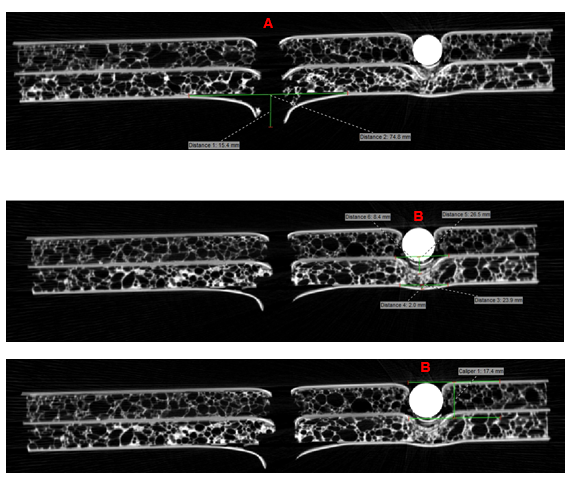
Panel 9 (16% density foam double core) clearly showed the influence of projectile types on impact performance. The ball is embebbed while the disc has perforated the panel (Figures 8 and 9).
In the X-ray tomogrpahy analysis of Panel 9 (Figure 10) the disc projectile caused a maximum displacement of the rear face of 15.4 mm and a damage area of 43.9 cm2. The projectile fully perforated the panel. The ball projectile caused a maximum displacement of the inner plate of 8.4 mm and of the rear face of 2 mm. Damage areas were 5.51 cm2 and 4.48 cm2 for inner and rear plates respectively. Maximum ball projectile penetration depth was 17.4 mm. The X-ray tomography showed perforation of the inner plate underneath the ball projectile with foam compaction between inner and rear plates. The elastic recovery of the deformed impact face led to a plugging effect which prevented the ball projectile from rebounding. Whilst the disc had the same kinetic energy as the ball projectile, the difference in its profile led to the full perforation of the panel.
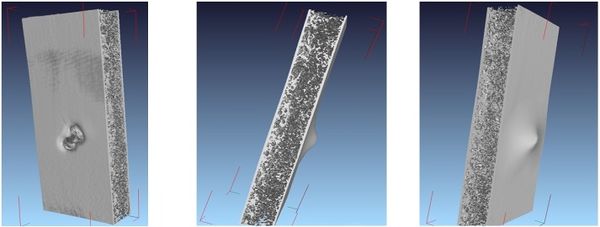
Figure 11 shows a similar analysis of Panel 8 (30mm 16% density foam core). In this panel the ball and disc impacts overlapped significantly and it was difficult to define the area/volume of the panel damaged by each of the projectiles. However through X-ray tomography analysis it was possible to attribute key characteristics to each of the two projectiles.
Figure 12 shows a series of tomography slices through Panel 8. The rear plate underwent a maximum displacement of 10.5mm in the direction of impact and with a damage area of 55.0 cm2. The total deformed volume in rear face was measured as 10.2 cm3. The ball projectile was determined to have penetrated the panel by 21.9 mm and the disc projectile 26.7 mm. This further indicates the relative penetrative capabilities of projectile with identical masses but with different geometries.
The X-ray tomography analysis of this panel confirmed the data previously generated on the same panel using IR thermography. The damage area calculated by both techniques were similar with the thermography method slightly better suited to determine the extent of damaged area and the topogrpahy technique better suited to assess the internal impact damage.
5 Conclusions
The aim of this work has been the investigation of lighter weight metallic composite systems with suitable properties aimed at withstanding high-velocity projectiles and high energy impacts. Metal composite test panels were manufactured and tested using both aluminum and aluminum foam core layers. These have been tested under simulated secondary fragment projectile impact conditions, using two projectile geometries, a ball and a disc, to evaluate their efficiency in the case of a high energy impact. The ability of the panels to withstand perforation as well as their capacity to “capture” fragments has been assessed. Test panels were inspected using NDT methods (Infrared Thermography and X-ray Tomography). The results obtained from these inspections enabled the evaluation of the deformations experienced by several selected panels as well as the extent of the surface damages that the materials had suffered. Using the X-ray tomography method it has been possible to compare and evaluate the capacity of different panel designs to withstand these impacts.
A series of different aluminum panels based around two foam core densities (200 and 430 kg/m3; 7 % and 16 % respectively) has been tested. The lighter panels with 0.8 mm Al 1050 sheets with the lighter weight cores were not capable of withstanding the projectile energies used in this study for the ball projectile, even with double core. It was necessary to use the higher density core with 30 mm thickness or double core to prevent perforation. Thus, this Al 1050 series of panels show a clear trend of increased ballistic limit with increased panel weight. However through the use of alternative aluminium alloy selection, it was possible to increase the ballistic limit of the panels whilst maintaining lower panel weights.
As expected disc type projectile cause higher damage, increasing absorbed energy and even perforated the panel whilst the ball projectile did not in the case of the double core panel of 16 % foam.
Use of a double foam core design enhanced the ballistic limit of panels based on the lower density foam material. However when the same design was applied to the higher density foam, the double core panel was perforated by the disc projectile with a ballistic limit less than that of the equivalent single foam core. From X-ray tomography analysis it appears that the double core panel created a more rigid structure that was unable to deform under impact as much as the single core panel and which ultimately led to its perforation by the disc projectile.
Increased performance with lighter panels was achieved through the selection of different aluminum alloys for the impact face, inner and rear plates of the panels.
Acknowledgements
The authors would like to acknowledge the Basque Government funding within the ELKARTEK Programme (KK-2016/00097).
Referencias
[1] J.A. Zukas, W.P. Walters, Explosive Effects and Applications, Springer-Verlag, New York (1998).
https://doi.org/10.1007/978-1-4612-0589-0
[2] D.O. Dusenberry, Handbook for Blast Resistant Design of Buildings, Chapter 8 Fragmentation, King, K., John Wiley & Sons (2010) http://dx.doi.org/10.1061/(ASCE)CF.1943-5509.0000166
[3] Balageas, D., Chapuis, B., Deban, G., & Passilly, F. Improvement of the detection of defects by pulse thermography thanks to the TSR approach in the case of a smart composite repair patch. Quantitative InfraRed Thermography Journal, 7(2), 167-187 (2010).
Document information
Published on 20/01/19
Accepted on 20/01/19
Submitted on 20/01/19
Volume 03 - Comunicaciones Matcomp17 (2019), Issue Núm. 1 - Materiales (2), 2019
DOI: 10.23967/r.matcomp.2019.01.023
Licence: Other
Share this document
Keywords
claim authorship
Are you one of the authors of this document?
