Abstract
Due to the climate change debate, a lot of research and maps of external climate parameters are available. However, maps of indoor climate performance parameters are still lacking. This paper presents a methodology for obtaining maps of performances of similar buildings that are virtually spread over whole Europe. The produced maps are useful for analyzing regional climate influence on building performance indicators such as energy use and indoor climate. This is shown using the Bestest building as a reference benchmark. An important application of the mapping tool is the visualization of potential building measures over the EU. Also the performances of single building components can be simulated and mapped. It is concluded that the presented method is efficient as it takes less than 15 min to simulate and produce the maps on a 2.6 GHz/4 GB computer. Moreover, the approach is applicable for any type of building.
Keywords
Mapping ; Modeling ; Building ; Performance
1. Introduction
Buildings and their systems can be considered as complex dynamic systems. The control and operation of building systems are of eminent importance regarding durability, health and costs. Energy use can be drastically reduced if building systems are properly controlled and optimal operated. At the same time comfort can be improved and costs can significantly be lowered. The goal of Computational Building Physics is to search for physics based models behind the empirical facts in order to control the built environment. Furthermore Computational Building Physics studies the built environment on several scales (see Figure 1 ). Building physics research applications are so far almost always limited to the scale levels of material, building and urban area. In this paper we present a building physics research application of the scale level of the EU.
|
|
|
Figure 1. Scale levels involved within building physics research. |
1.1. Related work
In this Section we will focus on two important building related research areas where EU mappings are already common techniques. First, we start with cultural heritage and climate change. Grossi et al. (2007) are using maps to visualize the prediction of the evolution in frost patterns due to climate change during the 21st century and the potential damage to historic structures and archeological remains in Europe. Figure 2 shows an exemplarily result of the application of a freezing event map.
|
|
|
Figure 2. Pan-European maps of average yearly freezing events in 30 years period 1961–1990 (top) and far future 2070–2099 (bottom) by Grossi et al. (2007) . |
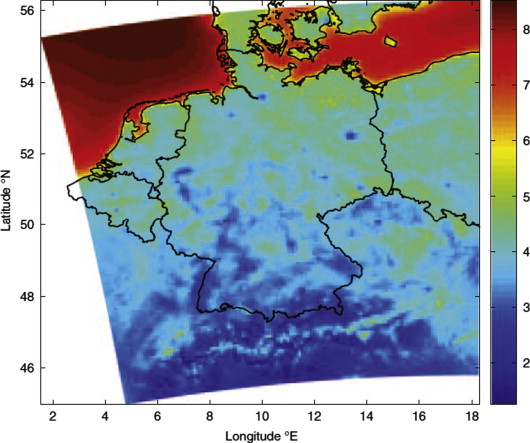
Similar maps as presented in Figure 2 are used to show the expected reduction of freezing and lowering the potential for frost shattering of porous building stone. The underlying data for these maps are based on regional climate models. This is the second research area where EU maps are commonly used. There is an enormous amount of literature on climate change and mapping. Therefore we illustrate the use of these maps by one state of the art regional climate model: REMO (Jacob and Podzun, 1997 ; Larsen et al ., 2010 ). Figure 3 shows the twenty-five-year mean modeled wind at 10 m height over Central Europe using REMO with a 10 km resolution. Maps like Figure 3 are suited for wind energy assessment application in Northern Europe. Moreover, literature of the related work shows that a lot of EU maps of external climate parameters are available.
|
|
|
Figure 3. Twenty-five-year mean modeled wind at 10 m height over the entire domain REMO 10 km resolution (Larsen et al., 2010 ). |
1.2. Goal and outline
The maps presented in the previous section are all based on external climate parameters. However, the goal of this work is to produce maps that include also indoor climate performance parameters.
The outline of the paper is as follows. Section 2 presents the methodology of the application for obtaining maps of performances of similar buildings that are virtual spread over whole Europe. The produced maps are useful for analyzing regional climate influence on building performance indicators such as energy use and indoor climate. Section 3 shows a benchmark of the EU mapping of the Bestest building. Section 4 comprehends a case study on the simulation and mapping of the effect of improved glazing using the Bestest building as a reference.
2. Methodology
The methodology used for obtaining the required simulation results and maps can be divided into three steps. These are presented in the following sections.
2.1. External climate files
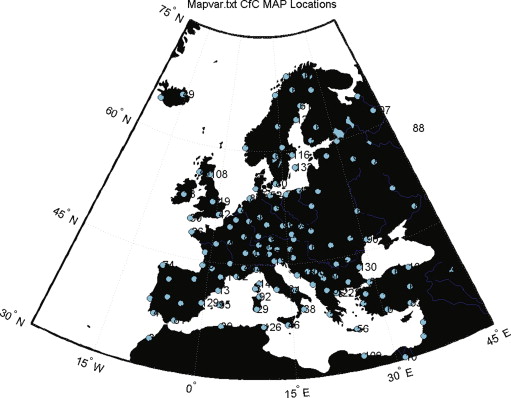
Over 130 external hourly-based climate files were produced using commercially available software (Meteonorm, 2011 ) using so-called wac format. Figure 4 presents the distribution of the locations over Europe. Each climate file includes hourly based values for the common used external climate parameters: Horizontal global solar radiation [W/m2 ] (ISGH), Diffuse solar radiation [W/m2 ] (ISD), Cloud cover [0–1] (CI), Air temperature [°C] (TA), Relative humidity [%] (HREL), Wind speed [m/s] (WS), Wind direction [0–360°] (WD), Rain intensity [mm/h] (RN), Long wave radiation [W/m2 ] (ILAH).
|
|
|
Figure 4. The distributions of the locations of the external climates in Europe. |
2.2. Whole building simulation model
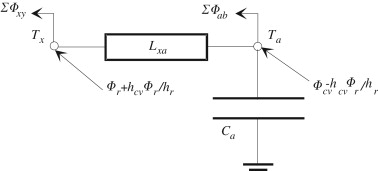
The whole building model originates from the thermal indoor climate model ELAN which was already published in 1987 (de Wit and Driessen, 1988 ). Separately a model for simulating the indoor air humidity (AHUM) was developed. In 1992 the two models were combined and programmed in the MatLab environment. Since that time, the model has constantly been improved using newest techniques provided by recent MatLab versions. The current hourly-based model HAMBase, is part of the Heat, Air and Moisture Laboratory (HAMLab 2011), and is capable of simulating the indoor temperature, the indoor air humidity and energy use for heating and cooling of a multi-zone building. The physics of this model is extensively described by de Wit (2006) . The main modeling considerations are summarized below. The HAMBase model uses an integrated sphere approach. It reduces the radiant temperatures to only one node. This has the advantage that complicated geometries can easily be modeled. Figure 5 shows the thermal network where Ta is the air temperature and Tx is a combination of air and radiant temperature. Tx is needed to calculate transmission heat losses with a combined surface coefficient. hr and hcv are the surface weighted mean surface heat transfer coefficients for convection and radiation. Φr and Φcv are respectively the radiant and convective part of the total heat input consisting of heating or cooling, casual gains and solar gains. For each heat source a convection factor can be given between 0 and 1 by the user. For example, for air heating this factor is close to 1 and for radiative heat sources a factor ranging from 0.4–0.6 can be used. The factor for solar radiation depends on the window system and the amount of radiation falling on furniture. Ca is the heat capacity of the air. Lxa is a coupling coefficient (de Wit et al. 1988):
|
|
( 1) |
|
|
|
Figure 5. The room radiative model as a thermal network. |
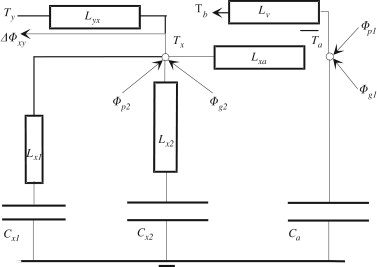
∑Φab is the heat loss by air entering the zone with an air temperature Tb . At is the total area. In case of ventilation Tb is the outdoor air temperature. ∑Φxy is transmission heat loss through the envelope part y . For external envelope parts Ty is the sol-air temperature for the particular construction including the effect of atmospheric radiation. The admittance for a particular frequency can be represented by a network of a thermal resistance (1/Lx ) and capacitance (Cx ) because the phase shift of Yx can never be larger than π/2. To cover the relevant set of frequencies (period 1–24 h) two parallel branches of such a network are used giving the correct admittances for cyclic variations with a period of 24 h and of 1 h. This means that the heat flow Φxx (tot) is modeled with a second order differential equation. For air from outside the room with temperature Tb a loss coefficient Lv is introduced. This model is summarized in Figure 6 . In a similar way a model for the air humidity is made. Only vapour transport is modeled, the hygroscopic curve is linearized between RH 20% and 80%. The vapour permeability is assumed to be constant. The main differences are: (a) there is only one room node (the vapour pressure) and (b) the moisture storage in walls and furniture, carpets etc. is dependent on the relative humidity and temperature. The HAMbase model is adapted in such a way that all climate (.wac) files in a directory are automatically processed. For each climate file a corresponding output file is produced containing hourly based values for the indoor climate and heating and cooling power.
|
|
|
Figure 6. The thermal ventilation model for one zone. |
A separate Matlab mfile is developed for calculating annual means and peak values for each location (i.e., wac file) and together with the longitude and latitude stored in a single file suitable for mapping purposes.
2.3. Mapping of the results
A MatLab mfile was developed for the visualization of the just mentioned mapping file. For the exact details of this mfile, we refer to the HAMLab website (HAMLab, 2012 ).
3. Benchmark: EU mapping of the Bestest building
3.1. Bestest using HAMBase
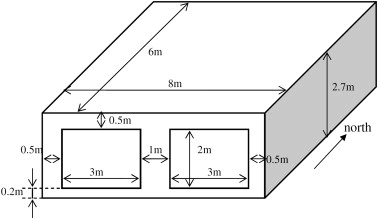
The Bestest (ASHRAE, (2001) ) is a structured approach to evaluate the performance of building performance simulation tools. The evaluation is performed by comparing results of the tested tool relative to results by reference tools. The procedure requires simulating a number of predefined and hierarchal ordered cases. Firstly, a set of qualification cases have to be modeled and simulated. If the tool passes all qualification cases the tool is considered to perform Bestest compliant. In case of compliance failure the procedure suggests considering diagnostic cases to isolate its cause. Diagnostic cases are directly associated with the qualification cases (Judkoff and Neymark, 1995 ). The first qualification case, case 600 (see Figure 7 ) was used for the performance comparison. The thermal part of HAMBase has been subjected to a standard method of test (Bestest ASHRAE, (2001) ), with satisfactory results. The accompanying climate file of the Bestest is based on weather station near Denver (USA). For further details, see Table 1 .
|
|
|
Figure 7. Bestest case 600 geometry. |
| Case | Nr. Simulation of | Model | Test | |
|---|---|---|---|---|
| Min | Max | |||
| 600ff | Mean indoor temperature [°C] | 25.1 | 24.2 | 25.9 |
| 600ff | Min. indoor temperature [°C] | −17.9 | −18.8 | −15.6 |
| 600ff | Max. indoor temperature [°C] | 64.0 | 64.9 | 69.5 |
| 900ff | Mean indoor temperature [°C] | 25.1 | 24.5 | 25.9 |
| 900ff | Min. indoor temperature [°C] | −5.1 | −6.4 | −1.6 |
| 900ff | Max. indoor temperature [°C] | 43.5 | 41.8 | 44.8 |
| 600 | Annual sensible heating [MWh] | 4.9 | 4.3 | 5.7 |
| 600 | Annual sensible cooling [MWh] | 6.5 | 6.1 | 8.0 |
| 600 | Peak heating [kW] | 4.0 | 3.4 | 4.4 |
| 600 | Peak sensible cooling [kW] | 5.9 | 6.0 | 6.6 |
| 900 | Annual sensible heating [MWh] | 1.7 | 1.2 | 2.0 |
| 900 | Annual sensible cooling [MWh] | 2.6 | 2.1 | 3.4 |
| 900 | Peak heating [kW] | 3.5 | 2.9 | 3.9 |
3.2. EU mapping
Now we apply the method of Section 2 in order to produce EU maps of certain (performance) parameters.
3.2.1. External climate
We start with the outdoor climate. For these maps simulation is not required because the information is already present in the climate (.wac) files. Figure 8 shows the expected north–south temperature distribution. The influence of higher altitude weather stations near the Alps is also visible. The relative humidity distribution is shown in Figure 9 . Quite remarkably there is a peak in relative humidity at the east part of the Alps corresponding with the low temperature (see Figure 8 ) which is not present at the west side of the Alps.
|
|
|
Figure 8. Mean annual external air temperature [°C]. |
|
|
|
Figure 9. Mean annual external relative humidity [%]. |
3.2.2. Indoor climate
The simulation of all 130 weather stations of the Bestest case 600 building takes less than 15 min using HAMBase on a 2.6 GHz/4 GB computer. Figure 10 shows the mean annual indoor air temperature distribution. As expected the mean annual indoor temperature is within the 20–27 °C range (the upper left part of the map near Greenland is not accurate due to the absence of weather stations). Although it is not within the Bestest, it could be interesting to simulate the mean annual indoor relative humidity (in case that there are no internal moisture gains). This is presented in Figure 11 . As expected at the cold regions (see Figure 8 ) the indoor relative humidity is low. Because the Bestest case 600 building has 12 m2 of window area facing south it is interesting to visualize the mean annual solar gain [W ] entering the room. This is shown in Figure 12 . Figure 12 is in line with what we expect.
|
|
|
Figure 10. Mean annual indoor air temperature [°C] of the Bestest case 600 building. |
|
|
|
Figure 11. Mean annual indoor relative humidity [%] of the Bestest case 600 building. |
|
|
|
Figure 12. Mean annual solar gain [W] of the Bestest case 600 building. |
3.2.3. Heating and cooling
The energy use for heating and cooling the Bestest case 600 building is shown in Figure 13 , Figure 14 , Figure 15 ; Figure 16 . The mean annual heating and cooling power maps are quite as expected. Also the peak heating power (Figure 15 ) has an intuitive map. Remarkably, the peak cooling power map (Figure 16 ) shows a quite uniform distribution ranging from 5.5–7 kW.
|
|
|
Figure 13. Mean annual heating power [W] of the Bestest case 600 building. |
|
|
|
Figure 14. Mean annual cooling power [W] of the Bestest case 600 building. |
|
|
|
Figure 15. Peak heating power [W] the of Bestest case 600 building. |
|
|
|
Figure 16. Peak cooling power [W] of the Bestest case 600 building. |
4. EU mapping of single building components effects
In the previous section the main performances of a reference building model subjected to EU weather stations data, were visualized using EU maps. This leads to a new interesting application. If we change a single building component we can visualize the single effect of this change by subtracting these (new) results with the reference case. In order to demonstrate this idea we study the effect of replacing the original glazing (U value=3 W/m2 K; Solar gain factor=0.787) of the case 600 building with improved glazing (U value=1.5 W/m2 K; Solar gain factor=0.40) called variant . The method to obtain the results below was as follows: (1) The building was simulated and mapped again using the new glazing parameters. (2) A net change effect map was obtained by subtracting two maps, i.e., reference −variant map. (3) A percentage change effect map was obtained by using the formula: (1−variant/reference )×100% map.
4.1. Indoor climate change
The results show only minor changes in the mean indoor climates of respectively 1 °C and 1%. Because the solar gain factor is reduced from 0.787 to 0.40 we expect substantial differences between the reference and the variant. Figure 17 shows the result:
|
|
|
Figure 17. Reduction of mean annual solar gain [W] of the Bestest case 600 building due to the improved glazing. |
4.2. Heating and cooling
4.2.1. Mean annual heating reduction
Figure 18 , Figure 19 ; Figure 20 show the three types of maps for the mean annual heating. Figure 18 provides the mean annual heating of the building with improved glazing. Using the map of mean annual heating power of the reference building (i.e., Figure 13 ), a net change effect map was obtained by subtracting two maps, i.e., reference map minus variant map. This is shown in Figure 19 . The highest reduction in heating amount can be observed in the Nordic countries (up to 250 Wy×8.76 kh/y=2190 kW h). The lowest reduction can be found in the Mediterranean as expected. The reduction can also be expressed as a percentage change effect map, using the formula: (1−variant/reference)×100%. This is presented in Figure 20 . Please note that although the Mediterranean has a relatively high percent change, the absolute values for the mean annual heating power are low, so almost no heating energy savings are expected in this region. Secondly in areas where improved glazing do have impact, the relative improvement is quite uniform between 10 and 20%.
|
|
|
Figure 18. Mean annual heating power [W] of the Bestest case 600 building with improved glazing. |
|
|
|
Figure 19. Change in mean annual heating power [W] of the Bestest case 600 building with improved glazing. |
|
|
|
Figure 20. Percent change in mean annual heating power [%] of the Bestest case 600 building with improved glazing. |
4.2.2. Mean annual cooling reduction
Figure 21 provides the mean annual cooling reduction. The highest reduction in cooling amount can be observed in the Mediterranean (up to −500 Wy×8.76 kh/y=4400 kW h). The reduction can also be expressed as a percentage change effect map. This is presented in Figure 22 . Although the percent change at the Alps is relatively high, the absolute values for the mean annual cooling power are low, so almost no cooling energy savings are expected in this region.
|
|
|
Figure 21. Change in mean cooling power [W] of the Bestest case 600 building with improved glazing. |
|
|
|
Figure 22. Percent change in mean annual cooling power [%] of the Bestest case 600 building with improved glazing. |
4.2.3. Peak heating reduction
Figure 23 shows the relative the peak heating power reduction. Remarkably, Figure 23 shows a quite uniform relative change in peak heating power reduction.
|
|
|
Figure 23. Reduction of the peak heating power [%] of the Bestest case 600 building. |
4.2.4. Peak cooling reduction
Figure 24 shows the absolute peak cooling power reduction. Figure 24 shows a uniform relative change in cooling power reduction (3–4 kW).
|
|
|
Figure 24. Reduction of the peak cooling power [W] of the Bestest case 600 building. |
5. Conclusions
The produced maps are useful for analyzing regional climate influence on building performance indicators such as energy use and indoor climate. This is shown using the Bestest building as a reference benchmark. An important application of the mapping tool is the visualization of potential building measures over the EU. Also the performances of single building components can be simulated and mapped. It is concluded that the presented method efficient as it takes less than 15 min to simulate and produce the maps on a 2.6 GHz/4 GB computer. Moreover, the approach is applicable for any type of building.
5.1. Future research
Within the mentioned EU FP7 project "Climate for Culture", detailed EU external climate files are currently under development for the period 1960–2100 using the REMO model (Jacob and Podzun, 1997 ) and a moderate climate scenario. With these future external climate files we will be able to predict future building performance indicators. Together with the EU mapping tool this could be helpful to locate EU regions with the highest impact on the specific building performances.
Acknowledgement
This work was inspired and sponsored by the EU FP7 project "Climate for Culture" .
References
- ASHRAE, 2001 ASHRAE, 2001. Standard Method of Test for the Evaluation of Building Energy Analysis Computer Programs, Standard 140-2001.
- Grossi et al., 2007 C.M. Grossi, P. Brimblecombe, I. Harris; Predicting long term freeze-thaw risks on Europe built heritage and archaeological sites in a changing climate; Science of the Total Environment, 377 (2007), pp. 273–281
- HAMLab, 2012 HAMLab, 2012. http://archbps1.campus.tue.nl/bpswiki/index.php/Hamlab .
- Jacob and Podzun, 1997 D. Jacob, R. Podzun; Sensitivity studies with the regional climate model REMO; Meteorology and Atmospheric Physics, 63 (1997), pp. 119–129
- Judkoff and Neymark, 1995 R. Judkoff, J. Neymark; International Energy Agency Building Energy Simulation Test (Bestest) and Diagnostic Method; National Renewable Energy Laboratory, Golden, CO (1995)
- Larsen et al., 2010 X.G. Larsen, J. Mann, J. Berg, H. Gottel, D. Jacob; Wind climate from the regional climate model REMO; Wind Energy, 13 (2010), p. 279 206
- Meteonorm, 2011 Meteonorm, 2011. <http://meteonorm.com/>
- de Wit and Driessen, 1988 M.H. de Wit, H.H. Driessen; ELAN a computer model for building energy design; Building and Environment, 23 (1988), pp. 285–289
- de Wit, 2006 de Wit, M.H., 2006. HAMBase, Heat, Air and Moisture Model for Building and Systems Evaluation. Bouwstenen 100. Eindhoven University of Technology.
Document information
Published on 12/05/17
Submitted on 12/05/17
Licence: Other
Share this document
Keywords
claim authorship
Are you one of the authors of this document?


![Mean annual external air temperature [°C].](/wd/images/1/15/Draft_Content_459577392-1-s2.0-S2095263513000186-gr8.jpg)
![Mean annual external relative humidity [%].](/wd/images/2/29/Draft_Content_459577392-1-s2.0-S2095263513000186-gr9.jpg)
![Mean annual indoor air temperature [°C] of the Bestest case 600 building.](/wd/images/2/20/Draft_Content_459577392-1-s2.0-S2095263513000186-gr10.jpg)
![Mean annual indoor relative humidity [%] of the Bestest case 600 building.](/wd/images/7/75/Draft_Content_459577392-1-s2.0-S2095263513000186-gr11.jpg)
![Mean annual solar gain [W] of the Bestest case 600 building.](/wd/images/1/19/Draft_Content_459577392-1-s2.0-S2095263513000186-gr12.jpg)
![Mean annual heating power [W] of the Bestest case 600 building.](/wd/images/4/49/Draft_Content_459577392-1-s2.0-S2095263513000186-gr13.jpg)
![Mean annual cooling power [W] of the Bestest case 600 building.](/wd/images/0/06/Draft_Content_459577392-1-s2.0-S2095263513000186-gr14.jpg)
![Peak heating power [W] the of Bestest case 600 building.](/wd/images/c/ca/Draft_Content_459577392-1-s2.0-S2095263513000186-gr15.jpg)
![Peak cooling power [W] of the Bestest case 600 building.](/wd/images/c/c5/Draft_Content_459577392-1-s2.0-S2095263513000186-gr16.jpg)
![Reduction of mean annual solar gain [W] of the Bestest case 600 building due to ...](/wd/images/1/1f/Draft_Content_459577392-1-s2.0-S2095263513000186-gr17.jpg)
![Mean annual heating power [W] of the Bestest case 600 building with improved ...](/wd/images/4/49/Draft_Content_459577392-1-s2.0-S2095263513000186-gr18.jpg)
![Change in mean annual heating power [W] of the Bestest case 600 building with ...](/wd/images/d/da/Draft_Content_459577392-1-s2.0-S2095263513000186-gr19.jpg)
![Percent change in mean annual heating power [%] of the Bestest case 600 building ...](/wd/images/1/15/Draft_Content_459577392-1-s2.0-S2095263513000186-gr20.jpg)
![Change in mean cooling power [W] of the Bestest case 600 building with improved ...](/wd/images/6/6e/Draft_Content_459577392-1-s2.0-S2095263513000186-gr21.jpg)
![Percent change in mean annual cooling power [%] of the Bestest case 600 building ...](/wd/images/6/68/Draft_Content_459577392-1-s2.0-S2095263513000186-gr22.jpg)
![Reduction of the peak heating power [%] of the Bestest case 600 building.](/wd/images/6/63/Draft_Content_459577392-1-s2.0-S2095263513000186-gr23.jpg)
![Reduction of the peak cooling power [W] of the Bestest case 600 building.](/wd/images/e/ed/Draft_Content_459577392-1-s2.0-S2095263513000186-gr24.jpg)