En memoria del meu amic Pablo
Acknowledgements
In the very last lesson of Estructuras III of my undergraduate degree in Civil Engineering, Professor Oñate presented several animations of simulations carried out in CIMNE. As a student, to see that all those bunch of equations of finite elements could be applied in real engineering problems greatly amazed me. Surprisingly, when I expressed to Oñate my interest in the field, he offered me a position to start implementing the Discrete Element Method in the new plataform Kratos. I combined it with the development of my final degree monograph and I moved on undertaking the Master in Numerical Methods in Engineering. Afterwards, I got a scholarship from the programme Doctorats Industrials de la Generalitat de Catalunya which allowed me to develop my Ph.D. thesis in a partnership of the research centre CIMNE and the company CITECHSA.
This work encompasses the result of the 4 years in CIMNE working in the field of Discrete Element Methods under the guidance of Prof. Eugenio Oñate.
First of all, I must thank my advisor Prof. Oñate for his support all over these years. His advice has been not only on the topic of research but also on the development of my career. He gave me great freedom in the decision of the research line and helped me having a rich international experience through my research stay abroad as well as the participation in several conferences. I have learned a lot from Prof. Oñate in many aspects and I consider myself fortunate to have had the opportunity to work with him.
I would like to mention Miguel Ángel Celigueta who has helped me a lot, specially during my first steps in CIMNE by allowing me take part in several ongoing project meetings. From him I learned most of what I know about coding in an efficient and organized manner. Later, J. Maria Carbonell became my second supervisor of the monograph helping me in the developments regarding the coupling with the solid mechanics code as well as in the elaboration of this document. For that and for his support along my monograph I would like to express my gratitude to him.
I would also like to thank Prof. Wriggers for finding me a seat in the Institute of Continuum Mechanics in Hanover where I learnt about contact mechanics and developed part of the monograph under his advisory. My stay in Germany has been very fruitful for my monograph but also for learning German. That is specially Tobias Steiner to thank, my Bürokollege and now my good friend. Danke!
From the CITECHSA side I want to acknowledge Natalia Alonso and María Angeles Viciana and thank the rest of the team as well.
Thanks to the DEM Team members: Salva, Ferran and Guillermo for the work done together and the intense discussions on the DEM. Thanks to Joaquín Irázabal who has become my closer collaborator; with him I share an article, a lot of developments and of course good moments in congresses during these years. I don't want to miss mentioning Jordi and Pablo who are exemplar engineers to me and Charlie who solved memory errors in my code uncountable times. Also Ignasi, Roberto, Kike, Pooyan, Riccardo, Antonia, Miguel, Abel, Anna, Adria, Javier Mora, Sonia S., Feng Chun, María Jesús and the rest of the CIMNE family. A little part of them is somehow in this monograph. Thank you!
Last but not least to my friends from Navas and specially to my family. Gracies Montse, Marina, Mery, Josep and Celia. 谢谢 Xiaojing for your necessary support and company during the last steps. This work was carried out with financial support from the programme Doctorats Industrials de la Generalitat de Catalunya, Weatherford Ltd. and the BALAMED project (BIA2012-39172) of MINECO, Spain.
Abstract
This works encompasses a broad review of the basic aspects of the Discrete Element Method for its application to general granular material handling problems with special emphasis on the topics of particle-structure interaction and the modelling of cohesive materials. On the one hand, a special contact detection algorithm has been developed for the case of spherical particles representing the granular media in contact with the finite elements that discretize the surface of rigid structures. The method, named Double Hierarchy Method, improves the existing state of the art in the field by solving the problems that non-smooth contact regions and multi contact situations present. This topic is later extended to the contact with deformable structures by means of a coupled DE-FE method. To do so, a special procedure is described aiming to consistently transfer the contact forces, which are first calculated on the particles, to the nodes of the FE representing the solids or structures. On the other hand, a model developed by Oñate et al. for the modelling of cohesive materials with the DEM is numerically analysed to draw some conclusions about its capabilities and limitations.
In parallel to the theoretical developments, one of the objectives of the monograph is to provide the industrial partner of the doctoral programme, CITECHSA, a computer software called DEMPack (www.cimne.com/dem/) that can apply the coupled DE-FE procedure to real engineering projects. One of the remarkable applications of the developments in the framework of the monograph has been a project with the company Weatherford Ltd. involving the simulation of concrete-like material testing.
The monograph is framed within the first graduation (2012-13) of the Industrial Doctorate programme of the Generalitat de Catalunya. The monograph proposal comes out from the agreement between the company CITECHSA and the research centre CIMNE from the Polytechnical University of Catalonia (UPC).
Resum
Aquest treball compen una amplia revisió dels aspectes basics del Metode dels Elements Discrets (DEM) per a la seva aplicació generica en problemes que involucren la manipulació i transport de material granular posant emfasi en els temes de la interacció partícula-estructura i la simulació de materials cohesius. Per una banda, s'ha desenvolupat un algoritme especialitzat en la detecció de contactes entre partícules esferiques que representen el medi granular i els elements finits que conformen una malla de superfície en el modelatge d'estructures rígides. El metode, anomenat Double Hierarchy Method, suposa una millora en l'estat de l'art existent en solucionar els problemes que deriven del contacte en regions de transició no suau i en casos amb múltiples contactes. Aquest tema és posteriorment estes al contacte amb estructures deformables per mitja de l'acoblament entre el DEM i el Metode dels Elements Finits (FEM) el qual governa la solució de mecanica de solids en l'estructura. Per a fer-ho, es descriu un procediment pel qual les forces de contacte, que es calculen en les partícules, es transfereixen de forma consistent als nodes que formen part de l'estructura o solid en qüestió. Per altra banda, un model desenvolupat per Oñate et al. per a modelar materials cohesius mitjancant el DEM és analitzat numericament per tal d'extreure conclusions sobre les seves capacitats i limitacions.
En parallel als desenvolupaments teorics, un dels objectius de la monografia és proveir al partner industrial del programa doctoral, CITECHSA, d'un software anomenat DEMpack (http://www.cimne.com/dem/) que permeti aplicar l'acoblament DEM-FEM en projectes d'enginyeria reals. Una de les aplicacions remarcables dels desenvolupaments en el marc de la monografia ha estat un projecte per l'empresa Weatherford Ltd. que involucra la simulació de tests en provetes de materials cimentosos tipus formigó.
Aquesta monografia doctoral s'emmarca en la primera promoció (2012-13) del programa de Doctorats Industrials de la Generalitat de Catalunya. La proposta de la monografia prové de l'acord entre l'empresa CITECHSA i el centre de recerca CIMNE de la Universitat Politecnica de Catalunya (UPC).
1. Introduction
Truesdell and Noll in the introduction of The Non-Linear Field Theories of Mechanics [1] state:
Whether the continuum approach is justified, in any particular case, is a matter, not for the philosophy or methodology of science, but for the experimental test…
The ones that agree on that statement may also agree that the same applies for the discontinuum approach in which the Discrete Element Method is framed on.
Before the introduction of the Discrete Element Method in the 70's, lot of effort has been placed in developing constitutive models for the macroscopic description of particle flows. However, the continuum based methods fail to predict the special rheology of granular materials which can rapidly change from a solid-like behaviour in zones where the deformation is small and rather homogeneous to a fluid-like behaviour with huge variation and distortion that can be concentrated in narrow areas such as shear bands. Within the DEM this behaviour, which is driven by the collisional and frictional mechanisms of the material, can be simulated at the grain level where each discrete element corresponds to a physical particle. The quality of the results depends then on the accuracy in the representation of the shape of the particles and their interaction.
The DEM is nothing else than Molecular Dynamics with rotational degrees of freedom and contact mechanisms. In its first conception, the method was designed for simulations of dynamic systems of particles where each element is considered to be an independent and non deformable entity which interacts with other particles by the laws of the contact mechanics and moves following the Newton-Euler equations.
The simplicity of the method is in contrast however, with the high computation cost which, in general, has associated to it due to the large number of particles needed in a real simulation and the time scales that have to be resolved. Imagine a hooper discharge problem which may require the computation of millions of particles simulated during tens of minutes when, at the same time, the phenomena that rules the problem lies in reproducing the behaviour of individual particles the interaction of which happens in distances several orders of magnitude smaller than their particle diameter. This implies that the necessary time steps to be used in the simulation have to be smaller than the characteristic contact duration.
In this sense, the implementation of the method using massive parallelization is something of crucial importance. Also the use of simple geometries such as spheres presents a great difference to other more complex geometries such as polyhedra, NURBS, etc. in the detection and characterization of the contacts. That is why still today the use of basic spheres is intensively used.
In many real applications involving granular materials, the interaction with structures and fluids are present. The employment of the FEM to simulate the structures involved in those industrial applications can provide better understanding of the problem and, therefore, could play an important role in the process of design optimization. To that end an efficient coupling of the method with a FEM-based solver for solids is of special interest.
Another field of interest of the application of the DEM is the simulation of material fracturing. The DEM as a discontinuum-based method has attractive features in contrast to continuum-based methods in problems where large deformations and fracture are involved. Many attemps have been done aiming to unify both the modelling of the mechanical behaviour of solid and particulate materials, including the transition from solid phase to particulate phase. Nowadays however, the DEM still presents many drawbacks and lack of reliability in the modelling of solids. Differently from other particle-based methods such as MPM, PFEM or SPH, the DEM shall not be regarded as a discretization method for the solution of PDE.
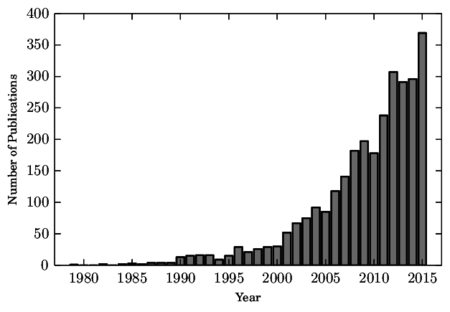
The interest in the Discrete Element Method has exponentially increased since the publication in 1979 of the first article by Cundall and Strack [2] and is still a hot topic nowadays. This can be seen in fig. 1 where the number of publications related to discrete element procedures from 1979 to 2016 are displayed. They were obtained from Google Scholar with the following keywords in the title of the article: 'Discrete Element Method/Model', or 'Distinct Element Method/Model', or 'Using a DEM' or 'A DEM' or 'With the DEM' or 'DEM Simulation'. This does not include all the publications related to DEM and may introduce other non related articles, however it gives a good image of the tendency of research in the field.
There is a great interest in the application of this method to a wide range of industrial problems.
1.1 DE-FE couplings
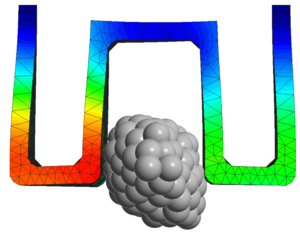
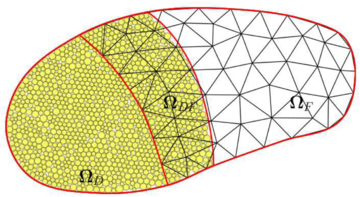
The term coupled DE-FE or combined DE-FE Method for soil and solid mechanics applications appears in the literature with different meanings and can be quite confusing. The most common ones are grouped here in 5 categories along with an example figure (Fig. 2). Other categories for DE-FE couplings are for instance coupling with fluids, thermal problems, etc.
- Particle-structure interaction: The two domains are calculated separately and their communication is through contact models. This is the category in which the monograph is mainly focused on. It is developed in Section 4.
- Two-scale models: These methods solve the problem at two different scales. The micro-macro transition is accomplished employing an overlapping zone to provide a smooth transition between a DE model (micro) and a FE material description (macro). The coupling is achieved by the imposition of kinematic constrains between the two domains. The original idea was presented by Xiao and Belytschko [3] for Molecular Dynamics, Wellmann [4] applied it to granular material while Rojek and Oñate [5] developed it for cohesive materials.
- Projection techniques: Coarse-graining, averaging and other projection techniques are used to derive continuum fields out of discrete quantities. To do so, often a reference mesh is required either for the calculation or simply for the representation of the continuum results [6].
- Embedded DE on FE: This technique consists on embedding (typically spherical) particles in the boundaries of FE models of solids and structures in order to detect and enforce the contact [7]. Recently, this technique has been applied to multi-fracturing in cohesive materials [8]. A FE-based method with failure or crack propagation models is combined with embedded particles that assist the detection and characterization of the contact forces.
- FE discretization of discrete entities: This category involves methods that use a FE discretization to calculate the deformation of the particles and solve their interaction using a DEM-like technique [9]. A particular case is the so called DEM-Block method [10] which consists on a FE-based Method which elements are connected through breakable spring-like bounds imitating the cohesive DE models.
|
|
| (a) Particle-Structure | (b) Two-scale. Taken from: Labra 101 |

|
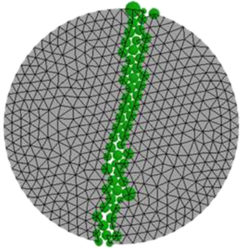
|
| (c) Projection onto a FE mesh | (d) Embedded particles. Taken from: Zárate and Oñate 8 |
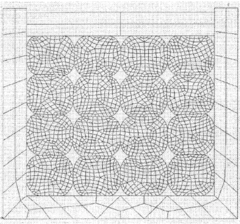
| |
| (e) Discretized DE. Taken from: Gethin et al. 9 | |
| Figure 2: Examples of different techniques that combine FE and DE methods | |
1.2 Objectives
This monograph has been developed in the framework of the first graduation of Doctorats Industrials de la Generalitat de Catalunya (Industrial Doctorates of Catalonia). The objectives defined for this work comprise an agreement between the research line determined by the research centre CIMNE in the Polytechnical University of Catalonia (UPC) and the business objectives of the society CITECHSA which is interested in the exploitation of a DEM-based software in its application to industrial engineering problems. In this regard, the objectives involve research, development of a code and educational and dissemination actions.
On the one hand, the research has to be focused in a deep revision of the state of the art of the Discrete Element Method in order to analyse and select the existing techniques that have to be adapted and implemented for the solution of the problems of interest which are basically three:
- General application of DEM to granular material handling problems
- Particle-structure interaction
- DE models for the simulation of cohesive materials
The research has to be conducted from a general point of view determining the advantages and drawbacks of the existing methods and proposing new developments that can improve the state of the art. The theoretical contributions will be communicated by dissemination actions.
The theoretical research in the above-mentioned topics have to accompanied by its implementation into the open-source code DEMpack (www.cimne.com/dem). The code will be developed with concerns on efficiency and parallelism as it is devised to be employed in real application projects. To that end, several GUIs for specific applications will be developed. This will be done forming part of a larger group of researchers that contribute to the development of the code.
Finally, the developments will be applied in ongoing projects of the research centre.
1.3 Organization of this work
The document is structured as follows:
After the introduction and the objectives, chapter two reviews the basic aspects of the Discrete Element Method that will set the basis upon which the developments in the monograph are established. It includes a revision of the most common contact models and integration methods. An assessment on performance, accuracy and stability is given to help choosing the most appropriate integration scheme. The treatment of clusters of spheres for the representation of non-spherical particles and the contact detection are also discussed in detail.
Chapter three is dedicated to the contact detection between spherical Discrete Elements and triangular or planar quadrilateral Finite Elements. The chapter starts with a complete review of the state of the art and follows with a thorough description of the strategy adopted for the global and local detection of contacts. The idea of using an intermediate fast intersection test is introduced and later proved to be efficient within an application example. Regarding the local resolution, the novel Double Hierarchy Method for contact with rigid boundaries is presented. The description of the methods is equipped with algorithm details, validation examples and limitations analysis.
The fourth chapter introduces the DE-FE coupling for the particle-structure interaction problem. After an introduction to the solid mechanics formulation employed, the coupled scheme is presented. The key point lies in the communication of the contact forces, which are calculated by the DE particles, to the nodes of the FEs. The described procedure proposes the distribution of the forces to all the FEs involved based on their area of intersection with the particles. Several examples show that this strategy improves the commonly used direct interpolation approach for the case of contacts with deformable solids or structures. The good functioning of the coupling is assessed by some tests with special attention placed on energy conservation.
The topic of DE modelling of cohesive materials such as concrete or rock is presented in chapter five. It begins with an overview of the state of the art of the methods available for this purpose together with a study of their limitations and capabilities. After, the model developed by Oñate, Santasusana et al. is described along with application examples where the numerical simulations and the laboratory tests are compared.
Chapter six is dedicated to the implementation of the code in the platform Kratos constituting the DEMpack software together with remarks on the efficiency and parallelitzation of the code.
Finally, the last chapter comprises the conclusions and the outlook of the work.
1.4 Related publications and dissemination
1.4.1 Papers in scientific journals
- E. Oñate, F. Zárate, J. Miquel, M. Santasusana et al. Computational Particle Mechanics - Springer: Local constitutive model for the Discrete Element Method. Application to geomaterials and concrete.
- M. Santasusana, J. Irazábal, E. Oñate, J.M. Carbonell. Computational Particle Mechanics - Springer: The Double Hierarchy Method. A parallel 3D contact method for the interaction of spherical particles with rigid FE boundaries using the DEM.
1.4.2 Communications in congresses
- M. Santasusana, E. Oñate, M.A. Celigueta, F. Arrufat, K. Valiullin, R. Gandikota. 11th. World Congress on Computational Mechanics (WCCM XI): A parallelized discrete element method for analysis of drill-bit mechanics problems in hard and soft soils.
- C.A. Roig, P. Dadvand, M. Santasusana, E. Oñate. 11th. World Congress on Computational Mechanics (WCCM XI): Minimal surface partitioning for particle-based models.
- M. Santasusana, E. Oñate, J.M. Carbonell, J. Irazábal, P. Wriggers. 4th. International Conference on Computational Contact Mechanics (ICCCM 2015): Combined DE/FE method for the simulation of particle-solid contact using a Cluster-DEM approach.
- E. Oñate, F. Arrufat, M. Santasusana, J. Miquel, M.A. Celigueta. 4th. International Conference on Particle-Based Methods (Particles 2015): A local constitutive model for multifracture analysis of concrete and geomaterials with DEM.
- M. Santasusana, E. Oñate, J.M. Carbonell, J. Irazábal, P. Wriggers. 4th. International Conference on Particle-Based Methods (Particles 2015): A Coupled FEM-DEM procedure for nonlinear analysis of structural interaction with particles.
- M. Santasusana, J. Irazábal, E. Oñate, J.M. Carbonell. 7th. European Congress on Computational Methods in Applied Sciences and Engineering (ECCOMAS Congress 2016): Contact Methods for the Interaction of Particles with Rigid and Deformable Structures using a coupled DEM-FEM procedure.
Participation in research projects
- Implementation of the DEM Technology, DEM material models and validation of the DEM Technology. Weatherford International LTD. July 2013 to March 2014.
- Nuevo proceso de voladura mediante técnicas predictives y adaptatives, eficaz y eficiente en la utilización de los recursos y materias primes, minimizando las emisiones. MINECO. January 2014 to June 2016.
2. The Discrete Element Method
The Discrete Element Method (DEM) was firstly introduced by Cundall in 1971 [11] for the analysis of the fracture mechanics problems. Afterwards, in 1979, Cundall and Strack [2] applied it to granular dynamics. The DEM in its original conception simulates the mechanical behaviour of a system formed by a set of particles arbitrarily disposed. The method considers the particles to be discrete elements forming part of a higher more complex system. Each discrete element has an independent movement; the overall behaviour of the system is determined by the application of contact laws in the interaction between the particles.
There exist two main approaches, namely the soft and the hard particle approach. The soft particle approach is a time-driven method where particles are allowed to inter-penetrate simulating small deformations due to contact. The elastic, plastic and frictional forces are calculated out of these deformations. The method allows accounting for multiple simultaneous particle contacts. Once the forces are calculated, the motion of the particles is earned from the application of the classical Newton's law of motion which is usually integrated by means of an explicit scheme. The hard-particle approach, on the other hand, is an event-driven method which treats the contacts as instantaneous and binary (no-multi contact). It uses momentum conservation laws and restitution coefficients (inelastic or frictional contacts) to determine the states of particles after a collision. These assumptions are only valid when the interaction time between particles is small compared to the time of free motion. A good review and comparison of the methods can be found in [12]. This thesis is developed using the soft-particle approach.
The DEM, as a particle method, has been used in a very wide range of applications. An important decision to take is to select which is the relation between a discrete element in the simulation and the physical particles or media in the reality. On the one hand, the one-to-one approach tries to assign a discrete element to every particle in the domain. The method describes all the contact and other interaction forces between particles with a model that only depends on the local relations and does not require fitting. On the other hand, a very common approach is to simulate granular matter or other media using discrete elements that represent a higher amount of material than just one particle. This technique, known as coarse-graining or up-scaling [13], represents a completely phenomenological approach which does require the fitting of parameters out of bulk experiments. Both techniques are used to simulate particulate matter that ranges from powder particles () to the simulation of rock blocks ().
Common applications of the Discrete Element Method are the simulation of granular mater in soil mechanics. A soil can deform as a solid or flow as a fluid depending on its properties and the situation. The use of DEM comes naturally as it can handle both behaviours of the soil and also account for discontinuous and very large deformations [14,15,4]. The DEM adapts also perfectly to the simulation of granular material handling in industrial processes. Some examples of applications are silo flows [16,12], screw-conveyors [17,18], vibrated beds [19,20], ball mill processes [21,22], etc.
Another application which is of special attention in this thesis is the particle-structure interaction problem. This category encompasses, among others, particle-tyre simulations [14,23], shot peening processes [24,25], impacts with flexible barriers [26], soil-structure interaction [4,27], etc. Some examples of applications are presented in section 6.3.
In particle-fluid flow modelling, the difficulty relies on the particulate phase rather than fluid phase. Therefore, a coupled CFD-DEM approach [28] is attractive because of its capability to capture the particle physics. This comprehends a large family of applications which includes gas fluidization, pneumatic conveying flows, particle coating, blast furnace, etc. [16]. Applications in civil and marine engineering are rock avalanches into water reservoirs [29], sediment and bed-load transportation in rivers and sea [30,31,32], etc. A comprehensive literature review on the applications of DEM to the simulation of particulate systems processes can be found in the work published by Zhu et al. [16].
In recent years the DEM has also been object of intense research to the study of multi-fracture and failure of solids involving geomaterials (soils, rocks, concrete), masonry and ceramic materials, among others. Some key developments can be found in [33,34,35,36]. In the cohesive models the contact law can be seen as the formulation of the material model on the microscopic level. Cohesive bonds can be broken, which allows to simulate the fractures in the material and its propagation. The analysis of solid materials within the DEM poses however, a number of difficulties for adequately reproducing the correct constitutive behaviour of the material under linear (elastic) and non-linear conditions (section 5).
2.1 Basic steps for DEM
From a computational point of view a basic DEM algorithm consists of three basic steps:
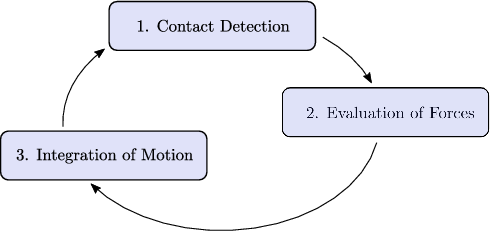
|
| Figure 3: Basic computational scheme for the DEM |
After an initialization step, the time loop starts. First, the neighbouring particles for every discrete element needs to be detected (section 2.2) as well as the contact with rigid boundaries included in the simulation domain (chapter 3). Afterwards, for every contacting pair a the contact model is applied (section 2.5) to determine the forces and torques that have to be added to the rest of actions to be considered on a particle. Finally, given all the forces and the torques, the equations of motion are integrated and the particle's new position is usually calculated by means of an explicit time marching scheme (section 2.6). At this point, new contacts have to be detected and thus, the loop starts again. This sequence repeats over time until the simulation comes to an end.
2.2 Contact detection
Due to the method formulation, the definition of appropriate contact laws is fundamental and a fast contact detection is something of significant importance in DEM. Contact status between individual objects, which can be two DE particles or a DE particle and a boundary element (chapter 3), can be calculated from their relative position at the previous time step and it is used for updating the contact forces at the current step. The relative cost of the contact detection over the total computational cost is generally high in DEM simulations. Therefore, the problem of how to recognize all contacts precisely and efficiently has received considerable attention in the literature [37,38].
Traditionally, the contact detection is split into two stages: Global Neighbour Search and Local Contact Resolution. By the application of this split the computational cost can be reduced from , in an all-to-all check, to .
Global Contact Search
It consists on locating the list of potential contact objects for each given target body. There are two main basic schemes: the Grid/Cell based algorithms and the Tree based ones, each of them with numerous available versions in the literature.
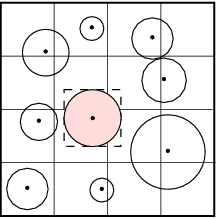
|
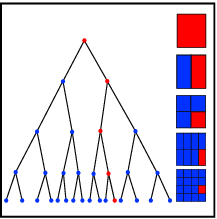
|
| (a) Grid/Cell-based structure | (b) Tree-based structure |
In the Grid based algorithms [39,40,41] a general rectangular grid is defined dividing in cells the entire domain (figure cell). A simple bounding box (rectangular or spheric) is adopted to circumscribe the discrete elements (of any shape) and is used to check in a approximate way which are the cells that have intersection with it. Those intersecting cells, store in their local lists the particles contained in the bounding boxes. The potential neighbours for every target particle are determined by selecting all the elements stored in the different cells where the bounding box of that target particle has been assigned to.
In the Tree based algorithms [42,43,44,45] each element is represented by a point at coordinates . Starting from a centred one, it splits the domain into two sub-domains. Points that have larger coordinate () are placed in one sub-domain while points with smaller coordinates () in the other sub-domain. The method proceeds for next points alternating every time the splitting dimension and obtaining a tree structure like the one shown in figure tree. Once the tree is constructed, for every particle the nearest neighbours is determined following the tree in upwind direction.
Han et al [46] compared the most common Global Neighbour Search algorithms (cell-based and tree-based) in simulations with spherical particles. Numerical tests showed better performance for the cell based algorithms (D-Cell [40] and NBS [39]) over the tree-based ones (ADT [42] and SDT [44]), specially for large-scale problems. It should be noted also that the efficiency depends on the cell dimension and, in general, the size distribution can affect the performance. Han et al [46] suggest a cell size of three times the average discrete object size for 2D and five times for 3D problems. It is worth noting that, using these or other efficient algorithms, the cost of the Global Neighbour Search represents typically less than 5 percent of the total computation while the total cost of the search can reach values over 75 percent [14], specially when the search involves non-spherical geometries since it requires, in general, the resolution of a non-linear system of equations (see the case of superquadrics [4,47] or polyhedra [48,49,50]). In this sense, the focus should be placed on the Local Contact Resolution check rather than on optimizing the Global Neighbour Search algorithms.
Local Resolution Check
The local contact detection basically consists in determining which of the potential neighbours found during the global search algorithm constitute an actual contact with the target particle and to determine their contact characteristics (point of contact, normal direction, etc.). The case of spheres is trivial (fig. 4), contact exists if the following condition is met:
|
|
(1) |
and the normal and point of contact can be easily determined as it will be detailed in section 2.4.

|
| Figure 4: Spherical particles in contact |
The problem of contact determination becomes complex and time consuming when other geometries such as superquadrics, polyhedra or NURBS are used to represent the particles or boundaries. A way to improve the efficiency is to take advantage of the temporal coherence. Normally the duration of a contact is encompassed by several calculation time steps and therefore the particle positions will only change a little bit. In this regard, it seems wise to perform the contact detection after several time steps instead of at every time step aiming to reduce the computational cost that it involves. However, if the contacts are not determined when the particles start to collide, the indentations will achieve high values which will lead to inaccurate results and numerical instabilities (section 2.6.4).
A possible solution for this issue is the use of a technique known as Verlet neighbouring lists [51,4]. It consists on using enlarged bounding boxes in the global search so that more remote particles are stored as well. This local Verlet list need no update during several time steps since the particles move only small distances every step. This way it can be assured that no contacts are missed along the simulation and the frequency of the search is reduced. This method is efficient for cases with high dispersion of particles.
In the framework of this dissertation, a basic cell-based algorithm [40] is chosen which has been parallelized using OMP. The geometries used for the particles are only spheres or clusters of spheres and thus the local detection is efficient. The treatment of the contact with FE representing rigid or deformable boundaries is extensively discussed in chapter 3.
2.3 Equations of motion
In the basic soft particle DEM approach the translational and rotational motion of particles are defined by the standard equations for the dynamics of rigid bodies. For the special case of spherical particles, these equations can be written as:
|
|
(2) |
|
|
(3) |
where , , are respectively the particle centroid displacement, its first and second derivative in a fixed coordinate system , m is the particle mass, the inertia tensor, is the angular velocity and the angular acceleration.
The forces {F} and the torques {T} to be considered at the equations of motion (eq.2 and eq. 3) are computed as the sum of:
- all forces {F}^{ext} and torques {T}^{ext} applied to the particle due to external loads.
- all the contact interactions with neighbouring spheres and boundary finite elements {F}^{ij}, j=1,\cdots , n^c, where i is the index of the element in consideration and j the neighbour index of the entities (particles or finite elements) being in contact with it.
- all forces {F}^{damp} and torques {T}^{damp} resulting from external damping.
This can be expressed for every particle \end{array}</math>i as:
|
|
(5) |
where is the vector connecting the centre of mass of the -th particle with the contact point with the -th particle (eq. 8). and satisfy . Fig. 5 shows contact forces between two spherical particles.
The rotational movement equation (3) is a simplified version of the Euler equations coming from the fact that a sphere has constant coefficients for its three principal inertia axes which are independent of the frame. The complete equations can be found in section 2.7 where the case of generic particle shapes is discussed.
2.4 Contact kinematics
The forces and torques that develop from a contact event are derived from the contact kinematics at the point of contact . The local reference frame in the contact point is defined by a normal and a tangential unit vectors as shown in figure 5.
|

|
| (a) Contact between two particles | (b) Contact force decomposition |
| Figure 5: Kinematics of the contact between two particles | |
The normal is defined along the line connecting the centres of the two particles and directed outwards from particle .
|
|
(6) |
The indentation or inter-penetration is calculated as:
|
|
(7) |
where , are the centre of the particles and , their respective radius.
The vectors from the centre of particles to the contact point and are in general dependent on the contact model. they should take into account the contribution of each particle to the equivalent stiffness of the system. Eq. 8 describes the simple case of two linear springs with different Young's modulus set in serial:
|
|
(8) |
The position of the contact point can then be determined from any of the particles:
|
|
(9) |
The velocity at the contact point is determined by eq. 10 taking into account the angular and translational velocities of the contacting particles, as shown in fig. 5.
|
|
(10) |
In case of contact with a boundary , the velocity of the rigid (or deformable) structure at the contact point has to be determined. If finite elements are used to discretize the boundaries, typically the velocities can be interpolated from the nodal velocities by means of the shape functions (see chapter 4). Equation 10 is then modified to:
|
|
(11) |
The velocity at the contact point can be decomposed in the local reference frame defined at the contact point as:
|
And thus, the definition of the tangential unit vector becomes:
|
|
(13) |
Now the contact force }{F}^{ij}\mbox{ between the two interacting spheres and can be decomposed into its normal and tangential components (Fig. 5):
|
|
(14) |
The forces , are obtained using a contact constitutive model. Standard models in the DEM are characterized by the normal and tangential stiffness, normal and tangential local damping coefficients at the contact interface and Coulomb friction coefficient represented schematically in Fig. 6 for the case of two discrete spherical particles.

|
| Figure 6: DEM standard contact rheology |
Some of the most common models are detailed in the next section 2.5. The models used in a combined DE-FE strategy are described in Chapter 4.
2.5 Contact models
The contact between two particles poses in general a complex problem which is highly non-linear and dependent on the shape, material properties, relative movement of the particles, etc. Theoretically, it is possible to calculate these forces directly from the deformation that the particles experience during the contact [52]. In the framework of the DEM however, simplified models are used which depend on a few contact parameters such as the particles relative velocity, indentation, radius and material properties such as the Young's modulus and Poisson's ratio toghether with some parameters that summarize the local loss of energy during the contacts.
The most common model is the so-called linear spring-dashpot model (LS+D) proposed by Cundall and Strack [2] which has an elastic stiffness device and a dashpot which introduces viscous (velocity-dependent) dissipation. This model, while being the simplest one, happens to yield nice results as described in the work from Di Renzo and Di Maio [53] for the case of elastic collisions and in the work of Thornton [54] for the case of inelastic collisions. This model is described in section 2.5.1.
In a second level of complexity, we find models that derive from the theory of Hertz-Mindlin and Deresiewicz. Hertz [55] proposes that the relationship between the normal force and normal displacement is non-linear. Mindlin and Deresiewicz [56] proposed a general tangential force model where the force-displacement relationship depends on the whole loading history as well as on the instantaneous rate of change of the normal and tangential force or displacement. This model was adapted to the DEM by Vu-Quoc and Zhang [57] and later by Di Renzo and Di Maio [53]. This model is quite complicated and requires high computational effort. Other simplified models exist [58,53,54] which consider only the non-slip regime of the Mindlin theory [59]. The model presented in section 2.5.2 is the simplified model by Thornton et al. [54], labeled HM+D.
Other models exist in literature which introduce plastic energy dissipation in a non-viscous manner. This includes the semi-latched spring force-displacement models of Walton and Braun [60] which uses, for the normal direction, different spring stiffnesses for loading and unloading. Similarly, Thornton [61] introduced a model in which the evolution of the contact pressure can be approximated by an elastic stage up to some limit followed by a plastic stage.
Unless the contrary is specified, the HM+D contact law will be used in examples of the thesis. In general, the criterion suggested here is to employ this model with the real material parameters whenever the physics of the contact have influence in the simulation results. In other cases, where the details of the contacts are not relevant, both linear and Hertzian contact laws can be used as a mere penalty technique being the stiffness value a trade-off between simulation time and admissible interpenetration. The model presented for the cohesive materials in chapter 5 is an extension of the linear law (LS+D).
2.5.1 Linear contact law (LS+D)
The model presented here corresponds to a modification of the original model from Cundall and Strack [2] in which the damping force is included in the way the contact rheology has been presented (figure 6).
Normal force
In the basic linear contact law the normal contact force is decomposed into the elastic part and the damping contact force :
|
|
(15) |
The damping part is a viscous force which models the loss of energy during a contact. It also serves as a numerical artifact that helps to decrease oscillations of the contact forces which is useful when using an explicit time scheme.
Normal elastic force
The elastic part of the normal compressive contact force is, in the basic model, proportional to the normal stiffness and to the indentation (or interpenetration) (eq. 7) of the two particle surfaces, i.e.:
|
|
(16) |
Since no cohesive forces are accounted in the basic model. eq. 16 holds only if , otherwise . The cohesive contact will be considered in Chapter 5.
Normal contact damping
The contact damping force is assumed to be of viscous type and given by:
|
|
(17) |
where is the normal relative velocity of the centres of the two particles in contact, defined by:
|
|
(18) |
The damping coefficient is taken as a fraction of the critical damping for the system of two rigid bodies with masses and connected by a spring of stiffness with:
|
|
(19) |
with and is the equivalent mass of the contact,
|
|
(20) |
The fraction is related with the coefficient of restitution , which is a fractional value representing the ratio of speeds after and before an impact, through the following expression (see [62]):
|
|
(21) |
Contact duration
The equation of motion describing the collision of particles with the LS+D model in the normal direction is achieved solving the differential equation resultant from the application of equation 2 in a frame centred at the point of contact:
|
|
(22) |
Eq. 22 can be rewritten as [62]:
|
|
(23) |
Where is the frequency of the undamped harmonic oscillator and is the part accounting for the energy dissipation.
The solution of the eq. 22 for the initial conditions and and for the sub-critical damped case1 ( or ) reads:
(1) The cases of critical and super-critical damping yield to other solutions which can be found in [63]
|
|
(24) |
And the relative normal velocity of the spheres:
|
|
(25) |
Now the contact duration can be determined from the condition , which combined with eq. 24 gives:
|
|
(26) |
Note that the contact duration does not depend on the initial approaching velocity which is obviously wrong as the formulation is not derived from the theory of elasticity [52] (see section 4.4 for more details).
The coefficient of restitution can be rewritten as:
|
|
(27) |
The inverse relationship allows the determination of the parameter of the model from the restitution coefficient , with the intermediate calculation of :
|
|
(28) |
Finally, the maximum indentation can be obtained from the condition :
|
|
(29) |
Note on tensional forces
It has been appointed by different authors [62,64,54] that this simple model presents unrealistic tension force when the particles are separating if the damping force is large enough (Fig. 7). Normally in the implementation of the codes the normal force is constrained to be exclusively positive, i.e always, as no tractions occur in frictional cohesion-less contacts. In this situation the definition of the contact duration should be modified as it has been derived by Schwager and Pöschel [64].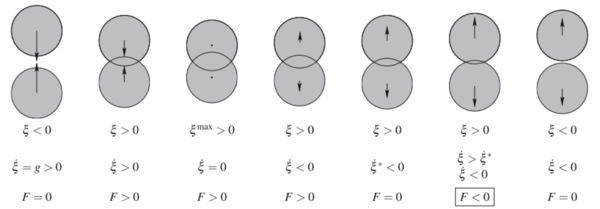 ] ]
|
| Figure 7: The different stages of a normal collision of spheres with a viscous damped model. Taken from: Fig. 1 in Schwager and Pöschel [64] |
The determination of the damping coefficients and the maximum indentation vary accordingly. It is not possible to derive an explicit expression for the damping coefficient in function of the restitution coefficient . Fitting curves are proposed in [54].
Tangential frictional contact
In the original model from Cundall and Strack [2] the relationship between the elastic shear force and the relative tangential displacement is defined through a regularized Coulomb model. The update of the tangential force at time step reads:
|
|
(30) |
Several authors (including the original paper) calculate the increment of tangential displacement at a given time step , , as . In our in-house code implementation it is calculated from the integration of the relative displacement and rotation in the local frame:
|
In the original paper [2] the damping is included only during the non-sliding phase () and it is applied afterwards as an extra force which opposes the relative velocity. The magnitude of the damping force is evaluated as where the tangential damping coefficient. In other authors' works and also in our code implementation it is chosen to include the dissipation in the check for sliding. In case of sliding (), extra decision on how to distribute the resultant tangential force in elastic and dissipative part have to be taken. This will not be discussed here. Eq. 30 modifies as:
|
The previous time step forces are transferred from its previous local coordinate frame to the new local contact frame with a rotation of the force vector (section 2.7.1).
Selection of the stiffness and damping parameters
The selection of the normal stiffness is, in the LS+D model, a design parameter. The general rule of thumb is that the value of should be large enough to avoid excessive particle inter-penetration but at the same time should be small enough to permit reasonable simulation time steps (section 2.6.4) [65].
Cundall and Strack [2] investigated several values for the relation in the range , obtained from the following expression:
|
|
(33) |
The values for the damping in the original paper [2] are selected as a proportion of the respective stiffnesses:
|
Normally, the selection of will be based on the desired restitution coefficient through eq. 19 and 21. Alternatively, Schäfer [66] suggests a value of equal to two-sevenths of the normal stiffness coefficient and a damping as half of the normal damping coefficient. Thornton [67], in his turn, suggests a value of that yields the same contact duration as the one predicted by the Hertzian theory (section 2.5.2).
(1) The cases of critical and super-critical damping yield to other solutions which can be found in [63]
2.5.2 Hertzian contact law (HM+D)
As introduced in section 2.5, there exist in literature several contact laws under the framework the Hertzian contact theory [55]. The model chosen for this dissertation is an adaptation of the one referred as HM+D model in the work by Thornton [54] due to its balance between simplicity and accuracy in both elastic [53,67] and inelastic collisions [54]. This is a model based on the original one by Tsuji [58] in which the tangential spring is provided by the no slip theory of Mindlin [59].
The magnitude of the normal force can be calculated as:
|
|
(35) |
The tangential update has two branches whether the normal force is increasing (loading phase) or decreasing (unloading case). For the loading phase the tangential force is increased as usual due to the tangential displacement (Eq. 36.a). In the unloading phase, however (Eq. 36.b), the tangential force must be reduced (even with no tangential displacement) due to the reduction in the contact area. The interpretation of this is that the previous tangential force can not longer be supported [54].
|
Finally, the check for sliding is performed restricting the maximum tangential force to the Coulomb's friction limit:
|
The stiffness parameters were described by Tsuji [58] following from the Hertz theory [55] and the works of Mindlin and Deresiewicz [56]:
|
The same for the damping parameters:
|
The expressions presented here (eq. 9.2 and 9.2) are a generalization to the case of two spheres and colliding with different values of , , and . This generalization includes the case of a sphere colliding with a fixed wall which will be discussed in section 2.5.3.
|
Although the selection of the stiffness has here a physical meaning, it is common practice however, to diminish its value to increase the calculation speed in simulations where the correct contact duration and rebound angles are not of capital importance. The derivation of the force-displacement relationship and the collision time by the Hertzian theory are described in the Appendix A.
2.5.3 Contact with rigid boundaries
Rigid boundaries are commonly introduced in a DE simulation to model the interaction of particles with mechanical components that can be either fixed or have an imposed rigid body motion. Although they are normally discretized with a FE mesh for contact detection purposes (section 3.1), they are not calculated by means of a FE procedure. The rheology of a particle contacting a FE is presented in figure 8.
|
| Figure 8: DE-FE standard contact rheology |
Same as for DE/DE contact, Hertzian contact law is preferred to model the contacts or impacts in a physical basis. Alternatively the linear contact law can still be used as basic penalty method. The adaptation of the presented Hertzian contact law to the case of rigid boundaries is straightforward, it simply requires the particularization of the equivalent contact parameters summarized in 9.2 setting: and . The normal stiffness of the wall is left as an input parameter so that a certain elasticity of the wall can be modelled. Since the tangential displacement of the wall will be in most cases much smaller than the particle's one, it is recommended to be set [58]. The equivalent values become:
|
The stiffness and damping parameters are modified accordingly inserting these equivalent values in eq. 9.2 and eq. 9.2. The friction value to be employed in this case is a new parameter to be introduced, which is characteristic of the contact between the two materials involved and might be different from the particle-particle friction.
Additionally, special contact laws can be applied which model other effects such as a specific dynamic response, wear, plasticity, thermal coupling, etc. [68,69,70].
2.5.4 Rolling friction
It should be noted that the use of spherical particles to represent real materials may lead to excessive rotation. To avoid this effect the rolling resistance approach has been used. This approach consists in imposing a virtual resistive torque which is proportional to the normal contact force and opposites the rolling direction. The rolling resistance torque is defined as;
|
|
(42) |
where is the rolling resistance coefficient that depends on the material, is the smallest radius of the DEs in contact and the relative angular velocity of both DEs. Note that for the case where particle is in contact with a wall ().
An improvement to the classical Rolling Resistance Model A presented by Wensrich and Katterfeld [71] has been developed by Irazábal [72] in order to avoid the instabilities that appear when is close to .
2.6 Time integration
The equations of motion introduced in section 2.3 can be numerically integrated to obtain a solution of the problem. Traditionally there are two strategies to achieve this: a) An explicit scheme where the information at the current (or previous steps) suffices to predict the solution at the next step. b) An implicit scheme, which requires the solution of a non-linear system of equations to compute the state at the new time step. The disadvantage of the explicit schemes is that they require the time step to be below a certain limit in order to be stable. Implicit schemes instead, are unconditionally stable and thus, allow for larger time steps.
Some analysis on both implicit and explicit methods for discrete element simulations showed that the second one is generally preferable [73,74]. Implicit algorithms turn to be not efficient for DEM simulations because of the nature of the dynamics of particles where relatively large motions are simulated combined with very small characteristic relative displacements between particles during contact events. In order to correctly capture the dynamics of the contact, the time resolution should be several times smaller than the duration of these contacts [74]. Under this condition, the explicit integration yields sufficient accuracy and the time step is generally below its stability limits (see section 2.6.4). Following the same reasoning, low order explicit schemes are usually preferred rather than higher order ones. Another important outcome of the use of an explicit integration is the easier parallelization of the code and the avoidance of linearization and employment of system solvers.
In other situations where the same contacts are kept for large simulation times, such as cohesive models for DE (chapter 5), the use implicit schemes can be advantageous. Otherwise, the stiffness matrices have to be rebuild, in general, at each iteration and time step due to the formation and destruction of contacts. Amongst the most popular implicit approaches in DEM is the Discontinuous Deformation Analysis [75].
2.6.1 Explicit integration schemes
In the present dissertation an explicit integration is used. Next, four different one-step integration algorithms with similar computational cost are described and compared in this section. The derivation of these methods comes from the application of the Taylor series approximation to the second order differential equations of motion (2) that describes the problem.
|
|
(43) |
Forward Euler
The forward difference approximation of the first derivative of a function reads as:
|
|
(44) |
The terms can be rearranged to obtain an integration formula:
|
|
(45) |
which is applied to the integrate the acceleration and the velocity respectively:
|
The truncation error of the Taylor expansion approximations are of . Hence, the method is referred to as a first order approximation of the displacement and velocities.
Symplectic Euler
The Symplectic Euler is a modification of the previous method which uses a backward difference approximation for the derivative of the position:
|
|
(48) |
The algorithm is as follows:
|
This way a higher accuracy and order of convergence can be achieved as it is shown in the numerical convergence analysis performed in the following section 2.6.3.
Taylor Scheme
The Taylor schemes are a family of integration methods which make use of the Taylor expansion (43) to approximate the next values of the variable of interest. If the series are truncated at the first derivative for the velocity and at the second derivative for the position, the following integration rule is obtained:
|
Which is a first order integrator for the velocity and a second order integrator for the position.
Velocity Verlet
This algorithm is sometimes simply called Central Differences [76,38] and some other times it is interpreted as the velocity form of the Verlet algorithm [74,77]. It also coincides with the special case of the Newmark-beta method [78] with and . The derivation presented here is the same as it is described by Belytschko in [76]. The central difference formula is written as:
|
|
(53) |
Applying it to the velocity at an intermediate position :
|
|
(54) |
and to the acceleration at the time step :
|
|
(55) |
Inserting equation 54 and its counterpart for the previous time step () into equation 55, the central difference formula for the second derivative of the displacement is obtained:
|
|
(56) |
The algorithm follows from the rearrangement of equations 54 and 55
|
Since it may be necessary to have both velocity and position evaluated at every time step of the discretization, a split in the calculation of can be performed.
|
The implementation of the method is summarized in the following table:
| Initialization of the scheme. | , |
| while | |
| Update step: | , |
| First velocity update: | |
| Position update: | |
| Calculate forces | |
| Calculate acceleration: | |
| Second velocity update: |
This is the selected scheme for the examples in this dissertation.
2.6.2 Integration of the rotation
The particular case of spherical particles simplifies the equations for the rotation of rigid bodies yielding to equation 3. Some authors [79,80,60] adapt a simple central difference scheme to integrate the equations:
|
The vector of incremental rotation is then calculated as:
|
|
(63) |
Knowledge of the incremental rotation suffices to update the tangential contact forces. If necessary, it is also possible to track the rotational position of particles, as detailed in section 2.7.1.
2.6.3 Accuracy analysis
In this section the error of the different integration methods previously introduced is addressed by means of accuracy and convergence analysis. Three cases representative of translational motion occurring in a DEM simulation are analysed here: free parabolic motion, normal contact between two spheres using a linear contact law and normal contact between two spheres using a Hertzian contact law. The description of the test examples is in figure 9. A similar analysis has been performed by Samiei [74] for the comparison of some explicit schemes against implicit integration.
The case of rotational motion is analysed in section 2.7.3 where a higher order scheme is implemented for the case of a generic rigid body which can be also applied to the spheres. It is shown that the integration of the rotation equation requires higher order schemes for similar levels of accuracy as the one-step methods.
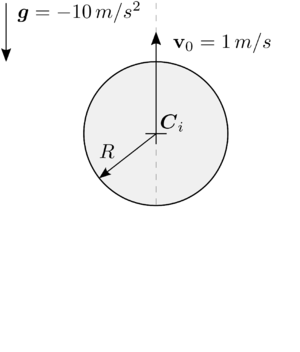
|
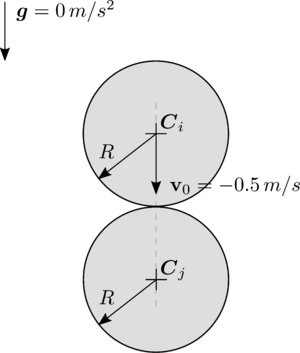
|
| (a) Set-up parabolic motion | (b) Set-up normal contact |
| Figure 9: Examples for the accuracy and convergence analysis on time integration schemes | |
Parabolic motion analysis
An initial upwards velocity of is set to a particle situated at the origin of coordinates which moves freely only under the effect of gravity which is set to during seconds.
A numerical integration of the problem is performed with the presented methods and compared against the analytical solution. The time step is chosen to be a tenth of the total time so that the error of the methods can be easily observed.
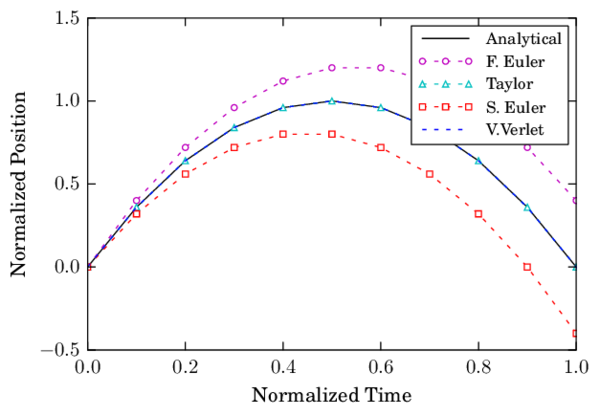
|
| Figure 10: Vertical displacement of a sphere under gravity using time steps |
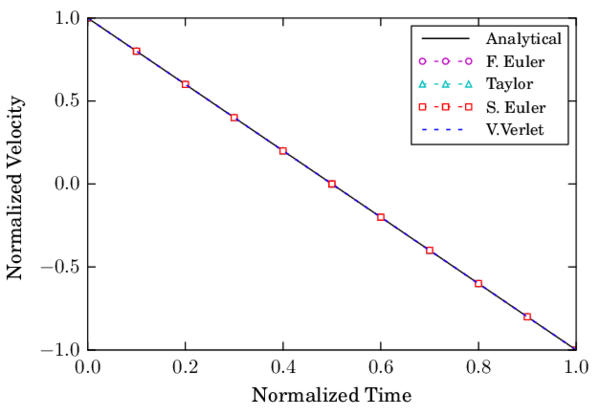
|
| Figure 11: Velocity of a sphere under gravity using time steps |
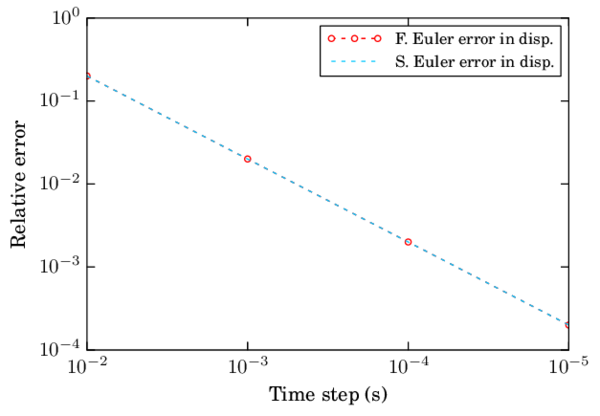
|
| Figure 12: Convergence in velocity and displacement for different integration schemes |
Figure 12 shows that the Forward Euler and Symplectic Euler schemes have a linear convergence when integrating the position. The convergence is omitted for other schemes and for the velocity since the algorithmic error is null.
Normal contact analysis with the LS+D model
Two spheres are set in space with tangential contact (no indentation) and without the effect of the gravity. One of the spheres approaches the other one with an initial velocity in the direction of the vector joining the spheres' centres as depicted in figure 9c. The linear contact law introduced in section 2.5.1 is applied.
The expression for the maximum indentation (eq. 29) for the non-damped case turns into:
|
|
(64) |
And the contact duration (eq. 26):
|
|
(65) |
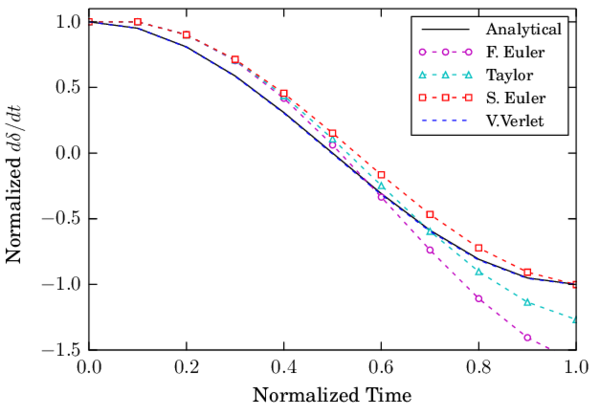
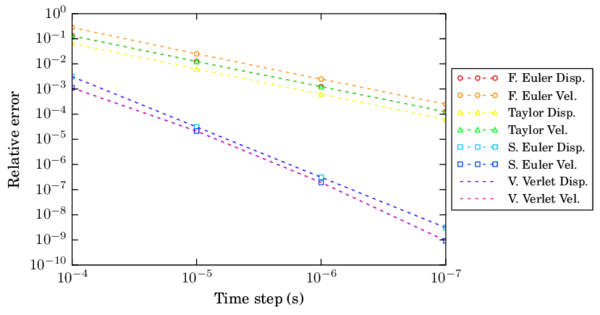
The simulation is carried out for the different schemes with a time step corresponding to a contact resolution1 () of 10, i.e. the time step corresponds to a tenth of the contact duration. The parameters of the simulation are summarized in the following Table 2:
| Contact law | Linear Contact Law (section 2.5.1) |
| Radius | |
| Density | |
| Restitution coeff. | |
| Contact time | |
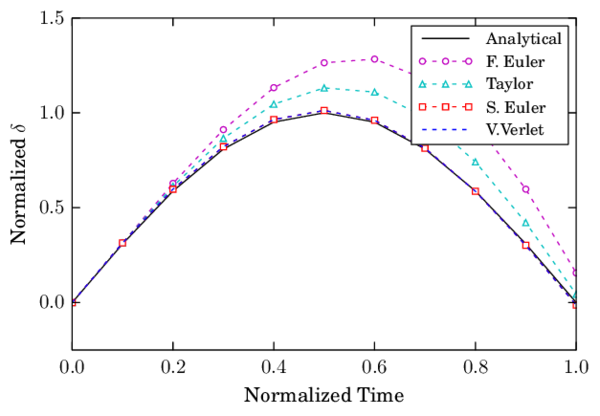
|
| Figure 13: Indentation during the collision of two spheres using LS+D with |
|
| Figure 14: Velocity during the collision of two spheres using LS+D with |
|
| Figure 15: Convergence in velocity and displacement for the FE and SE schemes |
The numerical results for the maximum indentation as well as the exit velocity of the contact have been taken as the measures to evaluate the error for different time steps. Both F.E. and Taylor schemes showed linear convergence in displacement and velocity (Fig. 15). On the other hand, S.E. and V.V. showed quadratic convergence for the displacement and velocities.
Normal contact analysis with the HM+D model
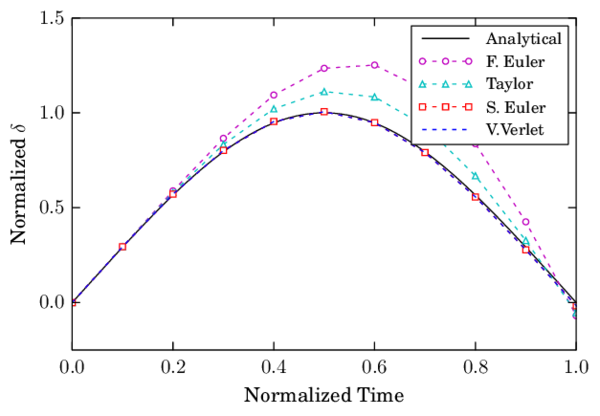
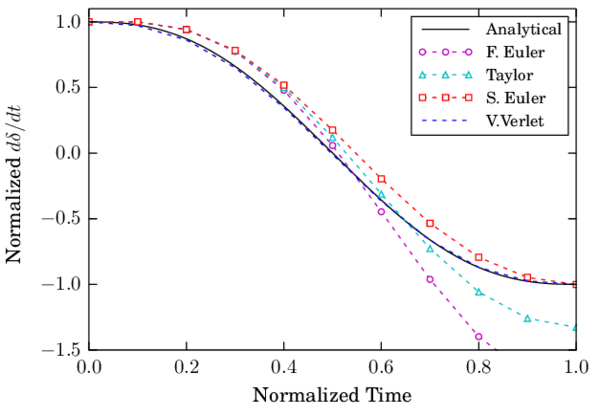
Finally, the same test is carried out using a Hertzian contact law (section 2.5.2). The derivation of the contact time duration and other properties of the Hertzian contact are detailed in Appendix A. The simulation parameters are summarized in Table 3. The different schemes are tested with a and the results for the indentation evolution and its time derivative are plotted in Fig. 16 and Fig. 17 respectively.
| Contact law | Hertzian Contact Law (section 2.5.2) |
| Radius | |
| Density | |
| Young's modulus | |
| Poisson's ratio | |
| Restitution coeff. | |
| Contact time | |
|
| Figure 16: Indentation during the collision of two spheres using HM+D with |
|
| Figure 17: Velocity during the collision of two spheres using LS+D with |
In terms of convergence, the velocity presented even a higher order than quadratic for the Verlet scheme. It shall be noticed however, that the error of this variable for the selected time steps is too small to draw conclusions on the scheme convergence.
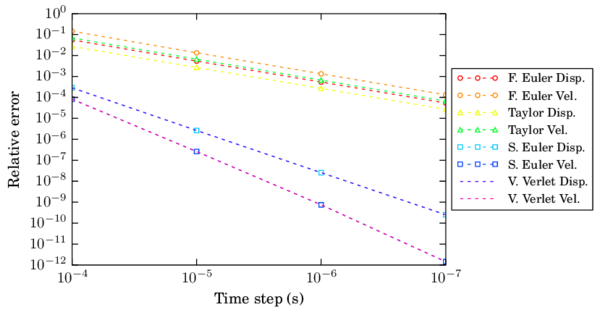
|
| Figure 18: Convergence in velocity and displacement for different integration schemes |
(1) The concept of contact resolution defined as is discussed in section 2.6.4.
2.6.4 Stability analysis
There are many factors that can cause instabilities in a Discrete Element simulation. The first basic requisite for the time step, in a DEM simulation, is to be stable in terms of the integration scheme. Another significant source of instabilities is the lack of accuracy in the determination of the formation of contacts. In this sense, quantities such as the velocity of the particles and the search frequency play a great role in the overall stability and are not sufficiently studied in the literature. While most of the authors merely perform a scheme stability analysis [81] for the determination of the time step, a large safety factor is applied which reduces the estimated value. This reinforces the idea of using a time step based on the concept of contact resolution [12,82] defined as the number of steps used to resolve a contact event, .
Stability of the integration scheme
Explicit integration schemes present a limitation in the time step in order to be numerically stable . Belytschko [76] shows that the critical time step for a central difference method is determined by the highest natural frequency of the system }\omega _{max}\mbox{ as:
|
|
(66) |
Exact calculation of the highest frequency }\omega _{max}\mbox{ requires the solution of the eigenvalue problem defined for the whole system of connected rigid particles. In an approximate solution procedure, an eigenvalue problem can be defined separately for every rigid particle using the linearized equations of motion. The maximum frequency is estimated as the largest of the natural frequencies of the mass-spring systems defined for all the particles with one translational and one rotational degree of freedom:
|
|
(67) |
And the natural frequency for each mass-spring system (contact) is defined as:
|
|
(68) |
being the spring stiffness and the mass of particle . Now, for the case with no damping, it is possible to rewrite the critical time step as:
|
|
(69) |
The effective time step is considered as a fraction of the critical time step:
|
|
(70) |
The fraction has been studied by different authors. O'Sullivan and Bray in [81] recommend values close to for 3D simulation, and for the 2D case.
If damping exists, the critical time increment is modified with the fraction of the critical damping corresponding to the highest frequency }\omega _{max}\mbox{ in the following way [76]:
|
|
(71) |
Further details are given in section 4.4.1 where the critical time step for a explicit finite element procedure is discussed.
Example of the scheme stability
An example is presented here to show the performance of the different schemes for time steps near the critical one and smaller. A sphere of radius and density oscillates between two parallel plates which are separated using a linear contact law with stiffness . The sphere presents an initial indentation with the top plate of (fig. 19a). The example tries to simulate the instability effects that can occur locally in a system with dense particle packings.
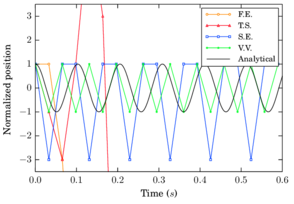
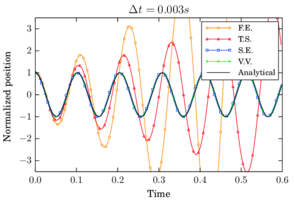
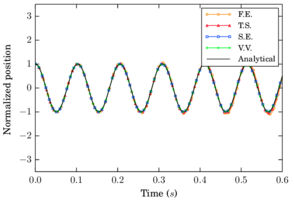
The linear mass-spring system has a theoretical frequency1 of which yields to a critical time step . The results for the four schemes are presented (fig. 19) using time steps: , and .
The results show how the Velocity Verlet is the only scheme which has an acceptable performance in the limit of the critical time step (fig. 19b) as it is a second order scheme. It was found that for a slightly larger time step the Velocity Verlet scheme becomes also unstable as predicted by the criterion in eq. 69. Symplectic Euler, which showed properties similar to a second order scheme in terms of accuracy, does not unstabilize but presents a wrong prediction of the amplitude. As it can be seen in figure 19c the first order schemes are still unstable even for a time step which is ten times smaller than the critical one, being Forward Euler the most unstable one. Finally, in figure 19d it is shown that all methods converge to the analytical solution as the time step diminishes.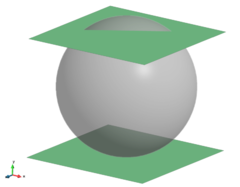
|
|
| (a) Setup of the example | (b) Position evolution for |
|
|
| (c) Position evolution for | (d) Position evolution for |
| Figure 19: Setup and results for the position of the sphere between the plates | |
Stability due to lack of accuracy
The lack of accuracy can produce instabilities in a DEM simulation. The easiest way to explain it is to imagine a particle travelling with a very large velocity towards another particle or a wall; while the critical time step was shown to be independent of the velocity (eq. 71), a large velocity will imply inaccuracy in the detection of the contact and this translates into an indentation that can be unboundedly large and thus yielding to an unrealistic increase in the energy. This can also be interpreted as an insufficient resolution of the contact.
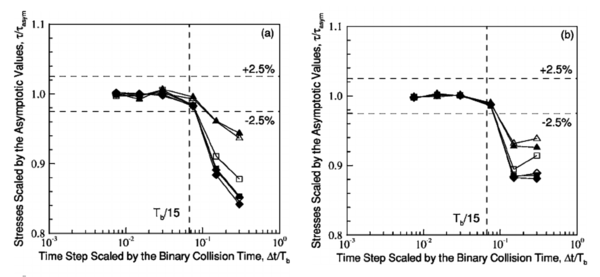
An example of this effect is found in the work by Ketterhagen et al. [12] where an analysis of how the time step affects the mean stress tensor measurements in two-dimensional granular shear flow simulations is performed. For a time step small enough the simulation results for the stress tensor (or any other variable) should be independent of the time step size. The studies performed using a linear contact model and several stiffness values showed that for a the error in the stress measurement was below while higher time steps yielded a sudden increase in the error up to values above . These inaccuracies may introduce instabilities as it was shown by their results which are referenced here in Fig. 20.
 ] ]
|
| Figure 20: Stress measurement error in shear flow simulations. Taken from: Fig. 4 in Ketterhagen et al. [12] |
A commonly accepted approach as an alternative to the critical time step criterion (section 2.6.4) is to select the time step of the simulation in function of the characteristic duration of the contacts, i.e, by means of the contact resolution. No agreement is found when addressing a correct value for the , several authors recommend values around which is quite conservative (See [83,84,60,65]), Keterhagen et al. recommends a contact resolution of while others like Dury [85] use larger time steps: . O'Sullivan [81] determines values of in the range using a central differences scheme with regular mono-disperse (same radius) meshes.
Summarizing, there is not a unique solution for the problem of selecting a suitable time step. It depends on many factors such as the mesh, the integration scheme, the type of simulation, the material parameters, the contact law, etc. Our suggestion is to estimate a characteristic contact time of the problem and then select a time step based on the criterion in the range depending on the conditions of the problem and the accuracy desired. This will be in general much lower than the critical time step.
(1) The multiplying the stiffness comes from the fact that this is not a single mass-spring system, instead two plates are contributing to the stiffness of the system.
2.6.5 Computational cost
From the accuracy and stability analysis it is clear that Velocity Verlet and Symplectic Euler are much superior than the Forward Euler and Taylor Scheme, being Velocity Verlet the best one among these four one-step schemes. The final aspect to take into consideration is the computational cost of the method. Simulations in real applications involve millions of particles and can also comprehend millions of time evaluations. The example described in section 6.2.2 is used here to calculate time steps. It includes approximately 30.000 spheres contacting among them and also with around rigid finite elements. The test has been run in a personal computer with an Intel Core i7 processor of 4 Gb RAM and 2.93 GHz.
| Scheme | F. Euler | Taylor | S. Euler | V. Verlet |
| Time (s) | 169.61 | 170.04 | 169.64 | 174.28 |
The results showed similar computational times for the four schemes. Velocity Verlet performed slowlier which is insignificant considering the advantages found in terms of accuracy and stability in the integration of velocities. Obviously, it will vary in every computer but in general lines we determine that it is worth to employ a Velocity Verlet scheme.
2.7 Particle shape
In granular matter, the effects of the particle geometry are crucial in the behaviour of the particles as a bulk or as individuals [86]. Often, the phenomenological approach is considered and the granular media are modelled with spheres as it is the cheapest and most efficient option for simulating a large amount of particles [79]. Alternatively, if we want a method which is purely based on contact and other interaction forces, the real geometry of the particles have to be well represented.
Among the most common methods there is the use superquadrics, which permits a wide range of symmetric convex shapes [4], the Granular Element Method [87], which uses NURBS to represent the particles and, finally, the use of clusters or agglomeration of spheres [88]. The last one is chosen in this work since it provides great balance between shape representation accuracy1 and efficiency in terms of computational cost. Furthermore, it is the most versatile method in terms of particle shape and can naturally include angularities. The contact forces and torques are evaluated as usual on every sphere through eq. 4 and eq. 5. The contribution from every sphere is then gathered and translated to the centre of gravity of the rigid body altogether with the additional torque yielding from the application of the this force from the centre of every particle to the centre of the cluster through the distance vector .
|

|
| Figure 21: Discretization of a rigid body using a cluster approach with spheres on the surface or overlapping in the interior |
Once the total force and torque of the rigid body is obtained, the classical Newton's second law for the translation and the Euler rotation equations have to be solved in order to obtain the full motion of the rigid body (section 2.7.2). These equations can be integrated in an explicit way, preferably with a second or higher order scheme (section 2.7.3).
(1) The use of sphere cluster can introduce artificial friction due to the irregularities in the surface meshed by spheres. This problem is discussed in [89].
2.7.1 Representation of the rotation
There are three ways which are very popular to represent rotations in the DEM: the use of Euler Angles, the use of rotation matrices and the use of quaternions. A review of the advantages and drawbacks of the methods can be found in [90].
The use of quaternions represents a clear advantage. It avoids the singularity problems that Euler angles present, it is more compact and it has less memory requirements than storing rotation matrices. Furthermore, the rotation operations are done in a more efficient way than using rotation matrices.
A rotation matrix is a orthogonal matrix which transforms a vector or a tensor from one coordinate system to another one as follows:
|
Given a rotation of degrees over a unitary vector , the rotation matrix is constructed as follows:
|
|
(74) |
A quaternion can summarize the same information just using 4 scalars. It is defined in the complex number system as:
|
|
(75) |
or in a compact form:
|
|
(76) |
Defining its conjugate as , the norm of a quaternion can be expressed:
|
|
(77) |
and its inverse:
|
|
(78) |
Now, given a rotation of degrees over a unitary vector , the resulting unit quaternion reads:
|
|
(79) |
And the conversion from quaternions to a rotation matrix is the following:
|
|
(80) |
By using unit quaternions the intermediate transformation to a rotation matrix can be skipped and the rotation can be directly applied to vectors and tensors. The specification of unit quaternions is important in order to preserve lengths during rotational transformations. The rotations are applied in the following way:
|
To do so, the multiplication operation needs to be employed. Given two quaternions and the multiplication yields a new quaternion :
|
|
(82) |
The vector involved in a quaternion multiplication (eq. 81.a) is treated as a quaternion with a null scalar part. The tensor multiplication (eq. 81.b) can be simply done treating the tensor as an assembly of vectors that are being multiplied subsequently. Note that the multiplication of quaternions is not commutative since it involves a cross product. A extended review on quaternion algebra can be found in [91].
2.7.2 Rigid body dynamics
In a rigid body the distance between two material points is constant over time. Any spatial movement undergone by a rigid body can be described with the displacement of the centre of mass plus a rotation over some axis passing through the centre of gravity.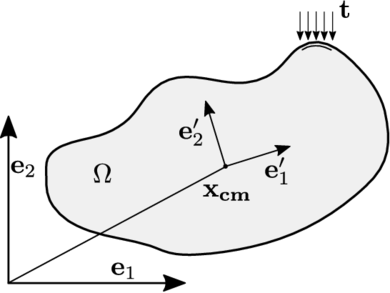
|
| Figure 22: A generic rigid body |
For sake of convenience the spatial description of the body will be used identifying the position of every material point in time with its spatial position referred to global inertial reference system . In its turn, the superscript as in denotes a quantity expressed with respect to the body fixed frame . The temporal dependence will be dropped in the following developments for clarity.
The definition of the centre of mass of a body enclosed by the domain supposing constant density is:
|
|
(83) |
Defining . The velocity and acceleration can be obtained:
|
The linear and angular momentum are defined as:
|
and the balance expressions for linear and angular momentum read:
|
Now, the expression for the translational motion is obtained combining equation 85.a and 84.b onto the equation of balance of linear momentum 86.a yielding the classical Newton's second law of motion:
|
|
(87) |
Likewise, the expression for the rotational motion is achieved plugging equation 85.a into equation 86.a and evaluating the temporal derivative. The expression of the Euler equations is found with the use of eq. 84.b and eq. 84.a onto the balance of linear momentum (eq. 86.a).
|
|
(88) |
Where is the inertia tensor which is defined as:
|
|
(89) |
Note that the inertia tensor depends on the reference axis. Only in a body fixed frame the tensor has constant components. If we set this frame 88 in the so-called principal axis of inertia the tensor diagonalizes and the Euler equations can be expressed component-wise as:
|
|
(90) |
2.7.3 Time integration of rotational motion in rigid bodies
The integration of the rotation needs different schemes than the ones presented for the translational motion in section 2.6.1 due to the higher complexity of the equations. The strategy described here is an adaptation of the scheme presented by Munjiza et al. [92] and Wellman [4]. The modification consists in the use of quaternions instead of rotational matrices in the integration scheme which makes the calculations more efficient in terms of computational cost and memory storage. The point of departure is the balance of angular momentum in the following form:
|
|
(91) |
Munjiza et al. [92] introduced the idea that the change in angular momentum can be approximated by increments due to the change in the external torques at every time step. Actually, this assumption adapts perfectly to the temporal discretization used in DEM where the forces and torques are evaluated in discrete time steps.
|
|
(92) |
This yields a constant angular momentum throughout a time step. The angular velocities can be approximated from the definition of the angular momentum expressed in the following way:
|
|
(93) |
The key here is not to derive a constant angular velocity from the relation but approximate it using a higher order scheme such as a fourth-order Runge-Kutta.
Normally, the torques and angular momentum are expressed in global coordinates while the inertia tensor is naturally stored in the local body-fixed frame where it is diagonal with constant coefficients. Applying the quaternion tensor rotation described in equation 81.b, the local inertia tensor can be expressed in global coordinates, . Now, the angular velocity can be obtained from equation 93 as:
|
|
(94) |
where is the quaternion defining the transformation between local and global coordinates1. Instead of calculating it directly, a four order Runge-Kutta scheme is applied for the determination of an average angular velocity during the time step:
|
where the values of the transformation quaternions are:
|
Once the average angular velocity during the time step is obtained, the final update predicts the velocity at the new step as:
|
The quaternions expressed in the form (eq. 96.a, 96.b, 96.c and 97.a ) represent incremental rotations that are derived from the application of constant angular velocities during a fraction of time . First, the corresponding rotation angles are calculated:
|
|
(98) |
The unitary vector defining the rotation is and its magnitude . With these two quantities the mapping can be achieved applying equation 79.
Direct explicit integration
Some codes perform a direct forward explicit integration of the equations of motion which is presented here. Eq. 11.3.1 is expressed in a diagonalized local frame where the superscript has been dropped for clarity:
|
Rotation integration benchmark
In the works of Munjiza et al. [92] and Lillie [93] an example which can be analytically solved is run with the presented scheme using rotation matrices instead of quaternions. They showed that the scheme rapidly yields accurate results. Here the same example is reproduced to check the good implementation of the scheme using quaternions and also to show its superiority against a direct explicit integration.
A cylinder of height and radius with a density of is set to freely rotate in the space with an initial angular velocity of during seconds. Since the initial axis of rotation does not coincide with any of the principal directions , , , the resulting rotational motion presents the so called torque free precession which is characterized by a varying rotational velocity and inertia tensor (in global coordinates).
As figures 24 and 25 show, the scheme is much more accurate than the direct integration. Even using a time step ten times smaller for the direct integration than for the , the last scheme performs better. Both methods proved to have convergence to the analytical solution when smaller time steps were used.
|
| Figure 23: Cylinder set-up |
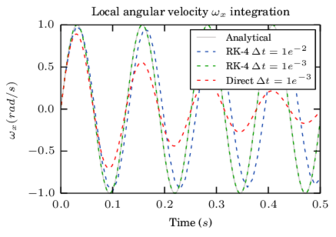
|
| Figure 24: Integration results for local |
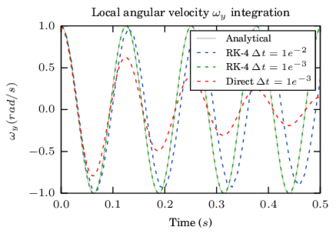
|
| Figure 25: Integration results for local |
We introduced the implementation of the with quaternions in order to have a scheme that is much more efficient in computational cost compared to the original one using rotation matrices and it handles the storage of the rotations with less than half of the memory. Therefore, and taking into account the poor accuracy of the direct approximation, we highly recommend the use of the method for the integration of the rotations both for spherical and non-spherical particles.
(1) It shall be noted that in the case of spherical particle we can skip this transformation since the inertia is diagonal and constant in every reference system.
2.8 Mesh generation
Several industrial processes in which the particle flow is simulated do not require an initial mesh but an inlet and possibly an outlet. However, in a general case, an initial configuration of particles is required and a thus a generation tool has to be employed. Normally, a heterogeneous mesh is desired with a specific granulometry or size distribution. To that end several techniques exist which are based on different principles.
A first family of methods, known as Lily-pound methods [94,95,96] insert particles in random locations checking if intersections occur, if so, a new location is determined. On the other hand, the advancing front techniques [97,98,99] collocate the particles layer by layer starting from the boundaries or the interior of the domain presenting a better control on the desired size distribution. Different modifications exist which attempt to improve the packing of these techniques like in [100].
In the framework of the thesis the GiD sphere mesher developed by Labra [101] has been used for the generation of the sphere meshes. Its principle is based on a first collocation of particles with a later rearrangement technique [102,103] which corrects the inclusions generated being able to achieve dense packings. The reduction of the porosity is solved with the minimization of a distance function with every particle and its neighbours.
Some other meshing techniques rely on a DEM pre-simulation to fill the domain with an inlet or pushing boundaries in a expanded domain where the particles are initially set. These are the techniques used for the generation of meshes based on clusters of spheres in the framework of this thesis.
2.9 Basic DEM flowchart
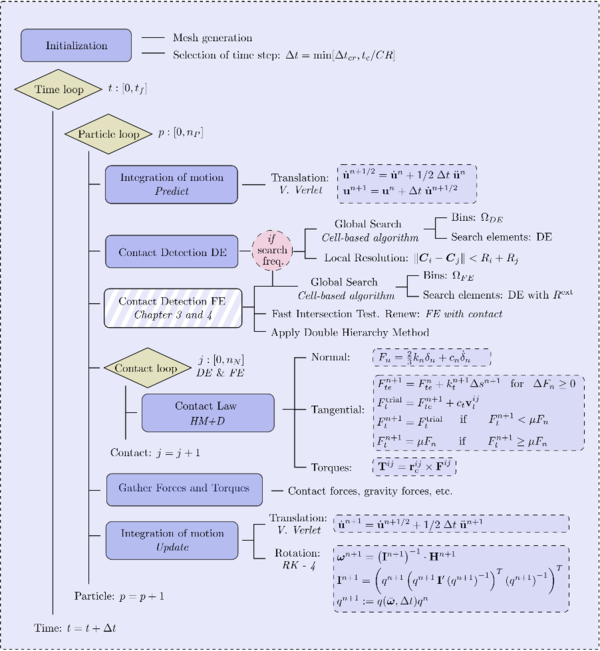
|
| Figure 26: Basic DEM flowchart |
3. The Double Hierarchy () Method for DE-FE contact detection3. The Double Hierarchy (
H
2
{\displaystyle H^{2}}
) Method for DE-FE contact detection
This chapter presents a detailed description of the contact detection between discrete elements and finite elements. First, the state of the art of the existing methods for modelling the contact with boundaries is reviewed as well as the specific DE-FE collision detection methods. Later, the Double Hierarchy Method [104], a novel method developed for the interaction with rigid structures, is thoroughly described including implementation details together with validation examples.
As it will be shown, the literature lacks of a flexible method that computes efficiently the contact between particles and FE, allowing for multi-contact problems and providing continuity of forces in non-smooth contact regions. The objective of this new method is to provide a robust, versatile and efficient procedure which can tackle the above-mentioned problems and be implemented in any DEM code allowing parallel computation.
The method presented here adapts perfectly to the case of spherical particles (including clusters of spheres) contacting triangles or quadrilaterals belonging to the rigid boundaries included in a DEM simulation. The discussion on how to upgrade this method to the case of deformable structures will be presented in chapter 4.
3.1 State of the art
Several solutions have been reported for the inclusion of boundaries to the discrete element method. Among the simplest ones is the glued-sphere approach [105], which approximates any complex geometry (i.e. a rigid body or boundary surface) by a collection of spherical particles so it retains the simplicity of particle-to-particle contact interaction. This approach, however, is geometrically inaccurate and computationally intensive due to the introduction of an excessive number of particles. A second simple approach (used in some numerical codes, e.g., ABAQUS) is to define the boundaries as analytical surfaces. This approach is computationally inexpensive, but it can only be applied in certain specific scenarios, where the use of infinite surfaces does not disturb the calculation. A more complex approach which combines accuracy and versatility is to resolve the contact of particles (spheres typically) with a finite element boundary mesh. These methods take into account the possibility of contact with the primitives of the FE mesh surface, i.e., facet, edge or vertex contact. The term FE will be used in this dissertation when referring to the geometry elements (triangles, quadrilaterals, etc.) which are used to discretize the boundaries even if they are not used for the calculation of a deformable solid.
Horner et al. [14] and Kremmer and Favier [80] developed the first hierarchical contact resolution algorithms for contact problems between spherical particles and triangular elements, while Zang et al. [106] proposed similar approaches accounting for quadrilateral facets. Dang and Meguid [27] upgraded the method introducing a numerical correction to improve smoothness and stability. Su et al. [107] developed a complex algorithm involving polygonal facets under the name of RIGID which includes an elimination procedure to resolve the contact in different non-smooth contact situations. This approach, however, does not consider contact with entities of different surfaces at the same time (multiple contacts) leading to an inaccurate contact interaction. The upgraded RIGID-II method presented later by Su et al. [108] and also the method proposed by Hu et al. [109] account for the multiple contact situations, but they have a complex elimination procedure with many different contact scenarios to distinguish, which is difficult to code in practice. Chen et al. [110] presented a simple and accurate algorithm which covers many situations. Their elimination procedure, however, requires a special database which strongly limits the parallel computation.
In the framework of this monograph, the Double Hierarchy Method () [104], has been developed. It consists in a simple contact algorithm based on the FE boundary approach. It is specially designed to resolve efficiently the intersection of spheres with triangles and planar quadrilaterals but it can also work fine with any other higher order planar convex polyhedra. A two layer hierarchy is applied upgrading the classical hierarchy method presented by Horner [14]; namely hierarchy on contact type followed by hierarchy on distance. The first one, classifies the type of contact (facet, edge or vertex) for every contacting neighbour in a hierarchical way, while the distance-based hierarchy determines which of the contacts found are valid or relevant and which ones have to be removed.
Industrial applications may involve a large number of particles and also a fine definition of the boundaries which, using boundary FE, would turn into large number of conditions to check. The selected algorithm works efficiently in parallel computations as will be shown in chapter 6. This is a clear advantage over the above-mentioned publications which algorithms are mostly serial. Exceptions are Nakashima [23] whose method is presumably parallelizable and Zang [106] and Su [108] which remark the importance of the future parallelization of their algorithms.
Summarizing, the contact search framework presented is designed to satisfy the following requirements:
- Include poly-disperse elements for both: FEs and DEs.
- Allow different FE geometries and primitives (triangle, quadrilateral, polygon).
- Ensure contact continuity in non-smooth regions (edges and vertices).
- Resolve multiple contacts and contact with different entities simultaneously.
- Need low memory storage.
- Be simple, fast and accurate.
- Be fully parallelizable.
Table 5 summarizes the strengths and drawbacks of the reviewed contact detection methods. Methods which have a elimination procedure to remove the invalid contacts (RIGID-II [108], Hu et al. [109], Chen et al. [110] and ) are the most accurate. They treat the cases with large indentations (relative to the FE size) and provide a solution to the contact continuity in non-smooth boundary regions. These methods have, however, some limitations due to the fact that the real deformed geometry of the sphere is not represented in the DEM. Due to this fact, error in the contact detection in concave transitions is common for all these methods (including the ). This is analysed in section 3.5.
| Glued | Anal. | Hierarchy | RIGID | RIGID-II | Hu | Chen | ||
| [105] | [14,80,106,27] | [107] | [108] | [109] | [110] | [104] | ||
| Wide size rate DEs/FEs | - | - | ✓ | ✓ | ✓ | ✓ | ||
| Contact elem. typologies | - | ✓ | ✓ | ✓ | ✓ | |||
| Boundary shape variety | ✓ | ✓ | ✓ | ✓ | ✓ | ✓ | ✓ | |
| Multi-contact | ✓ | - | ✓ | ✓ | ✓ | ✓ | ✓ | |
| Simple | ✓ | ✓ | ✓ | ✓ | ✓ | |||
| Efficient | ✓ | ✓ | ✓ | ✓ | ||||
| Accurate | ✓ | ✓ | ✓ | ✓ | ||||
| Low storage | ✓ | ✓ | ✓ | ✓ | ||||
| Upgradable to CSM | ✓ | ✓ | ✓ | ✓ | ✓ | ✓ | ||
| Large indentation | ✓ | ✓ | ✓ | ✓ | ||||
| Contact continuity | - | ✓ | ✓ | ✓ | ✓ | ✓ |
Symbol (✓) implies that the method satisfies the property while () indicates that the method does not satisfy the property. Symbol (-) denotes that the property does not apply to that method and (✓) means that, the method satisfies the property upon some limitations.
3.2 DE-FE contact detection algorithm
The strategy of dividing the search into global and local stages also applies to the DE-FE collision detection. In the same way, the methods described in section 2.2 regarding the global search can be also used here. The cell-based algorithm presented in [40] has been selected for the global search due to its simplicity and the possibility to be parallelized.
As it has been appointed in section 2.2, the most expensive part of the collision detection lies on the local resolution which can reach values over 75 percent of the simulation when non-spherical elements are involved [14]. To that end, a specialized algorithm has been developed for the case of collision between spheres (particles) and triangles or quadrilaterals (boundary elements) which is particularly efficient. Moreover, a further split of the Local Contact Resolution is performed: a) A Fast Intersection Test, b) Full characterization of valid contacts. Figure 29 shows the different stages of the search.
3.2.1 Global Search algorithm
The main purpose of the Global Search is to determine through a fast rough search which are the potential neighbours for every element in the domain. A cell-based algorithm [40] is chosen here which has been parallelized in OMP and adapted for the DE-FE search. The FE domain is selected to build the search bins taking advantage of the fact that usually the spatial distribution of the FEs is more regular and in some cases fixed. As an additional feature, the Search Bins is built dynamically considering only the elements belonging to the intersection of the bounding boxes of the DEs and FEs domains, and . Fig. 27a shows how the intersection evolves as long as the simulation goes on. On the other hand, only the DEs inside the intersection domain () will look for their neighbours. This reduces significantly the contact pairs to be checked afterwards and, therefore, the global search performance is increased.
In the global search, every FE and DE has an associated Bounding Box () that is used to tag the position of the elements on the Search Bins and rapidly check for potential neighbours. This is done using a hash table structure as depicted in fig. 27d which relates each cell to the bounding box that fall into it. Rectangular hexahedral bounding boxes encompassing both types of elements are chosen here.
The steps needed to perform the neighbouring search at the Global Search level are:
- Set the bounding box of the intersection of domains (fig. 27a).
- Set the bounding box for every (fig. 27b).
- Generate the Search Bins based on the size and position of the bounding boxes of the (fig. 27c).
- Place every FE in the Search Bins (based on their associated bounding box coordinates) and build the hash table (fig. 27d).
- Set the bounding box for every (fig. 27e).
- For every DE particle obtain the FE potential neighbours in the Search Bins. Check the intersection of the with the of the FEs lying in the surrounding cells (fig. 27f).
- Apply the Local Resolution Method to the pairs with intersecting bounding boxes (fig. 27g).
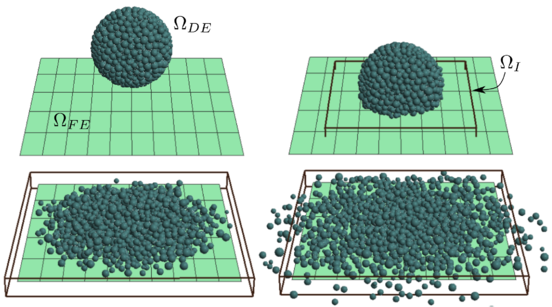
|

|
| (a) Evolution of | (b) |
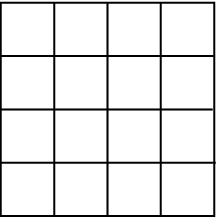
|
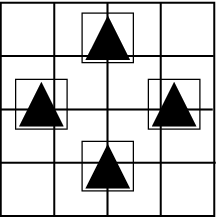
|
| (c) Bins over FEs | (d) Hash table |

|
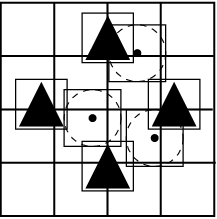
|
| (e) | (f) Intersection cells |
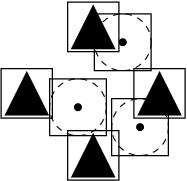
| |
| (g) Local Contact Resolution | |
| Figure 27: Global search stages | |
3.2.2 Local Contact Resolution
Normally a full characterization takes place after the global search and determines completely the contact status of each potential contact pair. In this monograph a split is suggested:
- Fast Intersection Test: First, the actual contacting pairs are determined. This has to be fast because there are many FE potential neighbours in the adjacent cells to be checked. Therefore, all detailed contact computations such as determining the type of contact, the contact point, normal direction, etc. are skipped. On the other hand, a good accuracy in the determination of the contacting neighbours is needed. It should be avoided to fill the contact pool with FE which do not have contact and have to be eliminated or treated subsequently. This procedure is described in detail in section 3.3.
- Full contact characterization: A more expensive check takes place which determines the type of contact of every neighbour, which are the relevant contacts and which ones have to be removed in order to avoid instabilities or redundant contact evaluations in non-smooth regions and contact transitions. All the detailed contact characteristics are fully determined at this stage for each one of the valid neighbouring entities.
The split gives the code higher modularity, i.e. any other contact characterization can be applied for the contacting entities. Moreover, in the in-house code Kratos, the split yields also higher efficiency (see table 24 in chapter 6). This is due to the fact that the full characterization is a much more expensive procedure than the simple Fast Intersection Test, and at the same time, the first group of FE potential neighbours is very large in comparison to the group of FE with contact.
In order to demonstrate this, an example of a horizontal mixer with approximately DEs and FEs has been run for second, i.e. turns of the helical blades (full description in section 6.2.2). The cumulative counts of the following quantities is computed:
- FE Potential neighbours: The number of times the Fast Intersection Test (section 3.3) is called (number of FE potential neighbours to be checked) averaged over the number of particles.
- FE with contact: The average number of FE per particle that yield a positive result (have intersection with sphere) in the Fast Intersection Test.
- Entity with valid contact: The average number of relevant entities per particle determined by the Method.
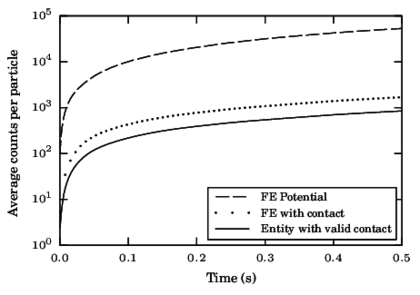
|
| Figure 28: Counts of FE checks in different stages |
Fig. 28 presents the results which show that the number of FE Potential Neighbours to be treated is large compared to the FE with actual contact, a ratio of . Additionally, as it will be shown in chapter 6, the improvement in performance showed in Table 24 it can be concluded that it is a good choice to perform the split which additionally brings modularity to the code.
Figure 29 summarizes the stages in which the neighbour finding is divided.
|
| Figure 29: Neighbour finding scheme |
3.3 Fast Intersection Test
An efficient algorithm designed to determine the intersection of spheres contacting triangles or planar quadrilaterals is described here. Some of the procedures existing in the computer graphics bibliography [111,112] have been adapted to the case where the facet contact (inside of the FE) occurs in a substantial higher frequency compared to edge and vertex geometrical contact types. See [109] where the type of contact frequency (facet, edge, vertex) is determined for different number of particles and relative sizes.
The test works for any planar convex polygons of N sides. For every DE we loop over the FE potential neighbours provided by Global Neighbour Searching algorithm. Every FE with valid contact is stored in an array for every DE.
3.3.1 Intersection test with the plane containing the FE
The first check is to determine whether the particle intersects the plane formed by the planar finite element . This is represented in fig. 30.
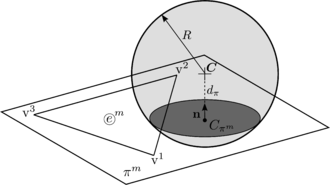
|
| Figure 30: Intersection of a DE particle with a plane formed by a plane FE |
The outward-pointing normal of the plane can be calculated with the cross product of any pair of edges taken counter-clockwise. This can be written in the following form, using the permutation tensor on two edges formed, for example, by the three consecutive vertices , , :
|
|
(100) |
which has to be normalized to unit length to obtain the normal to the plane :
|
|
(101) |
In the case of a zero-thickness wall which can have contact at both sides of the FE, the sense of the normal will be set such that points outwards to each particle centre. Once the normal is defined, the distance of the DE centre to the plane can be determined taking any known point of the plane, namely a vertex , as
|
|
(102) |
The distance should be compared to the radius . If and only if , the contact between the sphere and the FE is possible. In this case, we proceed with the next checks. Otherwise, the contact with the current FE is discarded and we will jump to check the next potential FE neighbour.
3.3.2 Inside-Outside test
The purpose of this test is to determine whether the contact is inside the FE (facet contact) or outside (edge, vertex or no contact). It applies to the cases which . A modification of the Inside-Outside status check [113] is used. The projection of the centre of a DE onto the plane formed by an element with normal can be calculated as
|
|
(103) |
The next step is to evaluate whether the projection lies inside or outside the FE with respect to every edge formed with the vertices and () (See fig. 31). For every edge we compute the cross product sign as
|
|
(104) |
|
|
(105) |
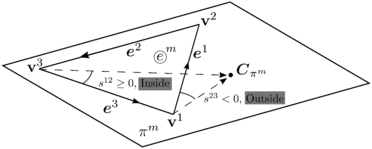
|
| Figure 31: Inside-Outside check of the projection point edge by edge |
3.3.3 Intersection test with an edge
This test is needed for the cases where but the Inside-Outside test failed. Here we use the idea that the edge contact can not happen to be on the edges where the Inside-Outside check yield a Inside status. Therefore, it is recommendable to test the edges with starting from the vertex which failed in the previous test and skipping the previous ones (Note that the edge check is the most expensive one). This approach has also been used by Chen et al. [110].
First, the shortest distance between the edge and the particle centre should be calculated and compared to the radius . The distance is calculated finding out the contact point , as
|
|
(106) |
|
|
(107) |
|
|
(108) |
where is the distance resulting from the projection of the vector connecting the centre and the vertex onto the edge :
|
|
(109) |
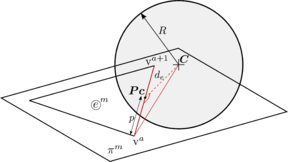
|
| Figure 32: Intersection of a DE particle with an edge |
If the contact with this edge is not possible and the check starts again with the next edge . Otherwise, if we determine where the lies, along the edge, with the help of , defined as:
|
|
(110) |
The case of implies edge contact. Therefore contact is found and the Fast Intersection Test finishes yielding a positive result. The FE neighbour is saved to the current DE and the algorithm proceeds to check the next FE potential neighbour.
Otherwise, if this test failed for the current edge , the connecting vertices ( and ) have to be evaluated. A value of indicates that the check has to be done with ; on the other hand, for the vertex to be tested is .
3.3.4 Intersection test with a vertex
For the vertex under consideration the squared distance to the DE centre is calculated:
|
|
(111) |
If , then the Fast Intersection Test yields a positive result and the test finishes. Otherwise, the test moves on with the next edge and its subsequent vertices.
We recall that the purpose of this Fast Intersection Test is merely to determine whether there is intersection or not between the DE sphere and the FE planar convex polygon. An intersection found with a vertex or edge does not ensure that this is the actual contact point. In this case, however, we omit at this stage further checks with subsequent edges or vertices where the contact point can happen to be closer.
3.3.5 Fast Intersection Test algorithm
| Parallel loop over all DE, check FE potential neighbours. |
| Intersection with plane containing the FE |
| Calculate normal outwards , . |
| Calculate distance to plane . |
| if( ): Go to (). |
| else: Calculate and Go to . |
| Inside-Outside test |
| Initialize and Inside-Outside flag = In. |
| loop over every edge with . |
| calculate . |
| if(): Inside-Outside = Out. |
| Break loop. Save . Go to . |
| else(): Continue with next edge. |
| if(Inside-Outside flag == In): Go to (). |
| else: Go to . |
| Intersection with Edge and Vertex |
| loop over every edge with . |
| Calculate projection: . |
| Calculate the contact point: . |
| Calculate distance to edge . |
| if(): Continue with next edge. |
| else: Calculate . |
| if( ): Go to (). |
| if(): . |
| if(): Go to (). |
| else: check next edge. |
| if(): . |
| if(): Go to (). |
| else: check next edge. |
| Go to (). |
| Contact Found () |
| : Store as FE with contact and Continue. |
| : Stop! No contact. |
The presented algorithm applies to any planar convex polygons of N sides.
3.4 The Double Hierarchy Method
The application of constitutive contact laws such as the Hertz-Mindlin (section 2.5.2) requires that the contact surfaces are smooth and present a unique normal at each point. In the DE-FE contact, usually, the original geometry presents regions where this requirement is not fulfilled. Moreover, even the smooth surfaces loose this feature when they are discretized by means of FEs. In these situations a special treatment of the non-smooth regions should be applied under the requirement of some conditions to ensure reasonable results. The following conditions were also analysed in the work by Wellmann [4]:
- The contact constitutive model will be applied normally when the contact is on the facet and will vanish when there is no interpenetration between the elements.
- There should be no discontinuities in the contact force when a contact point evolves from facet to edge and the other way round in order to avoid non-physical results and numerical instabilities.
- The energy should be conserved in an elastic frictionless impact.
The use of the present contact determination algorithm helps the selected contact model ensuring these objectives as it will be shown through the validation examples in section 3.6.
This procedure is applied to the list of FE with contact that the Fast Intersection Test has generated for every particle. In the case of no previous fast check this operation could be directly applied as a Local Contact Resolution with the disadvantage that many potential FE have to be tested. It is developed in two different stages:
- Contact Type Hierarchy (section 3.4.1): where for every FE with contact the entity with higher priority is determined.
- Distance Hierarchy (section 3.4.2): the elimination procedure takes place determining which contact points have distance priority over others which are redundant or false and have to be eliminated.
3.4.1 Contact Type Hierarchy
The basis of this procedure is that each primitive has hierarchy over its sub-entities, i.e., a facet of a -sides polygon has hierarchy over the edges that compose it. In turn each of the edges has hierarchy over its two vertices . Figure 33a outlines the Contact Hierarchy for a triangle. The algorithm is organized as a sequence of three entity-checking levels. If a particle is in contact with the facet of a FE the contact search over its edges and vertices, which are in a lower hierarchy level, is discarded (see fig. 33). Otherwise, if contact with the FE facet does not exist, the contact check should continue over the sub-entities. Similarly, at the edges level, any contact with an edge cancels out further contact checks for those two vertices belonging to that edge. It does not cancel out, however, the contact check with the other edges because they are at the same hierarchy level. Table 7 in section 3.4.1 displays the pseudocode of the contact Type detection.
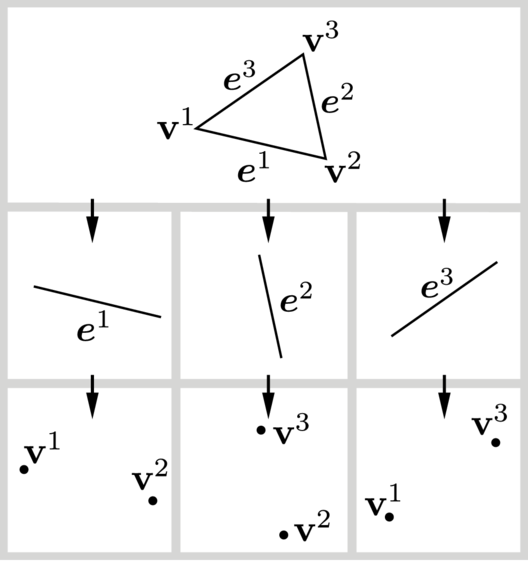
|
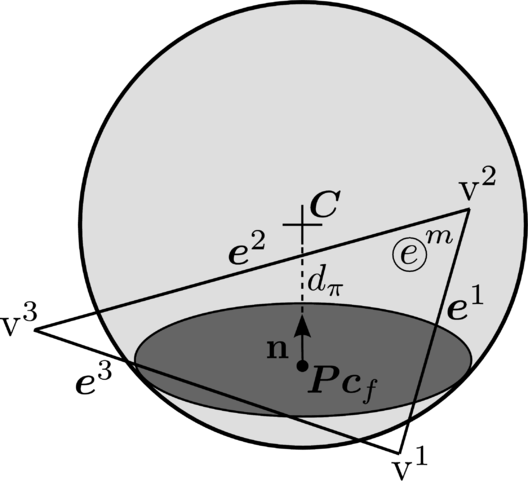
|
| (a) Contact Type Hierarchy for a triangle | (b) Contact with facet. Edges and vertices are discarded from contact check |
| Figure 33 | |
Every time a new contact entity is determined by the Contact Type Hierarchy, the Distance Hierarchy (section 3.4.2) takes place immediately after. The Distance Hierarchy will determine if the new contacting entity found is redundant or non-valid, if it cancels out the previously found ones or if it is a new valid contacting entity to be considered for the DE.
For any valid contact entity the geometrical contact characteristics that will be stored are:
- The contact Point .
- The FE nodal weights.
- The contact type: Facet, Edge or Vertex.
Note that some of the geometrical characteristics such as the distance, the normal vector or the contact local axis can be recalculated later when the contact constitutive law is applied and, thus, it is optional to store them here at this stage.
Facet level
The check proceeds in the same way as explained in section 3.3, checking for the intersection of the DE with the plane formed by the FE (section 3.3.1). If the Fast Intersection Test has been performed previously is necessarily true since contact has been found for this FE. Otherwise, if no previous Fast Intersection Test has been carried out, this condition applies now to discard FE without contact.
Next, the Inside-Outside test (section 3.3.2) has to be performed. This test will tell us whether the projection (equation 103) lies on the facet (inside the FE) or it is outside, contacting with the edges or vertices. Fig. 34 shows two examples where the projection is inside and outside the FE facet.

|

|
| (a) inside the facet | (b) outside the facet |
| Figure 34: Example of projection inside and outside the FE facet | |
The values of the cross product sign obtained from equation 105 for every edge are used to obtain the weights of the shape function at the contact point. The areas needed for the calculation are simply one half of the cross product sign: .
The weights of the nodal shape functions on the contact point are then calculated. For a triangle:
|
|
(112) |
For 4-nodded convex quadrilaterals (fig. 35 the following expression can be applied as introduced in Zhong [114]):

|
| Figure 35: Triangular areas for the calculation of shape function values in a planar convex quadrilateral |
|
|
(113) |
Note that if any of the cross product signs evaluated with respect to the edge yields a negative value the check stops since the projection of the centre lies outside. The current edge index is stored and it will be the first to be checked as it has been appointed in section 3.3.3.
If the projection (equation 103) lies inside the facet, it becomes the contact point . Due to the highest hierarchy level of the facet, the Contact Type Hierarchy finishes here for this FE. The Distance Hierarchy is now called and all the necessary contact characteristics are saved.
Edge level
Here the edge check (section 3.3.3) has to be applied for every edge with in a -sided FE starting with the first edge that yielded an outside status at the Facet level.
When contact with the edge is found the check at the lower level for the vertices associated to it, and , is discarded (fig. 17.1.2). The contact check with the following edges can not be discarded, however, since they are at the same hierarchy level in terms of Contact Type. The Distance Hierarchy will determine the validity of the new contact and eliminate or substitute previous ones. This is a key difference with the Fast Intersection Test where the check automatically stops once a contact entity is found.
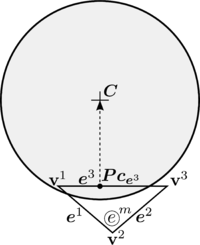
|

|
| (a) Contact with edge. Vertices belonging to that edge are discarded | (b) Weights for an edge contact in a triangle |
The nodal weights can be obtained from the parameter (equation 110) at the edge . Fig. 17.1.2 shows graphically how is determined,
|
|
(114) |
Equation 114 gives the values at the nodes connected to the edge . The rest of nodes have a null value for its shape functions. If the edge contact check failed but the distance (equation 106) is lower than the radius () the closest vertex (based on the calculation of ) will be checked. The check will proceed in any case (found edge, found vertex or none) with the next edges.
Vertex level
The vertex check is described in section 3.3.4. Fig. 36 illustrates why the edge has hierarchy over its two vertices but not over the non-contiguous one . The shape function weights are for the found vertex and for the rest.
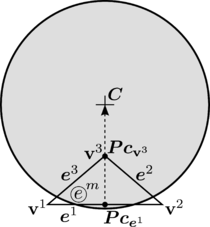
|
| Figure 36: Contact with edge and vertex. When contact exists with edge it can also exist with vertex |
As usual the Distance Hierarchy is called after the contact is detected and, if the contact is valid, its characteristics are stored.
Contact Type Hierarchy scheme
The scheme of Table 7 assumes that the Fast Intersection Test has taken place already. For every DE the first loop is over the found neighbours. The check can be performed in parallel for every particle in the model.
| loop over every FE with contact neighbour . |
| Facet level |
| Project the centre onto the plane (equation 103). |
| Perform the Inside-Outside test (section 3.3.2) |
| if Contact: |
| Go to Distance Hierarchy (Table 8) and Stop! |
| else: Go to with index . |
| Edge level |
| loop over every edge with . |
| Perform the Edge Check (section 3.3.3). |
| if Contact Go to Distance Hierarchy (Table 8). |
| else if ( and ) Go to (3) with . |
| else if ( and ) Go to (3) with . |
| Continue with the next edge. |
| Vertex level |
| Perform Vertex check (section 3.3.4). |
| if Contact Go to Distance Hierarchy (Table 8). |
| Go To Edge level and check next edge. |
3.4.2 Distance Hierarchy
A spherical particle can be, in general, in contact with many different FE entities. Sometimes these contacts are result of the penetrations introduced by the penalty method and some contacts give redundant or invalid information and, therefore, should be eliminated. This is the scenario shown in fig. 37 where contact with elements , and is detected. In a collision of the sphere normal to the plane, the force applied by the plane surface to the sphere must have also a normal direction and a magnitude only given by the penetrations and independent of the position and on the plane. Therefore the contact force coming from the edges of elements and should not be taken into account. This is solved by the distance-based hierarchy which is an elimination procedure that takes place every time a new contact entity is found at the Contact Type Hierarchy.
The procedure basically compares the contact vectors against their projections one another. The new contact vector is projected onto the previously found contact vector and vice versa. The following expressions are obtained:
|
|
(115) |
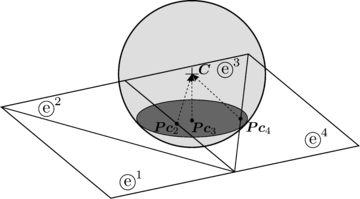
|
| Figure 37: Contact between a DE and a FE mesh whose elements are smaller than the indentation |
The contact check is performed using the algorithm presented in Table 8:
| Given a new found contact by the Contact Type Hierarchy: |
| loop over every existing contact |
| Project on : |
| Project on : |
| if ( ): is an invalid contact. |
| Go to (2) () and break loop. |
| else if ( ): is an invalid contact. |
| Discard ! Continue loop. |
| Go to (2) (). |
| Valid contact () |
| if ( ): is valid contact! Save contact details. |
| else ( ): is an invalid contact! Discard !. |
Figures 38 and 39 show an example of how the elimination procedure is performed for two different possible cases. On the left side all the found contact vectors are represented. A graphical interpretation of the projections is also given for the first example. On the right side only the final relevant contact vectors, that the Distance Hierarchy yields, are shown.
In the first situation (fig. 38), no contact with edges of elements and is taken into account, since their projections, and , over the facet contact vector of element have the same module as the contact vector itself.
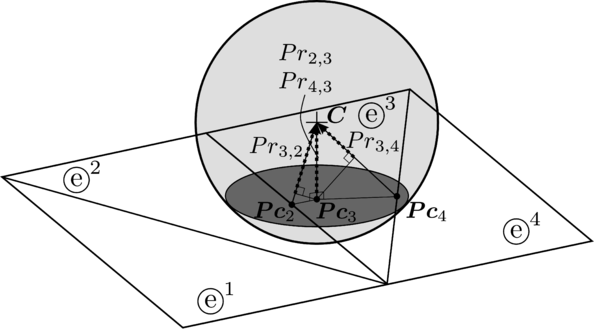
|
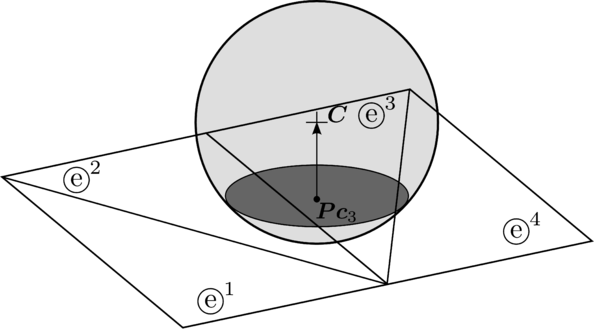
|
| (a) Found contact points and vectors | (b) Relevant contact vectors |
| Figure 38: Elimination procedure in situation 1 | |
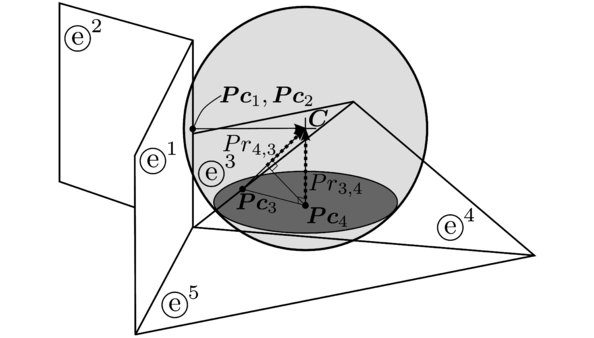
|
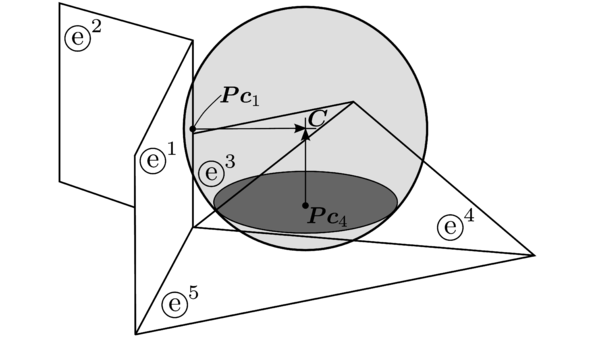
|
| (a) Found contact points and vectors | (b) Relevant contact vectors |
| Figure 39: Elimination procedure in situation 2 | |
In the second situation (fig. 39), the sphere has contact with the facet of element , the edge of element and the shared edge of elements and which will be appearing as two different contact vectors and given by the Contact Type Hierarchy stage. These vectors do not appear directly in the figures but they are calculated by and respectively. First, note that either contact with or will be arbitrarily discarded by the elimination procedure since they are mathematically the same vector. Let us assume the is kept and discarded. On the other hand, the projection of the contact vector over the contact vector discards contact with element . Finally, contacts with element and do not discard each other since their projections one another have a value of and (they form a 90 degrees angle) and therefore are smaller than the length of the contact vectors. Hence both contacts are taken into account, as it is expected.
The main advantage of this method lies in its wide generality. It works fine for most of the traditional conflictive situations where multi-contacts and FE transitions are present. It is consistent and so the order in which the neighbours have been found and stored does not affect the final result. The tests carried out in the validation (section 3.6) show that the force vector always has the appropriate direction.
3.4.3 Note on types of FE geometries
Taking advantage of the generality of the method, the full algorithm can be applied directly to any -sided planar convex polygonal FE. The weights can be calculated with the barycentric coordinates [115,116] as:
|
|
(116) |
The definition of and is shown in fig. 40.

|
| Figure 40: Angles formed with the vector and each of the two edges connected to node in a polygon |
Contact surfaces with non-planar quadrilaterals or other curved elements are not on the scope of this paper. Generally it involves a minimization problem [117]. However, Chen [110] proposes an averaging of the normal and a relaxed contact criterion.
3.4.4 Note on types of DE geometries
As discussed in section 2.7, industrial applications demand the use of more accurate strategies to model the particles rather than using spheres. The most popular methods are the superquadrics [4], level set functions [87], or cluster of spheres [88]. The choice of modelling generic particles with the sphere clustering technique provides a solution with a good ratio between accuracy and computational cost. This approach adapts perfectly to the presented algorithm and, therefore, yields a fast contact detection which is fully parallelizable.
3.5 Method limitations
One of the major limitations or source of errors of the method is the inherent lack of accuracy that a FE mesh discretization introduces to a model. This has an effect in the error detection and therefore globally affects on the overall apparent friction. Details of this can be found in [118]; in this section only the local effects in terms of normal and tangential forces are analysed.
3.5.1 Normal force in concave transitions
A limitation of this method which is common to the revised penalty-based contact algorithms occurs when a DE contacts with a slightly non-convex surface. Here the error introduced by the method is analysed and quantified for normal forces in the case of spherical DE in concave transitions.
The penalty method introduces an indentation which accounts for the local elastic deformation of the discrete element during a contact event and allows the imposition of the contact condition in a weak form. The use of rigid geometries with non-physical indentation introduces error in the contact detection. Constitutive laws such as Hertz-Mindlin present a limitation in terms of small deformation in order to work fine. This rule does not apply, however, to non-smooth regions where the basic assumptions are not met and contact detection errors arise.
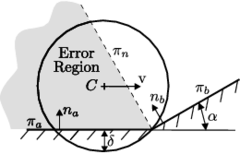
|

|
| (a) Error region | (b) Contact with 2 planes |
| Figure 41: Error emerging in concave transitions | |
A sphere moves horizontally in a plane until it reaches a transition with other plane which forms an acute angle with the plane (fig. 41a). In this situation a region can be defined between the current contact plane and the plane formed by the common edge and the normal of the second plane . Whenever the sphere centre is in that region a discontinuity in forces will occur. The contact with plane is detected only when the centre has a normal projection onto the plane forming a tangential contact. Fig. 41b shows that when the new contact is detected, some indentation is existing already and, therefore, the new contact force value introduces a discontinuity.
From the geometrical relations, the error can be quantified as a ratio of the absolute value of the new force over the absolute value of the current force . This value can be expressed in function of the change of angle and indentation ratio relative to the sphere radius :
|
|
(117) |
Using the geometrical relationships and setting as the relative indentation measure, the following expression is obtained:
|
|
(118) |
Finally the following expression is found:
|
|
(119) |
The solution is plotted for the two cases (linear and Hertzian) for different change of angle and different indentation ratio.
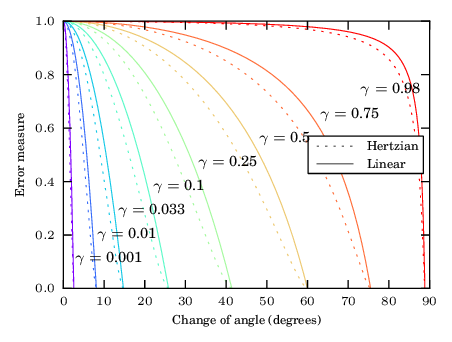
|
| Figure 42: Values of measure error in function of change of angle and indentation ratio |
Fig. 42 shows that for an indentation of of the radius () and a small change in the angle of about degrees no error is produced. For an indentation of however, the error measure reaches a value of for the Hertzian case ( for the linear case) which turns into a sudden force of magnitude in the direction of . The error tends to as the angle change tends to degrees and does not occur for obtuse angles. On the other hand, the lower the change of angle is, the greater the error is. It is bounded to of error for the extreme case of coplanar transition. Luckily this very frequent case is considered by the Distance Hierarchy (section 3.4.2) where a tolerance is used to detect the coplanar cases. Note that the error depends only on geometrical conditions and the indentation ratio relative to the sphere and not to the boundary FE mesh quality, the dependence of which has been solved using the Double Hierarchy Method.
3.5.2 Tangential force across elements
As introduced in section 2.5, the tangential force is applied by means of an incremental scheme which requires to keep track of the forces that the particle has with each neighbour. In the DE/DE contact it is enough to transfer these forces from the old to the new neighbours according to the particles' identifier and properly rotating them from the old axes to the new local contact axes. The problem arises when a particle moves across two FE boundary elements. The historical tangential force would reset to zero since the new element in contact has a new identifier and can be considered a new contact. This happens even if the contact detection is performed every time step.
Most of the common applications won't yield large errors in this sense since the tangential forces is normally not developing up to high values. Particle rotation and damping makes the tangential force contribution small in comparison to the normal forces. The cases with larger error are the ones regarding sliding events without rolling where the tangential force is kept at its maximum (generally the Coulomb friction value). In this situation the error can be measured in terms of the missing work in a force-displacement diagram as the one showed in fig. 120 which corresponds to a linear contact law [2,66] for normal and tangential directions.
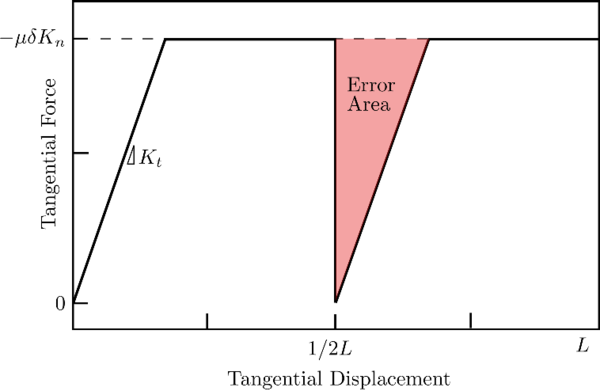
|
| Figure 43: Schematic force displacement diagram with the discontinuity introduced by an element transition during a sliding event using a linear contact law |
In average, a particle with linear stiffness values and sliding across a transition of finite elements of characteristic length with a relative indentation will have the following error in the work done by the tangential force:
|
|
(120) |
As an example, using the linear model with a ratio of (suggested in Shäfer [66]), with a particle-structure friction coefficient the error in the integral of the tangential forces over the displacement has a value of . For a large indentation of of the characteristic size of the FE, the error is only of approximately .
This error gets greater however, for the cases where the search frequency is low since the forces may remain at zero until the new search is performed. The correct track of the contact forces and the detection of new contacts are solved using a special implementation which is described below.
Continuity of tangential forces in non-smooth transitions
The proposed solution consists in achieving the following: in a neighbouring search event, for every new neighbour with a contact point at time find the closest contact point at the previous time step associated to the old neighbour such that the distance for every old neighbour is minimum. Additionally, this distance needs to be below a certain bound to avoid associations of new neighbours coming from non adjacent regions. This can be calculated as follows:
|
|
(121) |
where is the relative tangential displacement at the contact point between the particle and finite element .
This procedure requires the detection of the new FEs in the moment where the transition takes place. It can obviously be achieved if the contact detection is performed every step but this is not an efficient solution. Alternatively, an extended search can be used at several time steps together with a local renewal of neighbours every time step which becomes a much more efficient solution. This is detailed as part of the implementation of the distributed method in Appendix B.
Example: Particle with imposed trajectory sliding over a surface
A sphere without rotation is given an imposed trajectory to analyse how is the evolution of the tangential force when sliding along an irregular surface with concave and convex geometrical parts and inter-element transitions (fig. 44). The paths correspond to an equidistant offset of to the underling geometry.

|
| Figure 44: Point of contact moving across two boundary FE |
The simulation was run using a linear contact model (section 2.5.1) with an exaggerated particle-wall friction of () and an extremely large indentation of nearly in order to make the error in the determination of the tangential force visible. The tangential force is expected to rapidly increase until the sliding occurs, keeping the force steady at value determined by the regularized Coloumb's friction model. The rest of parameters are described in Table 9.
| Material properties | Calculation parameters | ||
| Radius () | Contact Law | Linear | |
| Friction coeff. DE-FE | 5 | Time step () | |
| Young's modulus () | Neighbour search freq. | ||
| Poisson's ratio | 0.2 | Simulation time (s) | |
| Indentation Ratio | 28.6% |
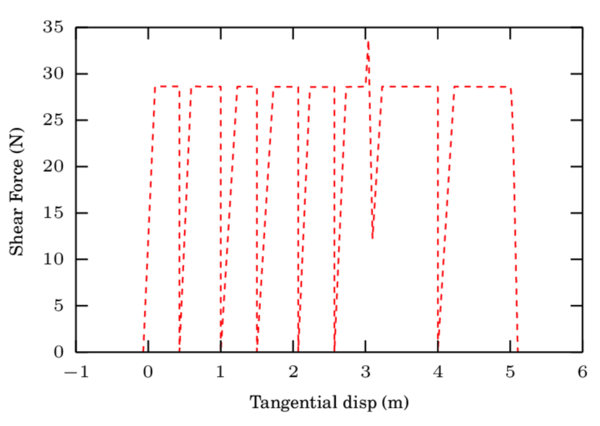
|
| Figure 45: Shear force of an imposed movement with inter-element and non-smooth transitions with the basic implementation |
Figure 45 shows how every time the particle crosses over a non-smooth transition, the force resets to zero when a contact algorithm is applied without special treatment of the tangential forces. This case was run with a search frequency of 1, i.e. performing a search every time step.
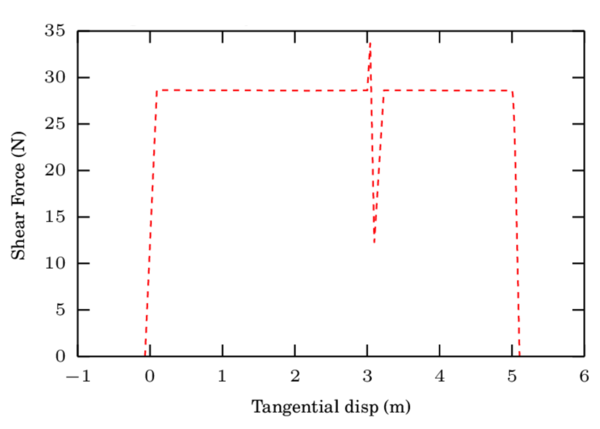
|
| Figure 46: Shear force of an imposed movement with inter-element and non-smooth transitions using the special implementation |
Figure 46 shows how the special implementation described above provides continuity in the geometrically non-smooth regions as well as across element transitions. The use of the previously explained strategy allows the detection of new incoming contacts even if the global search is performed in a large time spacing; in this case it was performed every 100 time steps. The irregularity present in the plot corresponds to the concave transition where the particle has briefly two contacts: a new one which starts to develop and the old one which is about to finish. The numerical results present the expected behaviour.
3.6 Validation benchmarks
In this section, several examples are carried out to test the performance of the Double Hierarchy method in different aspects. The following tests correspond to academical examples defined in critical situations to validate the contact calculation procedure. All benchmarks have been carried out using a Hertzian contact law (section 2.5.2).
3.6.1 Facet, edge and vertex contact
These first three benchmarks are represented by a sphere, which has low stiffness in order to achieve large indentation, contacting three different boundaries meshed with triangles. In every case the sphere falls from the same height vertically and perpendicular to the contact entity which is respectively a facet, an edge or a vertex. Since there is no damping applied, the energy should be conserved and the ball must return to the initial position after the rebound. The sphere is expected to follow a vertical trajectory with identical results for the three cases. Fig. 47 shows the benchmarks display and table 47 the simulation parameters.

|
| Figure 47: Benchmark layout |
| Material properties | Calculation parameters | ||
| Radius () | Initial vel. (DE) () | ||
| Density () | Gravity () | ||
| Friction coeff. DE-FE | Time step () | ||
| Young's modulus () | Neighbour search freq. | ||
| Poisson's ratio |
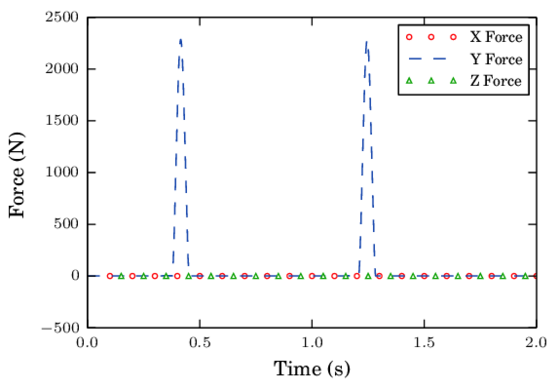
|
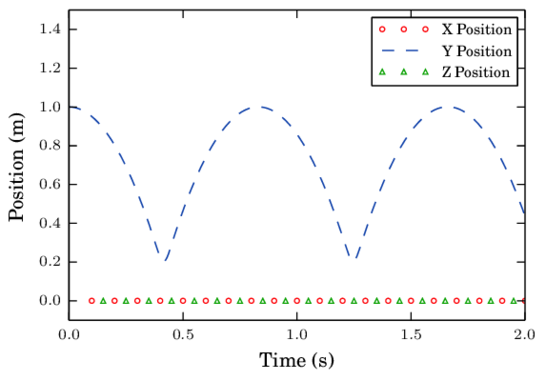
|
| (a) Force exerted by the FEs to the DE | (b) Position of the centre of the DE |
| Figure 48: Benchmark results for the facet edge and vertex contact | |
Graph in fig. 48a shows that, although the indentation is greater than the 30% of the DE radius leading to multiple contacts with all kind of entities, the force is applied only in the vertical direction (Y direction). From this, it can be concluded that the contact elimination procedure performs correctly. The results are exactly the same in the three different scenarios (facet, edge and vertex contact). It verifies also that there is no energy gain or dissipation since the rebound maximum height is the same always as it can be observed in fig. 48b. This is a good test to see that the method works properly for normal contacts of all three types: with facet, with edge and with vertex independently of the mesh and the indentation achieved (always lower than the radius).
3.6.2 Continuity of contact
It is essential to ensure continuity of the contact force in the non-smooth contact regions and FE element transitions. In the following example the continuity of the normal force is presented. A DE is set to move along the boundary and its contact transfers from the surface of a triangular element (facet contact) to one of its edges or vertices. A frictionless and rotation free sphere has a trajectory path enforced (as shown in fig. 49) so that the indentation is always constant (0.01 either in contact with the facets and or with the edge ). The simulation parameters are the ones presented in the table 10.
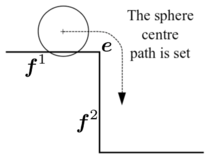
|
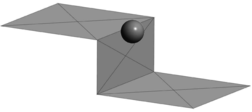
|
| (a) | (b) |
| Figure 49: Simulation scheme | |
If continuity is met, the force module must always be the same. The direction of the contact force should evolve from vertical (normal to ) to horizontal (normal to ) with a smooth transition. This is achieved due to the fact that the algorithm gives higher hierarchy to the edge and the vector is calculated joining the contact point and the centre of the sphere.
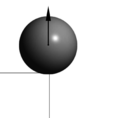
|
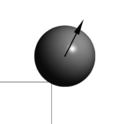
|
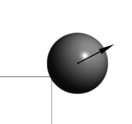
|
|
| (a) Contact | (b) Contact | (c) Contact | (d) Contact |
| Figure 50: Force applied by the surface and the edge to the sphere at different instants of the simulation | |||
The results show that no discontinuities arise when the contact evolves from facet contact to edge contact and vice versa, being the contact force constant along all the simulation and equal to 76.063 N, as expected. In a in a concave transition however, as reported in section 3.5, the continuity of normal forces across different elements is not fully assured. Even though the error is very small for practical situations, it is important to quantify and be aware of.
3.6.3 Multiple contact
The goal of this test is to check that the method determines correctly the case of a sphere contacting more than one element. The set up of the example consists of three spheres falling onto a plane with three different shape holes, as shown in fig. 51a. Simulation parameters are presented in table 11. In this example damping is applied.
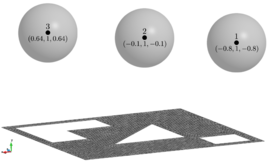
|
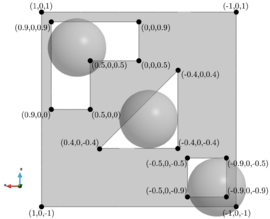
|
| (a) | (b) |
| Figure 51: Multiple contact test geometry | |
| Material properties | Calculation parameters | ||
| Radius () | Initial vel. (DE) () | ||
| Density () | Gravity () | ||
| Friction coeff. DE-FE | Time step () | ||
| Young's modulus () | Neighbour search freq. | ||
| Poisson's ratio | |||
| Restitution coeff. |
Graph in fig. 52 shows the velocity modulus of each of the DEs involved in the simulation. It can be seen that the spheres velocity after 2.5 seconds of simulation is close to 0, as expected and a final equilibrium position is reached for every sphere involving simultaneous contacts with vertices and edges.
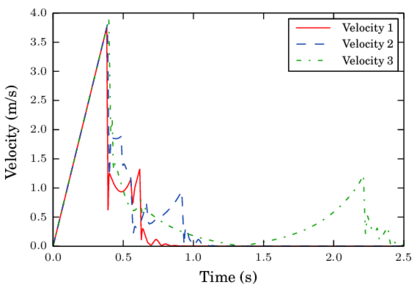
|
| Figure 52: Velocity of the DEs |
3.6.4 Mesh independence
As appointed in the introduction of section 3.5 dedicated to the method limitations, the use of classic finite elements to discretize a geometry introduces inaccuracy in the definition of the surfaces. The objective of this test is to check that the error in the discretization comes only from that aspect and does not depend on the amount, size and shape of the finite elements that are used to mesh the surfaces.
A ball slides with friction on a horizontal plate with a given initial horizontal velocity. The position of the sphere is set initially in vertical equilibrium upon the plate. The sphere should start sliding while its angular velocity will progressively increase up to a constant value at which the sliding event finishes and only rolling occurs thereafter. This is schematically depicted in fig. 53a.

|
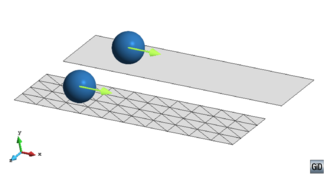
|
| (a) Problem definition | (b) Simulation set up |
| Figure 53: Benchmark of a sliding sphere on a plane with friction | |
The analytical solution can be calculated to validate the simulation using equilibrium equations with kinematic compatibility conditions and the basic Coulomb friction law. The moment of inertia of a sphere is . The following is obtained for the combined sliding and rotation phase:
|
|
(122) |
|
|
(123) |
|
|
(124) |
Equation 124 comes from integrating the angular acceleration for the case zero initial angular velocity. The constant rolling event occurs when the tangential velocity matches the angular velocity times the radius :
|
|
(125) |
|
|
(126) |
For time the equations of motion are:
|
|
(127) |
|
|
(128) |
|
|
(129) |
The set up of the simulation is shown in Figure 53b. Two cases are compared, one involves sliding on a plane discretized by a single quadrilateral element while in the other case the plane is discretized by 80 triangular elements. The parameters of the simulation are the same as in the previous example, detailed in Table 11. The spheres are given a initial velocity of in the direction. The simulation has been run for one second. The simulation results are plotted together with the analytical solution in fig. 54.
Only one numerical solution was included in the plot of fig. 54 since the difference between meshes turned to be negligible. In table 12 the values of the displacement (), velocity () and angular velocity () at the end of the simulation () are presented.
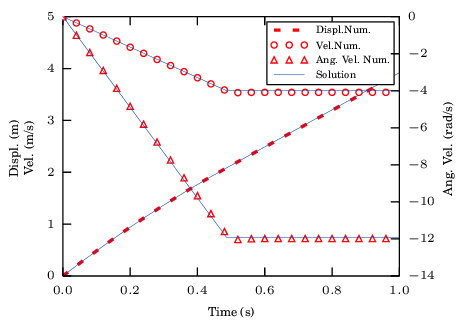
|
| Figure 54: Numerical results of the displacement and velocity in with the angular velocity in compared against the theoretical solution |
| Quadrilateral | Triangle | Analytical | |
| Error() | - | ||
| Error. () | - | ||
| Error. () | - |
This example shows how the results on the DE practically independent on the boundary mesh selected. On the other side, for the simulation performed, the numerical results agreed perfectly with the theoretical solution. This case does not show any noticeable discontinuity in the normal and tangential contact forces in the transition between boundary FEs even without using the special implementation described in section 3.5.2.
3.6.5 Brachistochrone
A good benchmark to check how well does the contact algorithm perform is the simulation of a sphere sliding without friction in a curve which solution can be determined analytically. A case of special interest is the cycloid which is has the following properties:
- Brachistochrone: It is the fastest path that goes from point A to B sliding under the action of constant gravity.
- Tautochrone: The time taken by an object sliding without friction under constant gravity to its lowest point is independent to the starting point.
Following a example is shown where two sphere slides on a cycloid curve with two lanes. The curve goes from the point to point . One of the particles is set at the top of the curve while the second one starts from a lower position as displayed in figure 55. The simulation parameters are summarized in the table 13.
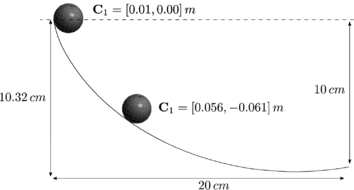
|
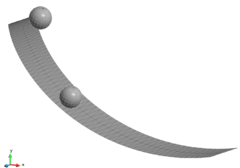
|
| (a) Example set-up | (b) 3D view of the mesh |
| Figure 55: Brachistochrone example set-up | |
The cycloid has the following parametric equations:
|
And the travel time is:
|
|
(131) |
| Material properties | Calculation parameters | ||
| Radius () | Initial vel. (DE) () | ||
| Density () | Gravity () | ||
| Friction coeff. DE-FE | Time step () | ||
| Young's modulus () | Neighbour search freq. | ||
| Poisson's ratio | |||
| Restitution coeff. |
Damping was applied to the normal contact to avoid oscillations of the contact point.
For the present example the parametric values yield: , and . The numerical solution compares well against the expected results as shown in the following table 14. The small error found may come, among other cause, from the discretization of the cycloid curve into finite elements and also due to measurement and set-up of the problem.
| Time to bottom | Time to end | |||
| Higher particle | Higher particle | |||
| Lower particle | Analytical result | |||
| Error | Error |
4. Combined DE-FE Method for particle-structure interaction
The interaction of granular materials and structures is present in many industrial applications. Some examples in which the interaction takes place have been listed in the introduction: silo flow [16,12], screw-conveyors [17,18], vibrated beds [19,20], ball mill processes [21,22], etc. On the one hand, the DEM has proved to be an efficient method to capture the discontinuous nature of the granular media involved in all those processes. On the other hand, the employment of the FEM to simulate the structures involved in those industrial applications can provide better understanding of the problem and, therefore, could play an important role in the process of design optimization. Examples of application fields in which the combined DE-FE coupling has been already successfully employed include: rock cutting [79], soil-tyre interaction problems [14,23], soil-structure [4,27], shot peening processes [24,25], impacts with flexible barriers [26], etc.
This chapter introduces a coupling procedure which allows the simulation of problems involving deformable structures interacting with particles through mechanical contact. Differently from the problem of particles contacting rigid boundaries, the contact with deformable structures calculated with FE, requires the application of more advanced contact models as it will be appointed along the chapter.
4.1 Coupling procedure
The computation of the coupled DE-FE problem is divided in the two domains. The DEs see the surface elements of the FE domain as moving boundaries. In this sense the position of those boundaries at each time step suffices to calculate the DE method in the same way as it has been detailed in chapters 2 and 3. On the other hand, the FE problem needs the introduction of the contact forces as nodal forces in order to solve the classical problem of solid mechanics described in section 4.2. The procedure of how to transfer DE contact forces onto FE nodal forces will be described in section 4.3.1.
The basic steps of the combined or coupled DE-FE procedure for the particle-structure problem adapts very well to that of the discrete elements (figure 3) with the following details:
- Contact Detection: Includes the DE/DE detection as well as the DE-FE contact detection detailed in chapter 3.
- Evaluation of Forces: On the DE side, the forces to consider are the same, plus the contact forces coming from the DE-FE interaction. On the FE side, the DE-FE contact forces contribute to the external forces involved in the solid mechanics problem to be solved (section 4.2).
- Integration of Motion: Each problem, DEM and FEM, is solved in parallel normally using the same time integration scheme and time step. This is discussed in section 4.4.
4.2 Nonlinear FEM for Solid Mechanics
The purpose of this section is to briefly introduce the basic concepts concerning the theory of the finite element solution to the solid mechanics problems that will be used along the chapter. The formulation used is the one presented in the book Nonlinear Finite Elements for Continua and Structures from T. Belytschko [76]. Further references on this topic are [1,119,120,121,122,123].
4.2.1 Kinematics
A continuum medium is assumed to be formed by an infinite amount of particles (material points) which have different position in the physical space during its movement along time. Consider a body at the initial time , the initial configuration is then, the set of positions that the material points occupy in the space. Similarly, the spatial or deformed configuration is defined by the positions of the body at a specific time (fig. 56).
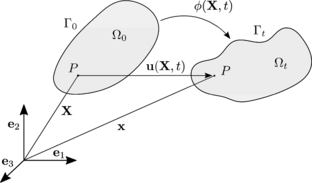
|
| Figure 56: Initial and deformed configurations of a body |
The vector defining the position of a particle in the reference configuration, , is defined in the orthonormal base of an inertial frame as:
|
|
(132) |
while the position vector in the spatial configuration is expressed in the same base as:
|
|
(133) |
The motion of the body is described by the function that maps each particle labelled by to its current position at time :
|
|
(134) |
The inverse map is also defined:
|
|
(135) |
The description of any quantity of the particles in the continuum can be done either in the Lagrangian (material) description, where the evolution over time of the quantity is studied following a fixed material point , or in the Eulerian (spatial) description, where describes the evolution over time of the quantity at a fixed point of the space . The dependence on or in the quantities will be dropped for brevity.
The displacement of a material point its given by the difference between the its current position and its original position:
|
|
(136) |
and the velocity and acceleration are the first and second material time derivatives1 of the position.
|
Measure of strain
The deformation gradient is defined as:
|
|
(138) |
being and . Tensor can be interpreted as the operation that transforms a given infinitesimal segment line in the initial configuration to its counterpart in the deformed configuration:
|
|
(139) |
The determinant of is called the Jacobian of the transformation and is denoted by .
|
|
(140) |
Introducing the displacement gradient the following relation arises:
|
|
(141) |
The theorem of polar decomposition states that for a given second order tensor with positive determinant exists an orthogonal tensor and two symmetric tensors and such that:
|
|
(142) |
Exploiting this property, the right Cauchy Green tensor can be defined as a measure that is invariant of a rotation :
|
|
(143) |
where the orthogonality of has been applied ().
Let's analyse now the case of rigid body motion (no stretch) which consists on a rotation composed by a translation, i.e . The deformation gradient according to equation 138 is and therefore the right Cauchy Green (eq. 143) yields . Since a meaningful strain tensor should vanish under rigid body motions, where no stretches and therefore no strains appear, the Green-Lagrange strain tensor is introduced:
|
|
(144) |
Where the factor is added for the compatibility with the small deformation theory. The Green Lagrange tensor expressed in terms of the displacement gradient (eq. 141):
|
|
(145) |
The small theory tensor is recovered by neglecting the second order terms in equation 145:
|
|
(146) |
Measure of stress
The forces acting in a body can be summarized as: body forces , forces per unit mass in the body domain ; and surface tractions , forces per unit area acting on the boundary (figure 57):
|
|
(147) |
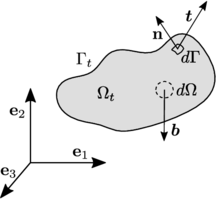
|
| Figure 57: Forces acting on a body |
The Cauchy's stress theorem relates the tractions to a stress measure , denoted Cauchy stress, projected in the unit normal of the differential surface :
|
|
(148) |
The counterpart of equation 148 in the reference configuration implicitly defines the nominal stress :
|
|
(149) |
And the Second Piola-Kirchhoff stress is defined:
|
|
(150) |
(1) Material time derivative centred in a material point reads: whereas, when centred on a spatial point , it reads:
4.2.2 Conservation equations
The basic equations that have to be satisfied by every physical system in the continuum mechanics theory are:
- Conservation of mass
- Conservation of linear momentum
- Conservation of angular momentum
- Conservation of energy
Conservation of mass
The mass of a material domain is an extensive property given by:
|
|
(151) |
The principle of conservation of mass reads: "the mass contained in a continuum (and in any material domain) is always the same".
This condition translates mathematically in:
|
|
(152) |
The material time derivative of an integral is solved applying the Reynolds theorem:
|
|
(153) |
Equation 152 is then written as:
|
|
(154) |
The localitzation principle in continuum mechanics allows converting an integral expression into a differential expression:
|
|
(155) |
Conservation of linear momentum
The linear momentum balance principle states: "the resultant of all the forces acting on a material volume in a continuum medium is equal to the rate of change in its linear momentum".
This can be expressed combining equation 85.a with equation 147:
|
|
(156) |
On the left hand side of the equation the Reynolds theorem is directly applied (eq. 153) together with the conservation of mass (eq. 155) yielding:
|
|
(157) |
The second term of the right hand side is converted into a volume integral in two steps: First, the Cauchy relation (equation 148) is invoked and then, the Gauss divergence theorem is applied:
|
|
(158) |
Substituting eq. 157 and eq. 158 into eq. 156:
|
|
(159) |
and finally, the differential form is:
|
|
(160) |
Conservation of angular momentum
The angular momentum conservation implies that "the change in time of angular momentum with respect to a point is equal to the sum of all torques steaming from external volume and surface forces with respect to that point".
The corresponding equation based on an arbitrary point reads:
|
|
(161) |
It can be proved [76] that the implications of this balance principle leads to the statement that the stress tensor is symmetric:
|
|
(162) |
Conservation of energy
The principle of energy conservation reads: "the rate of change of total energy in a body is equal to the work done by the body forces and surface tractions plus the heat energy delivered to the body by the heat flux and other heat sources".
The energy balance has the following terms:
|
|
(163) |
Where is the change of internal energy, the rate of change of kinetic energy, is the power exerted by the body and surface forces and finally is the power supplied by the heat sources. In this monograph the problem is simplified and the thermal effects are neglected yielding the following expression:
|
|
(164) |
In the case of a pure mechanical problem the solution is achieved without the employment of this equation. The expression will be useful, however, as a measure of energy in section 4.4.2.
4.2.3 Constitutive models
The constitutive models define the material behaviour through relations that typically link the strains to the stresses. The models employed in the framework of this monograph are large deformation linear elasticity, hyper-elastic models and J2 plasticity.
Linear elasticity
The extension of linear elasticity to large deformation framework is by means of the so-called Kirchoff material constitutive model. It applies to problems with large rotations but small deformations.
The relationship between strain and stresses is linear through the fourth-order constitutive elastic tensor :
|
|
(165) |
where depends only on the Young's modulus and the Poisson's ratio which are the elastic properties of the material. The strain energy per volume for the linear elastic case is given by:
|
|
(166) |
Hyper-elasticity
Hyper-elastic materials are characterized by the existence of a strain energy function that is a potential for the stress:
|
|
(167) |
A consequence of the existence of a stored energy function is that the work done on a hyper-elastic material is independent of the deformation path. The work done by the internal forces is directly given by the potential of energy defining the model. In the case of a Neo-Hookean material:
|
|
(168) |
where and are the Lamé constants defined by:
|
|
(169) |
The stresses expressed in the Second Piola-Kirchhoff and the Cauchy stress measure respectively read:
|
Further details in [124,76,120,122].
J2 Plasticity
The theory of plasticity pursues to model materials which exhibit permanent strains (plastic deformation) upon unloading. The model used in this work is the J2 hyper-elastic plasticity model. The model introduces a split of the strains in its elastic and plastic part in a multiplicative manner:
|
|
(171) |
The elastic part is modelled with an hyper-elastic model as previously introduced. The plastic deformations accumulate when a certain threshold in stresses is overpassed which is modelled by a yield surface:
|
|
(172) |
In the above, is the yield stress which is a material parameter. On the other hand is the measure of stress used check whether the material is inside the yield surface (elastic regime) or outside (plastic regime). In the first case, no plastic deformation is accumulated. In the latter case, a return mapping to the admissible region is needed. The measure is defined based on the von misses criterion:
|
|
(173) |
The measure of stress and also the internal variables controlling the evolution of the yield surface and the possible modification of the elastic behaviour (hardening) are driven by functions which depend on the deviatoric stresses: . For further details on this model see [125,126,76].
4.2.4 Finite Element discretization
The equations governing the problem of the motion of a continuous body occupying a domain at time under mechanical forces are:
|
is where the solution presents some prescribed values known as Dirichlet boundary conditions, whereas is the part of the boundary where the so-called Neumann boundary conditions, i.e. prescribed tractions , are applied. and are the initial states of the displacement and its first derivative. These equations together with the constitutive model of the material (section 4.2.3) and the kinematic relations (section 4.2.1) constitute the statement of an initial boundary value problem. The analytical solution of the problem for the unknown can not be obtained in general and commonly an approximate numerical solution is sought by application of the Finite Element Method. The purpose of this section is to highlight the basic expressions that yield to the FEM solution. Dedicated texts [119,76,121] should be addressed for a more comprehensive understanding of the topic.
The weak form
The set of equations 21.4 constitute the so-called strong form of the problem. The FEM solution is based on the weak form of the problem which is gained by the integration of the momentum equation multiplied by a test function in the form of virtual displacement such that vanishes on the Dirichlet boundary :
|
After integrating by parts and applying the Gauss divergence theorem (eq. 158), the Cauchy's stress theorem (eq. 148), the Neumann boundary condition (eq. 174.b) and the kinematical admissibility of the virtual displacement (eq. 175.b), the weak form of the equilibrium is obtained:
|
|
(176) |
Discrete form
The current domain is subdivided into elements so that . The nodal coordinates of the elements are denoted where . In the finite element method, the motion is approximated by:
|
|
(177) |
where are the shape functions that interpolate the solution on the discretized field from the values at the nodes . The shape functions must fulfill the partition of unity at any point , i.e, . In this work, the 4-nodded tetrahedra and the 8-nodded hexahedra displacement elements are used.
The velocities and accelerations are obtained by taking the first and second material time derivative of the displacements, giving:
|
The Galerkin solution employs the same shape functions to the approximation of the virtual displacements:
|
|
(179) |
By inserting the approximation functions into the weak form we obtain a discrete problem:
|
|
(180) |
where the matrix includes all the spatial derivatives of the interpolation functions . Since the virtual displacement introduced is arbitrary, equation 180 has to be fulfilled for arbitrary nodal values . Therefore, each term in brackets has to vanish separately yielding a set of non-linear differential equations that can be expressed in matrix form:
|
|
(181) |
Where is known as mass matrix, is the vector of internal forces and the vector of external loads. is the vector containing all nodal accelerations. The integrals in equation 180 are split into sums of integrals over each element , which are usually evaluated by means of a Gauss integration rule.
4.3 DE-FE Contact
The two domains, FEM and DEM, are calculated separately and their communication is through contact forces. The finite element mesh represents a moving boundary for the particles; once a contact is detected, i.e., there is some interpenetration between a particle and a finite element, the penalty method determines the contact forces on the "DEM side" that will be later transmitted to the "FE side". An alternative to this approach is, for instance, the so called pinball method [7] which embeds spherical particles onto the surface FEs in order to directly detect and characterize the contacts in a DE/DE fashion.
In this work, the Double Hierarchy Method (section 3) is used as a collision detection method which characterizes and clearly defines how to evaluate the forces in a wide range of situations involving spherical particles and planar triangles or quadrilaterals.
In a mesh fine enough it would be possible to simulate the local deformation of the solids by simply applying a relatively high penalty parameter. However, that scale can not be simulated in general, due to the amount of elements required for a single contact. Therefore the local deformations of the particle and solid involved in the contact will be modelled with the contact model instead. The details on the contact laws to be used were described in section 2.5.3. The contact model selected for the examples is the HM+D model.
The external forces that act on a solid, as described in section 4.2.1, are composed by body forces and surface tractions . The part of the surface tractions which come from the interaction with the particles through contact are determined by means of the DE method. In a second step they are communicated from the DEs to the FE nodes. Two different methods regarding the communication of forces are described in this chapter: the direct interpolation method (section 4.3.1) and the Area Distributed Method or shorter, ADM (section 4.3.3) which has been specially developed to overcome the problems that the direct interpolation method presents, described in section 4.3.2.
4.3.1 Direct interpolation
The idea is developed for the illustrative case of a flat 2D surface where, for sake of clarity, the tractions will be identified by a scalar normal pressure (figure 58). The notation for the domain of the surface elements will be .
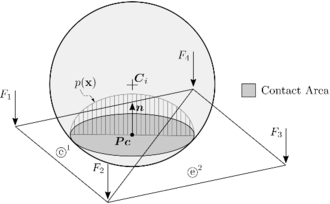
|
| Figure 58: Area of contact and pressure of a sphere in contact with two FEs |
Virtual work equilibrium is established between the evaluated contact pressure and the interpolated forces on the FE nodes.
|
We assume that the normal virtual displacement field is approximated in the space of the FE discretization while we let the pressure be a analytical scalar discontinuous function that will not be interpolated by the FEs:
|
|
(183) |
Now, an expression for every single node in the FE mesh can be obtained:
|
|
(184) |
The integral over the whole domain can be split into the different finite elements:
|
|
(185) |
For the particular case of assuming concentrated forces at one point , the pressure can be expressed as a Dirac delta function, as the work of Michel [127] describes:
|
|
(186) |
Plugging this into equation 185 yields:
|
|
(187) |
Since the integrand of the Dirac delta is only non-zero in , the integral will vanish in all the elements except for the one in which the point of contact is located. This is the case of the element labelled in figure 58. Differently, the integral in the element labelled is zero regardless of the fact that it has intersection with the particle. Equation 187 translates into:
|
|
(188) |

|
| Figure 59: Point force and the area discriminants defining the triangle's shape functions |
This yields to the direct interpolation approach presented by the early works of Horner [14] in which the external forces due to contact on each node are simply determined by the respective nodal shape function weights (section 3.4.1) times the evaluated point force . This solution ensures the equilibrium of forces and torques with respect to any point. The simple case of a linear triangle is depicted in figure 59.
Nakashima and Oida [23] in simulations of soil-tire interaction, Michael [127] for snow-tire and Oñate and Rojek [79] in rock-tool interaction are some of the authors which have also adopted this method for the communication of the contact forces involving deformable structures. However, as next section 4.3.2 reviews, this method does not meet the requirements of Hertz-Mindlin theory in regions of contact which are non smooth and they can lead to instabilities. Even if the evaluation of the forces is well determined on the "DE side", the fact that it concentrates the contact force in one point is a clear disadvantage in terms of accuracy on the "FE side".
Having said that, the direct interpolation of forces using the method (or any of the reviewed methods in section 3.1) can still be reasonable in cases where the size of the DEs is relatively small compared to the size of the deformable FEs and the penetration is negligible compared to the DEs radius, i.e., assuming small deformations (figure 60b).
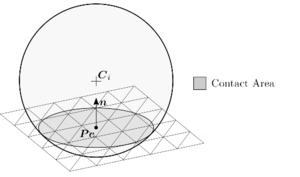
|
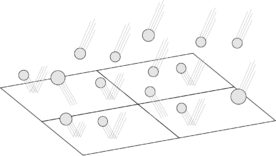
|
| (a) A spherical particle colliding several FE | (b) Many small particles colliding large FEs |
| Figure 60: Situations with different relative size ratio DE-FE | |
In general, situations where detailed FE analysis of strain and stress is conducted or simply when the contact is to be correctly determined, more accurate schemes should be used. Han et al. [128,129], Munjiza [38], Wellmann [4], among others, present some algorithms to that end. In this dissertation a new method is proposed which is based on the distribution of the contact forces determined on the "DE side" to all the FE involved in the contact. The method will be denoted Area Distributed Method and is presented in section 4.3.3.
4.3.2 Non-smooth contact
The HM+D is based on the Hertz-Mindlin theory [55,59] which is developed for case of contact of bodies that present smooth surfaces with a unique normal. Contrarily, In the DE-FE contact, plenty of non-smooth regions are encountered. The application of these type of contact laws simply represents an heuristic model which tries to satisfy some basic conditions as it was described in section 3.4, namely, conservation of energy and avoidance of force discontinuities. Some of the situations that can result in non-compliance of the above are the following:
- Artificial introduction of boundaries: Imagine the particle in figure 61 sliding from one FE to the next one. Since the contact method allows the introduction of certain interpenetration, the edge connecting elements 1 and 2 would suppose a barrier if no additional assumptions are made. This problem is solved by the simple introduction of the hierarchy between entities (section 3.4.1).
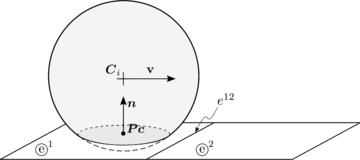
|
| Figure 61: Particle moving across two quadrilateral elements |
- Discontinuity in tangential force: Similarly to the previous example, when a particle crosses from one element to the next, the tangential forces should be correctly transmitted, since they are normally calculated in a incremental manner. In section 3.5.2 a special implementation that solves this problem is given.
- Multi-contact: Figure 62 shows two discretizations of the same situation which should yield the same result. To do so, an elimination procedure should determine properly which are the entities to be ignored and which are the relevant ones. Differently from the classical hierarchy based algorithms, the method is capable to distinguish correctly those situations as described in section 3.4.2.
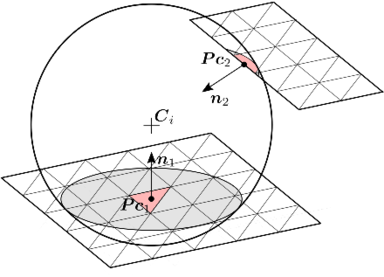
|
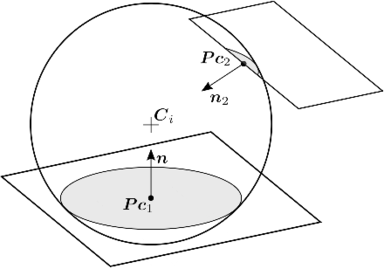
|
| (a) Contact with planes discretized by many small FEs | (b) Contact with planes discretized with one quadrilateral element |
| Figure 62: Particle colliding two boundaries with different FE discretizations | |
- Non-smooth evolution of normal forces: A deformable solid under contact will evolve in time resulting in different contact status. Figure 63 depicts a case in which the classical DE-FE methods (including ) will determine one contact force () in the first situation, but two contact forces of similar magnitude ()) in the second situation, leading to a sudden increase of the force.

|

|
| (a) Contact at a time | (b) Contact at a time |
| Figure 63: Particle colliding a plane of a deformable body | |
The method has been specially devised to give a simple and robust solution to the above-mentioned problems in case of contact with rigid structures. In the case of deformable structures, however, the problem of the non-smooth evolution of the normal forces takes special importance and it may yield to instabilities in the calculation of the solid. To overcome this problem the Distributed Area Method is introduced next.
4.3.3 Area Distributed Method
An improvement to the direct interpolation is suggested here which tries to give better quantitative results to the overall contact simulation involving particles simulated by DE and structures or solids calculated with FE and the problems that the direct interpolation method presents. The basic idea of the method is developed followed by examples which prove its superiority against the direct interpolation and validate the procedure. The implementation details of the algorithm can be found in Appendix B.
Derivation of the method
The point of departure is equation 185, where instead of introducing a point load, the interaction forces are left as a distributed pressure (figure 64).
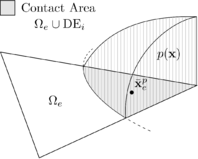
|
| Figure 64: Pressure function and centroid of the pressure on the intersection between a DE and a FE |
The centroid of the contact region in a given element weighted by the pressure distribution is determined as follows (figure 64):
|
|
(189) |
If the position is interpolated by the shape functions, it is easy to see from equation 189 that the following holds:
|
|
(190) |
Now plugging this back to equation 185:
|
|
(191) |
The forces in a node can be expressed as the contribution of the forces from every element containing that node:
|
|
(192) |
Finally, the partial nodal force contribution from a given element is:
|
|
(193) |
The expression obtained can be regarded as a generalitzation of the direct interpolation (equation 188). It suggests that the contact force contribution from each element should be distributed among its nodes weighted up by the shape functions evaluated on the centroid of the pressure distribution on the element.
The expression for the pressure between two bodies in contact given by the Hertzian theory [55] is:
|
|
(194) |
Where is the distance from the central point of contact, the maximum pressure and the radius of the circular contact area. Further details are given in Appendix A.
Integrals of the pressure function can be achieved with by numerical integration in a mortar-like [130] fashion with a sufficient number of integration points in order to capture the intersection regions and its corresponding centroids such as the one depicted in figure 64. What is suggested here instead, is to approximate the pressure as a uniform function (figure 65) acting on the intersection surface. The value of the pressure is simply determined as the total force divided by the total intersection area ensuring that the total integral coincides with the one of the Hertzian theory.
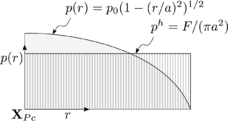
|
| Figure 65: Hertz pressure distribution and its uniform approximation |
Equation 193 then simplifies to:
|
|
(195) |
are the intersection regions between the particle and the surface elements and are their respective centroids. Note that the case of happens only in case of full planar intersection. In general, the real intersection area will be and the way to correctly determine it is . Finally, the contact forces are assembled on the nodes accounting for the contribution from every element containing the node in question:
|
|
(196) |
For the case of linear triangles the intersection areas and the centroids can be analytically determined in an easy and cheap way which is detailed in Appendix C. The extension of linear triangles to quadrilaterals or higher order elements is discussed in section 4.3.3.
In a case with multiple contacts happening at the same time, this procedure applies to every group of elements that form part of an entity with valid contact. A system of master elements and slave elements is determined using the elimination procedure (section 3.4.2). The contact forces evaluated on every master are distributed among the slaves elements in function of their intersection areas (see figure 130). Additionally, the forces on every master are scaled by the total amount of intersection area that the particle presents with the different FEs. This way the contact forces evolve smoothly in the same way as the total area does and thus, the discontinuity problem presented in section 4.3.2 is solved. This procedure is fully described in Appendix B, dedicated to the implementation of this method.
The validation of the Area Distribution Method and its comparison against the direct interpolation is performed through several examples in section 4.4.2 and section 4.5.1.
Extension to other elements
The presented method determines the normal contact forces based on the interpenetration of the bodies, and distributes it based on the calculation of the intersection areas. This has been analytically resolved for the case of 4-nodded tetrahedra which results in surfaces defined by linear triangles. In a general case, with quadratic or higher order elements, the analytical determination of the contact intersections becomes more involved.
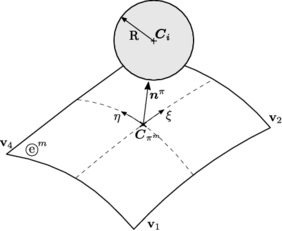
|
| Figure 66: Determination of the contact point and normal in a non-planar surface |
Figure 66 shows the case of a 4-nodded quadrilateral. is the normal at the projection point to the curved surface defined by the element . The surface is described by the convective coordinates and . The contact projection (candidate to contact point) is determined by the minimization of the distance [117]:
|
|
(197) |
This can be translated into the solution of the system following system:
|
And the normal is:
|
|
(199) |
This requires the employment of a root-finding technique which makes, in general, the problem much more expensive. In any case, the analytical determination of the areas becomes impractical and numerical integration has to be employed. In order to avoid this, an alternative is proposed here which involves the subdivision of quadrilaterals, or any other super-linear elements, using linear triangles. Figure 67 shows the case of a 6-nodded triangle and a 4-nodded quadrilateral subdivided with six and four linear triangles respectively. An extra interpolation node has been introduced in the centroid of the original geometries to create the sub-triangles.

|
| Figure 67: Possible subdivision of a 6-nodded triangle and a 4-nodded quadrilateral into 3-nodded linear triangles |
The sub-triangles substitute their parent entities during the determination of the intersection areas and centroids. The total intersection area and the intersection centroid are determined from the intersection areas and centroids of its sub-triangles using the basic composition described in Appendix C through equation C.1. Afterwards, the nodal forces are interpolated to the original parent elements' nodes by means of the shape functions as described in equation 195. This is the procedure used for the examples involving hexahedra in this work.
4.4 Time integration
Both implicit and explicit integration methods are widely used in computational solid mechanics. The choice is strongly dependent on the type of simulation of interest. It is highlighted in the book of Belytschko et al. [76] that an explicit integration method is advisable for dynamic contact problems where the high frequency response is the matter of interest. This is the case of the contact problem in which the characteristic collision times are relatively small compared to the simulation times. Furthermore, the multiple collisions of particles with a structure happening along the simulation have to be well captured. Since small time steps are required for the resolution of the contact between DEs and FEs, good accuracy can be achieved using schemes that only perform one evaluation of forces per time step and are cheaper than higher order schemes or implicit schemes. The fact that no linearisation is needed is also a clear advantage as previously discussed for the DE integration in section 2.6. Another important outcome of the use of an explicit integration is the easier parallelization of the code.
The implemented strategy is based on the explicit procedure described in the book by T. Belytschko [76] under the name of Central difference method. It is algorithmically identical with the Velocity Verlet scheme described for the discrete element method which turned to have a very good balance between accuracy and computational cost with very low memory requirements. The full description of the algorithm can be found in section 2.6. The update of nodal velocities and displacements needs the explicit determination of the accelerations from equation 181 which is rewritten here for the updated time step :
|
|
(200) |
This can be accomplished without solving any system of equations provided the mass matrix is diagonal. Lumped mass matrices will be used to achieve so. Then, the solution goes node by node and evolves with different evaluations of time. The assembly is performed nodally accounting for the contribution of the internal forces and external forces which are assembled element by element. The case of the contact forces due to the interaction with the particles has been detailed in section 4.3.3 (equation 196).
4.4.1 Explicit scheme critical time step
One of the notable disadvantages of explicit integration schemes, as mentioned in section 2.6, is their conditional stability. In a general situation, involving several particles interacting with solids discretized by finite elements, the time step should respect the criterion determined in section 2.6.4 regarding DE/DE and DE-FE interaction as well as the stability limits of the integration of the solid mechanics problem itself.
Similarly as for the DEM, the stable time step in the central differences scheme can be approximated by the highest frequency of the linearised system. For the case of a mesh of constant strain elements with rate-independent materials it can be evaluated as:
|
|
(201) |
Where is the coordinate index, is a characteristic length of element, is the wavespeed and is a reduction factor that takes into account the non-linearities which destabilize the system; Belytschko [76] proposes a value ranging .
Rayleigh damping
The Rayleigh damping is the one implemented in the code where the coupled DE-FE procedure has been developed. The linear equations of motion for a damped system are:
|
|
(202) |
Where is expressed in function of a damping matrix and a stiffness matrix (see equation 181). A common choice is to define as a linear combination of and so that the system can be diagonalized with the same eigenvectors as the undamped case.
|
|
(203) |
and (also known as and in the literature) are input parameters that usually are calibrated to obtain a desired fraction of the critical damping . It can be calculated element-wise as:
|
|
(204) |
The new critical time step can be derived in the same way as before for the new linear system:
|
|
(205) |
4.4.2 Energy assessment
Unfortunately, there is not a well-defined methodology to accurately predict the time step needed to be used in a coupled DE-FE simulation. There are many factors involved such as the integration scheme of each of the methods, the characteristics of the simulation, the contact models used, the constitutive modelling of the materials, etc. On the top of that, it has been shown for the DEM that the theoretical time stability of the integration scheme does not suffice to ensure the overall stability (section 2.6.4) and the concept of Contact Resolution was employed.
On the other hand, it is common practice to determine the stiffness of the contact as a merely numerical penalty which enforces the impenetrability condition not intending to model the dynamics of the contact. In those cases, the penalty is often selected in function of the assumable time step. In this section the use of an energy check is proposed as a method to ensure the stability of the system from a global point of view. If the time step is correctly selected, the energy is expected to be constant along the simulation (accounting for the dissipation terms); otherwise, if an increase of energy is detected, the stability is not ensured and the time step should be reduced.
The expression for the energy balance (164) can be used to derive a measure of energy for the different mechanisms involved in the problem. Using an explicit integration scheme, the amount of energy at every time step can be approximated assuming that all quantities are constant within a time step:
|
where the superscripts denoting the time step have been omitted for clarity. The work done by the traction forces due to contact are not accounted on the FE side, instead they are easily evaluated on the DE side as contact forces with every master. Now the expressions of the all the energy involved in a system of particles is detailed:
|
Where is the gravity and is the nodal inertia which in case of a sphere is a constant value for all reference frames. The elastic energy generated by the contacts will be denoted . It will be calculated for every particle in the system accounting for all DE contacts and every FE contact in the following way:
|
|
(208.a) |
The factor in the particle contact summation comes from the fact that in a full particle loop the contact between particles and will be accounted twice. On the other hand, the energy contribution coming from the contact between DEs and FEs will be accounted just on the DE side, and therefore, the full energy has to be computed. The quantities , , correspond to the elastic, frictional and dissipative energy terms that are computed depending on the contact model employed.
The computation of the elastic energy is described here for the Hertzian contact law (section 2.5.2) which can be applied to both DE/DE and DE-FE contact:
|
The tangential part is calculated incrementally with the elastic tangential force increment (equation 9.2) and the incremental displacement (equation 31.a). Differently, the normal elastic force can be directly evaluated by the integral expressed above since it is a conservative force:
|
|
(210) |
where is was defined in equation 38.a.
Finally, the global balance of energy reads:
|
Where is an arbitrary initial energy.
4.5 Validation examples
The purpose of the following examples is to validate the described coupled procedure together with the methodology developed for the communication of forces from DE to FE in the Area Distributed Method.
4.5.1 Impact on simply supported beam
A particle-structure interaction academical example is presented here which consists on a spherical particle colliding a simply supported beam (figure 68). Two different cases are reproduced here in order to assess the coupled DE-FE procedure. The reference solution to this problem, earned from linear modal dynamics, was proposed by Timoshenko in 1951 [131] and is reviewed in [132].
Two examples are reproduced with the same parameters, in the first one the radius is and the length of the beam is while the second one has a particle of of radius and a length of for the beam. The material properties described in [132] are summarized together with the simulation parameters in table 15. The first case produces a single impact while the second yields to three of particle/beam impacts. The meshes used are 8-nodded elements respectively for the length, height and depth in the first example and in the second example.

|
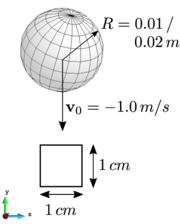
|
| (a) Front view | (b) Side view |
| Figure 68: Simply supported beam hit laterally at its centre by a sphere | |
| Material properties | DE | FE | Calculation parameters | |
| Radius () | - | Contact Law | Hertzian | |
| Density () | DE-FE Model | ADM | ||
| Young's modulus () | Initial vel. (DE) () | |||
| Poisson's ratio | Gravity () | |||
| Restitution coeff. | 1.0 | - | Time step () | |
| Friction coeff. DE-FE | 0.0 | - | Neighbour search freq. | 50 |
The results (figure 69) are quite satisfactory since the HM+D model simply defined by the material properties is able to perfectly reproduce the contact forces. Once the contact finishes, the beam oscillates in a combination of different excited modes. The largest frequency mode, which can be easily identified in the figures, corresponds to the natural frequency of the structure and it is perfectly matched. The higher vibration modes however, are not correctly captured by the linear hexahedra elements available in the code, which are not the best suited elements to simulate flexural modes. As a consequence of that, there is a deviation on the second and third contact events in the second example (figure 69b).
4.5.2 ADM vs Direct interpolation
A comparison is performed between the direct interpolation and the Area Distribution Method using a coarser mesh of hexahedra. The results for the contact force predicted by the ADM (figure 70) are considerably accurate despite of the bad quality of the mesh. The direct interpolation instead, yields to very inaccurate results, as it predicts a stiffer contact due to consideration of a contact force with two planes as can be seen in figure 71. The effect of the sudden change in normal force (section 4.3.2) can be clearly seen in the results. It corresponds to the instant in which the contact dectection goes from a contact with a single edge to a contact with two planes.
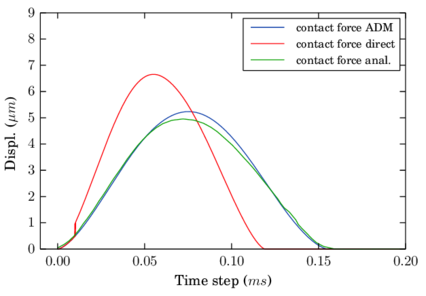
|
| Figure 70: Analytical solution versus numerical solutions for the direct and the distributed methods in a coarse mesh |

|
| Figure 71: Displacement at (deformation ) |
4.5.3 Energy in a single DE-FE collision
The two methods for the DE to FE communication of forces are analysed from the energy point of view in this example. The energy of an elastic collision of a spherical particle with a FE cube is reproduced here. A frictionless particle moves without gravity towards the cube inducing a normal collision. The cube has its 4 inferior nodes fixed. The contact law used is the Hertzian contact law and the constitutive material model for the solid is Neo-Hookean. The properties are summarized in the following table 16:
| Material properties | DE | FE | Calculation parameters | |
| Radius () | - | Initial pos. (DE) () | ||
| Density () | Initial vel. (DE) () | |||
| Young's modulus () | Gravity () | |||
| Poisson's ratio | Time step () | |||
| Restitution coeff. | 1.0 | - | Neighbour search freq. | 1 |
| Friction coeff. DE-FE | 0.0 | - |
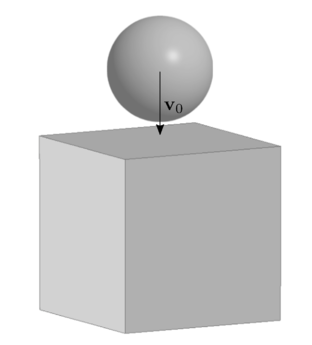
|
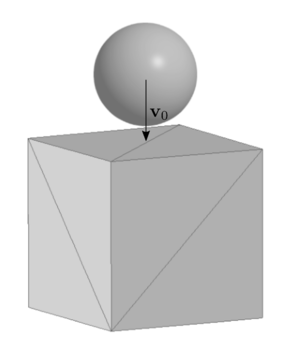
|
| (a) Cube meshed by one hexahedron | (b) Cube meshed by six tetrahedra |
| Figure 72: Sphere impacts a cube | |
The cube is meshed using one single hexahedron and six tetrahedra (figure 72). The latter case presents again the problem described in section 4.3.2 in which the contact surfaces deform implying a contact with two planes instead of the single plane contact that occurs with the quadrilateral surface of the hexahedron. The two cases have been run using both the direct interpolation and the Area Distribution Method (ADM).
The results show that all cases behave in a similar way except for the direct interpolation method using tetrahedra, which presents a stiffer contact (shorter duration) yielding to a higher excitement of the solid cube. The distributed method instead, manages to capture the same contact time for the two discretizations. This is because the intersection area is the one controlling the magnitude of the total force, which is practically the same in the two cases (figure 73c and figure 73d), regardless of how many contact forces act on the particle.
Energy test in a multi DE-FE system
A final example is designed to check the global conservation of energy of the coupled DE-FE algorithm. All frictional and dissipation mechanisms have been disabled for sake of simplicity and a purely elastic constitutive law is used for the material description and for the contact modelling.
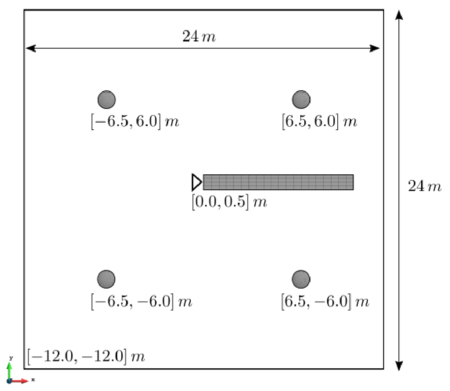
|
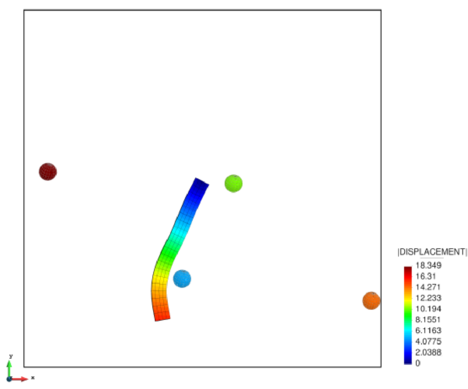
|
| (a) Simulation set-up | (b) Displacement at time . 2D view |
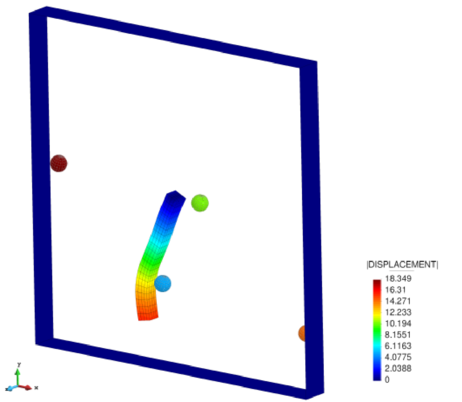
| |
| (c) Displacement at time . 3D view | |
| Figure 74: Pendulum-like prism interacting with several spherical DEs | |
A prismatic structure with a node fixed in one extreme oscillates like a pendulum under the action of a gravity force. Four spherical particles are set in the domain which have collision with the structure, among themselves, and with the rigid walls closing the domain (figure 74a). The prism has been discretized with a mesh of 8-nodded hexahedra.
The test has been run using a Hertzian contact law with a large deformation Neo-Hookean model for the solid. The ADM has been used to interpolate the forces. The parameters are summarized in the following table 17:
| Material properties | DE | FE | Calculation parameters | |
| Radius () | Gravity () | |||
| Density () | Time step () | |||
| Young's modulus () | Neighbour search freq. | 1 | ||
| Poisson's ratio | DE-FE contact model. | ADM | ||
| Restitution coeff. | 1.0 | - | ||
| Friction coeff. DE-FE | 0.0 | - |
The Young's modulus of the surrounding walls was set to .
The results (figure 75) are obtained evaluating all energy terms in the system. Since the deformation and collision regime is fully elastic and no frictional neither dissipative forces are considered, the total amount of energy expressed by equation 24.3.1 should be constant along the simulation. For the presented results, is set such that total energy .
|
|
(212.a) |
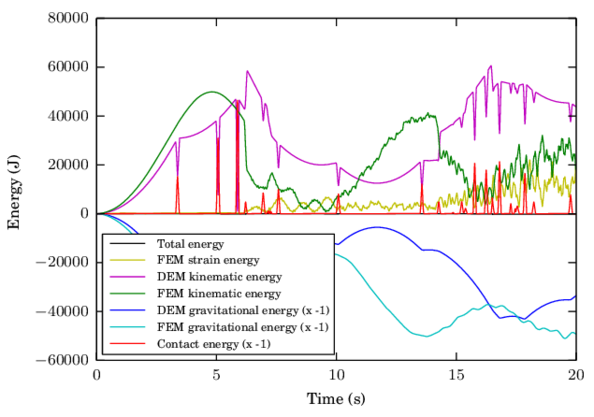
|
| Figure 75: Total energy of the system |
As the simulation evolves the behaviour turns more chaotic. Since there is no dissipation, the prism excites different high frequency vibration modes due to the collisions in different positions and directions. The overall energy keeps balanced as it was expected. The results validates the DE-FE coupling by means of the Area Distributed Method and indicates that the time step selected for this simulation is stable.
4.6 DE-FE coupling flowchart
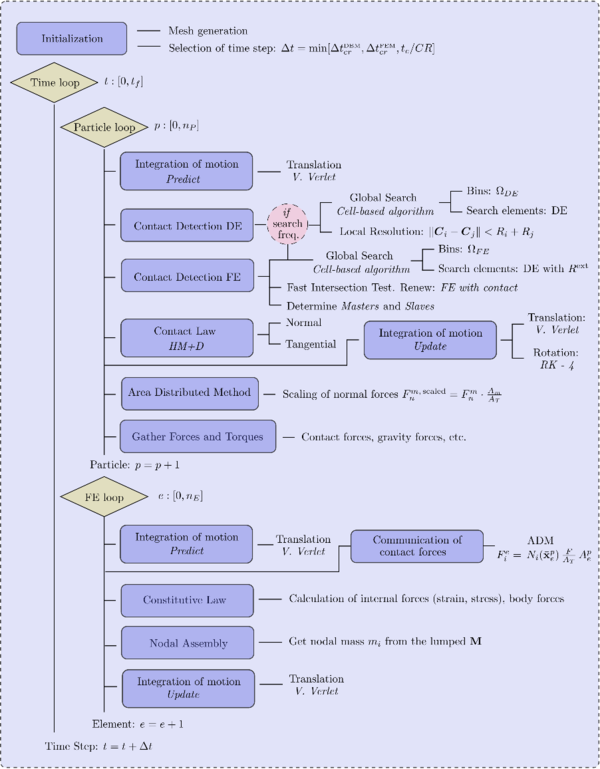
|
| Figure 76: Basic flowchart of the coupled DE-FE for particle-structure interaction |
5. DE model for cohesive material
Within the DEM, the individual particles are modelled as stiff bodies which interact via contact forces. This simplification has the advantage of representing the complicated microscopic behaviour by a simple system of linear equations based on a relatively small number of parameters. In problems where large deformations and fracture are involved the DEM has attractive features in contrast to continuum-based methods such as FEM, specially its naturally discontinuous behaviour. The main aspiration is to have a general computational method for unified modelling of the mechanical behaviour of solid and particulate materials, including the transition from solid phase to particulate phase.
It is agreed that the Discrete Element Method is a great technique to simulate the discontinuous media as a system of independent particles in dynamic motion. However, regarding the simulation of continua, the lack of theoretical basis even for linear elasticity has restricted its application. There have been, a large number of different approaches for this question: How should the contact models be characterized (micro scale parameters) in order to resolve the macro scale continuum behaviour? The challenge in all DEM models is to find an objective and accurate relationship between the DEM parameters and the standard constitutive parameters of a continuum mechanics model, namely the Young modulus , the Poisson's ratio and clear determination of the stress and strain tensors and its constitutive relations.
The definition of the micro parameters can be done globally with uniform values for all interactions between particles or locally based on the properties of each pair of particles at its interaction points. The first approach has been taken by several authors [101,79,133] which obtain the values correlating numerical experiments and laboratory tests or performing an adimensional analysis as is suggested in [134,34]. Alternatively, the local approach, tries to find a mechanical relationship between the micro and macro parameters. It encompasses many different interpretations for the definition of the DEM parameters [33,135,136,137,138,139].
Both of these approaches give DEM a phenomenological character which relies on a calibration process in order to correctly determine the parameters that rule every specific problem. Generally, the results are dependent on the discretization and the accuracy is far below that of continuum based methods. Alternatives to this are, on the one hand, the use of a two scale or embedded DE-FE combined method [79,140,8] in which the FEM is adopted in the continuum parts and the DEM is used when damage appears. On the other hand, some alternative methods have been published which use energy equivalence principles to model the inter-element laws claiming not to require calibration [141]. These approaches are still not too widespread and require further development to be adapted to non-linear problems with proper description of failure.
In this chapter, spherical particles are employed as discrete elements to model geomaterials, namely rock or concrete. To that end, a constitutive model framed on the local approach, the DEMpack model [36], has been developed and it will be thoroughly described in section 5.2. Classical methods are used for the contact detection (section 2.2) with a special treatment of the neighbours which can have bonds which are cohesive or not and can handle initial gaps and interpenetration. The integration of the equations of motions will be performed normally with the Velocity Verlet scheme, see section 2.6.1.
After the discussion on general characteristics of the DE methods applied to simulate continua and the presentation of the model, some basic numerical analysis are presented to asses the behaviour of the method. Later on, a set of examples regarding the simulation of laboratory tests on concrete specimens are presented; they have been run under the developed Virtual Lab module (section 6.1.4) which is integrated in the DEMpack code (www.cimne.com/dempack).
5.1 DEM as a discretization method
5.1.1 Simulation scale
The first aspect to decide is the relation between a discrete element in the simulation and the physical particles or media being modelled. The one-to-one approach has been successfully applied to problems which lie in different scales including simulations at the atomistic level (figure 77a) under the framework of molecular dynamics, to simulations of granular matter, ranging from powder particles () to rock blocks ().
The fracture of geomaterials such as rock or concrete occur at the mesoscale (), generally in the interfaces between the aggregates and the paste (figure 77b). At this scale, a simple concrete laboratory concrete specimen of cm diameter and cm height, involving fine aggregates on the order of 500 , would require approximately 5 million one-to-one discrete elements.
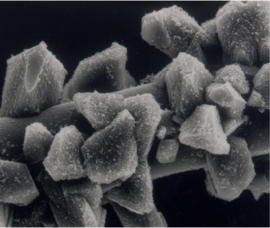
|
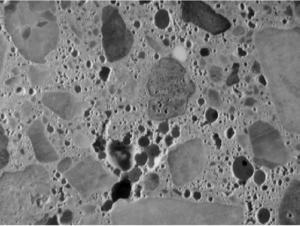
|
| (a) Crystalline micro-structure of cement | (b) Detail of paste, agregate and voids in concrete |
| colspan="2" | |
| (c) Two different scales in concrete. Taken from: Google images | |
| Figure 77 | |
Since this becomes impractical for applications on real structures, normally this is done in a very small domain from which, using multi-scale approaches, macroscopic constitutive laws for a FE discretization can be derived. Alternatively the macroscopical approach can be taken. It involves the employment of larger elements in which a measurement is assumed to yield values which are representative of the whole volume modelled by the element discarding any discontinuity in the media that composes it. In this regard, the employment of DE as a discretization method to macroscopically model a continuum might lead to a contradiction. It is also debatable that, at this macroscopic scale, the simulation of fracturing using discrete elements can yield meaningful results in the prediction and tracking and branching of fractures.
In this chapter, the DEMpack model is presented, which attempts to simulate geomaterials employing DEM as a discretization method at the macroscopic level. Basic numerical analysis and presentation are included in the chapter to support the discussion on whether the method is adequate or not for this purpose.
5.1.2 Partition of space
The first challenge a DEM faces is the fulfilment of the partition of space. The discretization of the complete volume of a body without the addition of extra volume or the inclusion of voids is not feasible using spherical particles or other similar DE geometries.
Spheres packing
The meshes obtained when discretizing regular geometrical 3D objects such as cubes, prisms or cylinders with spheres having tangential contact yield a lot of empty space left. The maximum density sphere packing that can be obtained for a regular mesh comes from a distribution in the following manner:
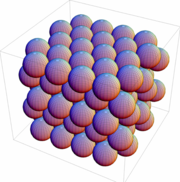
|
| Figure 78: So-called cubic packing for spheres. Taken from: Wolfram Alpha |
Starting with a layer of spheres in a hexagonal lattice, the next layer is placed in the lowest points you can find above the first one, and so on in the same way oranges are stacked in a shop. At each step there are two choices of where to put the next layer, so this natural method of stacking the spheres creates an uncountably infinite number of equally dense packings, the best known of which are called cubic close packing and hexagonal close packing. Each of these arrangements has an average density of:
|
|
(213) |
The Kepler conjecture states that this is the best that can be done, i.e, no other arrangement of identical spheres has a higher average density.
The optimal (minimum) porosity obtained with particles of the same radius is then in the order of . Higher compactness obviously require the combination of different sizes. However, a considerably large dispersion (small spheres in contact with large ones) yields obvious counterparts in a DE simulation such as inefficient global search algorithms, heterogeneous contact characterization and limiting critical times for the explicit schemes.
Mesh generator
The discrete meshes that are used in DEMpack are generated using the sphere mesher of GiD. It has to be pointed out that, since the mesher has some imperfections, gaps, inclusions and some abnormal big or small particles will be obtained. This has to be taken into account in the next sections to properly define their properties in the model.
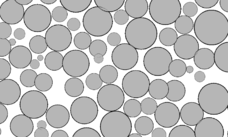
|
| Figure 79: Cut view of a 3D sphere mesh with imperfections generated by GiD |
In section 5.3, the explanation of how to deal with these imperfections and how to complete the volume modelled can be found.
5.1.3 Characterization of bonds
The overall behaviour of a material can be reproduced by locally associating a simple constitutive law to each contact interface. The interaction between spherical elements and with radius and is defined within an interaction range which is not always a tangential contact situation (Figure 80).
|
|
(214) |
is the distance between the centroids of particles and and is the interaction range parameter in the initial configuration. The equilibrium position is then defined including gaps or indentations up to some tolerance . In this work, the value of was chosen for the examples. By the introduction of the initial delta , the initial distance can be simply written as:
|
|
(215) |
The handling of these non tangential contacts is further discussed in terms of the implementation in section 5.1.4.

|
| Figure 80: Definition of the contact interface bond |
Every bond represents an interaction region that accounts for some volume of the full discretized domain. The interface has an associated contact area:
|
|
(216) |
is taken in the DEMpack model as . This choice does not ensure however, that the representative volumes, here represented as cylinders, accomplish the partition of unity. Instead, these volumes usually present overlapping between different contact pairs which, at the end, translates into an over-stiff system. The DEMpack method suggests the employment of a corrected area:
|
|
(217) |
with a global correction correction value :
|
|
(218) |
where and are the average number of contacts per sphere and the average porosity in the mesh. Eq.(218) has been deduced by defining the optimal values for the number of contacts per sphere and the global porosity equal to 10 and 25%, respectively (see the perfect packing of spheres in section 5.1.2). Some analysis done with the model showed that this correction of areas is still mesh-dependent and has to be calibrated. In section 5.3 a new area determination is proposed which improves the DEMpack model in terms of avoiding mesh-dependency for the stiffness characterization.
5.1.4 Neighbour treatment in the cohesive model
A few details are given here on the implementation of a generic cohesive model using a sphere mesh.
Initial indentation
The position of equilibrium for the contacts is set with their initial configuration. The initial status between the spheres is not always a tangential contact and can involve gaps or initial indentations up to some tolerance limit to be defined for every mesh. This has been depicted in figure 80. The initial distance of each pair is stored as the passive initial contact status (equilibrium)1.
Cohesive groups
The model allows testing different cohesive entities which are meshed independently with spheres. Each of these entities may form an independent body with particles interconnected through bonds that typically can resist tension and shear. Several cohesive entities, with the same material or with different materials, can interact among them and also with other discontinuum particles in the model.
In terms of implementation in the DEMpack code, the requisites for a cohesive bond to be generated are:
- Particles having an initial positive indentation or initial gap smaller than certain tolerance.
- Particles belonging to a cohesive group (no discontinuum particles).
- Particles belonging to the same cohesive group (same body).
As a clarification example, figure 81 shows a pillar and a foundation of concrete which constitute two separate bodies identified with two different cohesive groups. The particles defining every group are cohesive since the material is concrete. The contacts between concrete particles belonging to a different group however, are non cohesive, and a frictional contact is defined. Finally the gravel surrounding the structure form part of a third group which is non cohesive.
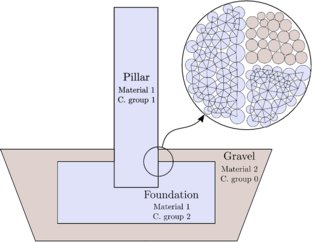
|
| Figure 81: Pillar and foundation of cement in a granular terrain. Example of the bonds formed in each of the different cohesive groups |
Neighbour lists
In the DEMpack software the neighbouring particles of a given DE are sorted in the following way:
[Current neighbours] = [Initial neighbours] + [New neighbours]
The initial neighbours array is fixed and only the new neighbours are updated at each time step. The initial list is formed during the initialization phase of the simulation with the neighbours that meet the above-mentioned conditions forming a cohesive bond. The initial neighbour array has two arrays associated to it, one array containing all the values for the initial indentations which defines the equilibrium position with each of the initial neighbours and an array with an integer defining the failure status of every contact. The failure status is initialized with a value indicating that a cohesive bond exists until failure occurs and then changes to a value categorizing the type of failure given by the constitutive law, namely shear failure, tension failure, etc.
The DEMpack constitutive law applies directly to the initial neighbours which are still cohesive. This permits simulating cohesive material with large deformations in which the large negative indentations could not be traced by the neighbour search algorithm. On the other hand, the rest of the neighbours are treated as a discontinuum contact as described in chapter 2 and they need to be found regularly by the neighbour search.
(1) In a discontinuum case, normally the initial indentations are eliminated before the simulation starts to ensure tangential contacts.
5.1.5 Cohesive models in linear elasticity
The main goal of using DEM in the simulation of cohesive materials such as concrete or rock, is reproducing its characteristic multi-fracturing pattern, as well as an accurate determination of the strains and stresses which they are subjected to. The aspiration is to have a general method for a unified modelling of the mechanical behaviour of solids and particles, including the transition from the solid to the particulate phase.
A necessary first step for the method to assess, is to reproduce the linear elasticity. Unfortunately, there is not a direct unique general way to achieve that. An example of the state of the art for each of the two approaches described in the introduction of the chapter, namely the global and the local approach, are briefly reviewed in this section.
Dimensional Analysis - Global Approach
Huang [34] used dimensionless laws in order to estimate the mechanical behaviour of an assembly of particles under quasi-static conditions. It is assumed that the problem is governed by the following set of characteristics parameters: , , , , , , ; where and define the contact stiffness in normal and tangential directions, is an averaged radius, the density, is the sample length, is the load velocity and the porosity of the assembly, as an indirect measure of the particle size distribution and contact density. Later, Yang et al. [142] showed that the porosity may not be a good index to represent the particle size distribution, and generalized the influence of the particle assembly by a parameter summarizing different mesh effects such as particle size distribution, coordination number (average number of neighbours per particle), etc.
Since there are seven parameters and three independent dimensions, according to the Buckingham theorem four independent dimensionless parameters govern the elastic response of the assembly:
|
|
(219) |
It is assumed that, if an enough number of particles is considered, the ratio can be ignored. The same can be assumed for the velocity, considering the condition of quasi-static loading . The dependence of the elastic constants on the micro-scale parameters can thus be reduced to the following scaling laws:
|
|
(220) |
According to the found scaling laws, the macroscopic elastic constants and are completely determined if the normal and shear stiffness are known for a given size distribution of the particles. This means that the relationship between the micro parameters , and the macro parameters only hold for a specific assembly of particles, with a given configuration, and can not be scaled to a different one. In other words, the method is mesh dependent and needs calibration.
This approach was also followed by Labra [101], obtaining the following results:
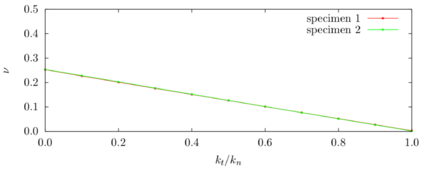
|
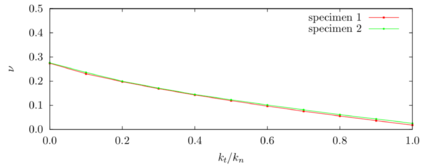
|
| (a) Plot versus in 2D. Taken from: Labra [101] | (b) Plot versus in 3D. Taken from: Labra [101] |
| Figure 82: Poisson's ratio for different values of in a UCS test on a concrete specimen | |
Labra found out that, for a given assembly, the ratio is the main key to determine the macroscopical Poisson's ratio of the model. As it can be seen, there exists a limitation on the maximum value of Poisson's ratio to the value of in 2D case and nearly in 3D. Similar results are obtained in the alternative local approach as it is shown next.
Regular assemblies - Local Approach
An interesting study was perform by Tavarez and Plesha [138] with a local definition of the contact parameters in a regular assembly of particles. Their attempt was to theoretically establish the micro-macro parameters relationship for a given unit cell of the material.
 ] ]
|
| Figure 83: Close-packed DEM unit cell for determination of inter-element spring constants. Taken from: Tavarez and Plesha [138] |
Figure 83 shows an isotropic solid material element (with known and ) subjected to uniaxial stress. The volume of material is then modelled using the DEM close-packed unit cell with the loading shown in Figure 83. The unit cell contains seven elements having three degrees of freedom per element (two translations and one rotation). Due to the symmetry of loading, all rotations in the unit cell are zero. Therefore, a matrix equation for the 14 translational unknowns can be expressed in the form of:
|
|
(221) |
Expressing the stiffness matrix as a function of and and the geometry and solving for a known case with determined vectors and , the normal and tangential elastic stiffness for this assembly can be found:
|
|
(222) |
Where and are and for the 2D plane stress or and respectively in plane strain case.
 ] ]
|
| Figure 84: DEM discretization and unit cell used in Tavarez and Plesha work. Taken from: Tavarez and Plesha [138] |
The normal and tangential stiffness obtained in numerical simulations by this methodology is in total agreement with equations 222. Assuming the shear stiffness must be non-negative, it is interesting to note that these equations limit the maximum value of to for plane stress and for plane strain. This results are in the same line as the ones obtained by the dimensional analysis previously shown.
In general, both global and local approaches require a calibration procedure for every mesh in order to correctly capture the Young's modulus and Poisson's ratio. In the case of regular assemblies this is not necessary since an analytical expression can be derived for a given mesh; the disadvantage of this method however, is that the multi-fracture path is predefined by the mesh as well. In both reviewed methods the Poisson's ratio is limited to maximum values of and is mesh dependent. The aim of this chapter is to analyse the DEMpack model, a local approach using irregular meshes, which aims to model in first instance the linear elasticity problem for different values of Young's modulus and Poisson's ratio and later be able to simulate the failure of material. First the description of the model is presented followed by numerical analysis to asses its propertites as a discretization method.
5.2 The DEMpack model for cohesive material
The characterization of the constitutive behaviour of a material in the DEM is through one-dimensional non-linear relationship between forces and displacements at the contact interfaces. Standard constitutive models for the cohesive DEM are characterized by the following parameters:
- Normal and shear stiffness parameters and .
- Normal and shear strength parameters and .
- Coulomb internal friction angle and coefficient and .
- Coulomb dynamic friction angle and coefficient and .
- Local damping coefficients , at the contact interface.
The rheological model is exactly the same as the one presented in chapter 2 for the discontiuum model (figure 6). It has the peculiarity that now the bonds can work both in compression and tension. On the top of that, limiting values for the forces in both normal and shear direction determine changes in the contact laws such as breakage of the bonds, plasticity, damage, etc. After fully breakage of the bonds, the particles recover their original discrete frictional behaviour.
In this section, the so called DEMpack model for the analysis of concrete material will be presented. The model, which derives from the linear LS+D law (section 2.5.1), has been developed by Oñate et al. in [36] and implemented in the DEMpack software to be used in engineering projects. It has been validated through the analysis of concrete samples in several laboratory tests such as the Uniaxial Compressive Strength (UCS) test, triaxial tests and the Brazilian Tensile Strength (BTS) test. The results obtained with that model compare well with experimental data for the tests provided by the Technical University of Catalonia (UPC) for the concrete samples reported in Sfer et al. [143].
The DEMpack model, as other cohesive models, presents several limitations which will be briefly reported here together with the proposal of a few possible improvements.
5.2.1 Elastic constitutive parameters
Let us assume that an individual particle is connected to the adjacent particles by appropriate relationships at the contact interfaces between the particle and the adjacent ones. These relationships define either a cohesive bond or a frictional sliding situation at the interface.
Normal contact force
The normal force at the contact interface between particles and is given by
|
|
(223) |
where is the normal stress () at the contact interface and is the effective area at the interface defined in eq. 217.
The normal stress is related to the normal strain between the spheres, , by a visco-elastic law as:
|
|
(224) |
where the normal strain and its rate can be expressed:
|
|
(225) |
Combining equation 225 and 224 into equation 223, the normal force-displacement relationship at the interface between particles and is deduced as:
|
|
(226) |
In this expression, the concept of the indentation is generalized to the displacement which can be positive (tension) or negative (compression). Substituting eqs. 217 and 19 into 226 we find the expression of the stiffness and viscous (damping) coefficients at the contact interface as:
|
|
(227) |
Eq.226 is assumed to hold in the elastic regime for both the normal tensile force and the normal compressive force . It results in a model equivalent to the LS+D (section 2.5.1) with its own particular definition of the stiffness.
Shear forces
The shear force along the shear direction is modelled by the LS+D model (section 2.5.1) which applies in both compression and tension states. Here an expression using an incremental update is presented:
|
|
(228) |
No local damping was employed in the tangential direction. The limiting values of the tangential force are defined by the failure mode described in section 5.2.3. The determination of the relative tangential displacement was detailed already for the discontinuum case in section 2.5.1. The stiffness value is deduced similarly as the normal forces yielding to a ratio:
|
|
(229) |
5.2.2 Global background damping force
Some application examples happen to be in a static or quasi-static regime. The application of a global damping to all the particle systems can numerically help the dynamic explicit calculation achieving a quasi-static state of equilibrium. This damping which is non-viscous is additional to the local damping introduced at the contact interface. The following global damping forces and torques were considered:
|
|
(230) |
|
|
(231) |
This damping reduces the total unbalanced forces resulting in every particle. The translational and rotational damping coefficients and are design parameters. A practical choice is to define and as a fraction of the stiffness parameters and , respectively. In this work the value taken for the laboratory tests in section 5.5 is . Alternative a viscous type damping can be used as described in [101,79].
5.2.3 Elasto-damage model for tension and shear forces
In order to reproduce the behaviour of the fictional cohesive materials like cement, rock or concrete, the DEMpack model introduces a simplified unidimensional non-linear elasticity, plasticity and damage laws as well as a specific uncoupled1 failure criteria. These models were specially designed for its application in projects in the field of concrete test simulation (section 5.5) and rock mechanics. For convenience the upper indices are omitted from now onward in the definition of the normal and shear forces , at a contact interface.
Normal and shear failure
The DEMpack model assumes that the bonds are cohesive (they can work both in compression and tension) until some failure criteria related to the shear or tensile stresses is met. The uncoupled failure (de-bonding) criterion for the normal and tangential directions at the contact interface between spheres and is written as:
|
|
(232) |
where and are the interface strengths for pure tension and shear-compression conditions respectively, defined in the model as:
|
|
(233) |
where and are the tension and shear failure stresses, respectively and is the (static) internal friction parameter. These values are assumed to be an intrinsic property of the material. The failure stress is typically determined from a BTS laboratory test. In this work, and have been taken respectively as the cohesion and the internal friction angle of the Mohr-Coulomb criterion.
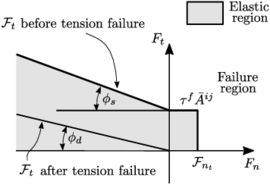
|
| Figure 85: Uncoupled failure criterion in terms of normal and shear forces |
The values of and can be estimated following the procedure proposed by Wang et al. [144] for rocks:
|
|
(234) |
where is the slope of the line that fits the values of the limit axial stress versus the confining pressure for different triaxial tests and is the value of the limit axial stress (defining the onset of the non linear branch) for the Uniform Compressive Strength (UCS) test. The value of and are obtained from equations 234. The cohesive models of the DEM, in general, require the calibration of these parameters phenomenologically using this or other procedures trying to fit the experimental curves [139,36].
Figure 85 shows the graphic representation of the failure criteria described by eq. 232 and eq. 233 which assumes the simplification that the tension and shear forces contribute to the failure of the contact interface in a decoupled manner. On the other hand, shear failure under normal compression forces follows a Mohr-Coulomb type constitutive law, with the failure line being a function of the cohesion, the compression force and the internal frictional angle.
Damage evolution law
Elastic damage can be accounted by assuming a linear evolution of the damage parameters and which control the loss of stiffness in the force-displacement relationships in the normal (tensile) and tangential directions, respectively (Figure 86).

|

|
| (a) Damage law for tension | (b) Damage law for shear |
| Figure 86: Undamaged and damaged elastic module under tension and shear forces | |
The constitutive relationships for the elasto-damage model are written as:
|
For the undamaged state and , while for a damaged state and . and are damaged elastic stiffness parameters.
The evolution of the damage parameters is chosen evolve linearly between the two limits and for both tangential and tensional directions that have to be introduced in the model. Therefore, the evolution of the damage parameters is expressed:
|
|
(236) |
Damage effects are assumed to occur when the failure strength conditions are satisfied:
|
|
(237) |
At the same time the limit strengths and evolve due damage in a non-linear way:
|
|
(238) |
where and are the damaged interface strengths for pure tension and pure shear conditions, respectively. Other definitions using fracture mechanics arguments can be found in [145,79].
(1) The term uncoupled means that the tension and shear failure criteria are independent of one another.
5.2.4 Elasto-plastic model for compressive forces
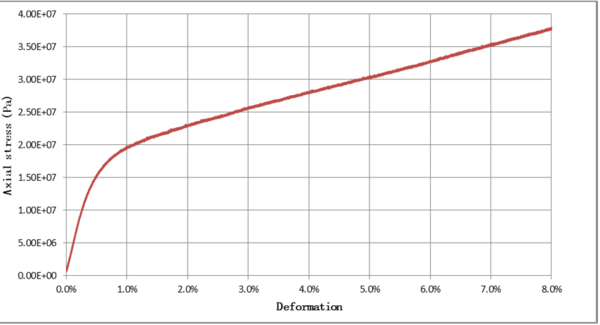 ] ]
|
| Figure 87: Normal compressive stress-axial strain relationship in a Uniaxial Strain Compaction test for a saturated cement sample. Taken from Oñate et al. [36] |
The compressive stress-strain behaviour in the normal direction for frictional materials such as cement and concrete is typically governed by an initial elastic law up to a limit defined by the compressive axial stress , followed by a non-linear elastic-plastic behaviour that varies for each material. An example is given in figure 87.
The common strategy in a DEM code is to phenomenologically identify the parameters that define a generic and simple non linear and plasticity law on the normal contacts [139]. Here, a simple model is introduced where the elasto-plastic relationships in the normal compressive direction are defined as:
|
|
(239.a) |
|
|
(239.b) |
where is the initial (elastic) compressive stiffness corresponding to the material Young's modulus , and is the tangent compressive stiffness given by:
|
|
(240) |
is the ratio between the original and the new apparent Young's modulus . Several consecutive branches can be introduced in the model based on the definition of the strength limits, denoted , in which the compressive stiffness changes its slope as depicted in figure 88.
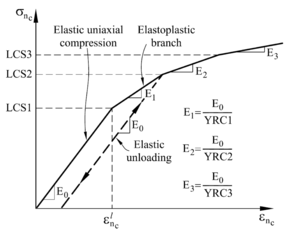
|
| Figure 88: Definition of the model parameters of the elasto-plastic model |
In the same way, the compressive stress limit at which the plasticity starts has to be also introduced. Normally it will coincide with the first change of slope introduced. After that point, the unloading follows the initial elastic slope instead of going over the non-linear loading path.
5.2.5 Post-failure shear-displacement relationship
A bond can break if the shear forces or normal forces in tension reach their respective strengths. In case of employing a damage law, the complete failure occurs when the maximum damage is achieved. After that point, the bond is no longer cohesive and the basic frictional contact is recovered from the LS+D model (section 2.5.1).
Figure 89 shows the evolution of the failure lines from the undamaged to the fully damaged state for the uncoupled model.
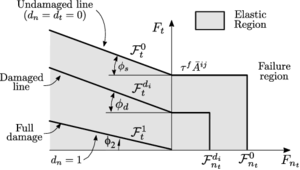
|
| Figure 89: Damage surfaces for uncoupled normal and shear failure |
5.3 Virtual Polyhedron Area Correction
This section describes a methodology to derive the contact areas in every bond such that the partition of space is fulfilled in a similar way as a Voronoi tessellation would do but in a very cheap and efficient manner. This provides an alternative to the global adjustment parameter (eq. 218) that the DEMpack model does in order to correct the overestimation of the bonding areas (section 5.2.1) which was found not to be accurate.
Contact parameters derivation
As a first step, the determination of the representative contact area in a bond is reviewed. The method proposes to obtain and from the respective equivalent axial and shear stiffness that corresponds to a truncated conical volume (figure 90).
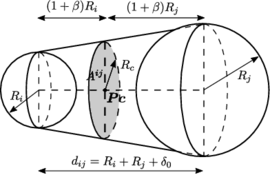
|
| Figure 90: Definition of the contact interface bonds in the Virtual Polyhedron method |
The derivation is as follows:
|
|
(241) |
A linear variation of the radius:
|
|
(242) |
yields to:
|
|
(243) |
Proceeding similarly, for the shear stress, the following is obtained:
|
|
(244) |
The contact area can be regarded as:
|
|
(245) |
and then, the stiffness parameters rewritten:
|
|
(246) |
The full derivation can be found in [146].
Virtual polyhedra
Obviously, the areas resulting from equation 245 yield to overlapping of the contact domains defined by the bonds linked to particle . The solution suggested here is to introduce a local correction (eq. 247) rather than the global factor proposed by the DEMpack model (eq. 218).
|
|
(247) |
The determination of a consistent area of interaction can be achieved by defining a portion of the plane centred at the contact point and normal to the line connecting two particles which is limited by the intersection with other contact planes (figure 91). These intersections lead to complex geometries that define irregular polyhedra of sides surrounding every particle. This would have the advantage that the partition of unity of the domain would be achieved by the associated volumes. However, the determination of these geometries and their respective area is an expensive calculation.
![Polyhedron associated to a particle. Taken from: De Pouplana [DePouplana2013]](/wd/images/thumb/0/0a/Draft_Samper_371275574-ignasi_poli.png/168px-Draft_Samper_371275574-ignasi_poli.png)
|
| Figure 91: Polyhedron associated to a particle. Taken from: De Pouplana [DePouplana2013] |
Trying to preserve the simplicity of the method, an approximation to this procedure is introduced. The idea is to approximate the irregular polyhedra of faces to a virtual regular one of the same number of faces and determine the total covered surface as the surface of the regular one. The assumption is that the total area of the resulting polyhedron is similar to the total area of its regular counterpart. It has been found numerically that the assumption of similar total surface between regular and irregular polyhedra enclosing an sphere is accurate.

|
| Figure 92: Platonic Solids, regular polyhedra. Taken from: Wikipedia |
| Polyhedron | Tetrahedron | Hexahedron | Octahedron | Dodecahedron | Icosahedron |
| Num. of neigh | |||||
| Surface area | |||||
| Ratio of areas |
The radius can be taken as when the initial configuration is not tangent.
| Polygon | Triangle | Square | Pentagon | Hexagon | Heptagon | Octagon | Nonagon |
| Num. of neigh | |||||||
| Ratio of areas |
| Polygon | Decagon | Hendecagon | Dodecagon | Tridecagon | Tetradecagon |
| Num. of neigh | |||||
| Ratio of areas |
Table 18 summarizes the values of the ratio between the surface of the existing regular polyhedra (Platonic solids, Figure 92) and the surface of the target sphere. Since the number of neighbours can be any, the rest of the values for the virtual polyhedra has to be interpolated. For academical purposes, the same is done for the 2D case with regular polygons in table 19.
First, the areas with every contact are normally calculated using equation 245. Then, the surface of the sphere is calculated with the radius of the particle (affected by ). The area of the equivalent virtual polyhedron (or polygon) is obtained by applying multiplying the sphere area times the corresponding ratio of areas in function of the number of neighbours. Finally the corrected areas of contact for every neighbour are determined applying the weighting value calculated as:
|
|
(248) |
There are several aspects of this methodology to take into account regarding its implementation:
- The contact between two particles and yield to different values of contact area and at each side. In order to respect Newton's Third Law, the mean of the two values can be employed.
- The particles situated at the boundaries are not completely surrounded by other spheres and need a special treatment. Details on this are given in [146].
- The corrected areas are calculated once at the beginning of the simulation and define the stiffness values of the contacts. In large deformation cases the areas could be recalculated.
- After failure of the bonds, the classic LS+D model employed needs to be defined with the same stiffness as in the cohesive model in order to avoid sudden change in the contact forces.
5.4 Numerical analysis of the cohesive model
The objectives of this section is to numerically analyse the DEM applied to the modelling of a continuum by means of doing simple tests and checking basic aspects of the method such as convergence, mesh dependency, etc. This will be done employing the formulation derived in section 5.3.
5.4.1 Area determination assessment
In this section several examples are performed in order to check whether the method proposed in section 5.3, the Virtual Polyhedron Area Correction, correctly estimates the area of the geometries.
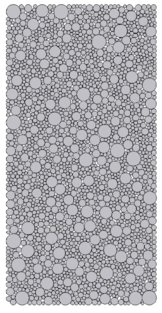
|
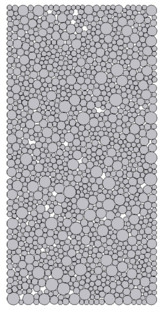
|
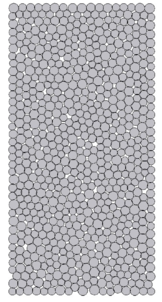
|
| (a) Mesh 2D-1 | (b) Mesh 2D-2 | (c) Mesh 2D-3 |
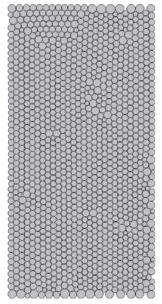
|
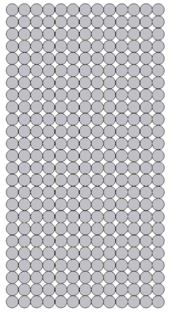
| |
| (d) Mesh 2D-4 | (e) Mesh 2D-5 | |
| Figure 93: 2D meshes used in the area determination analysis | ||
A rectangular geometry of width and height is meshed by 5 different meshes in 2D (figure 93) which range from a regular assembly of discs to a highly heterogeneous distribution of the particle radius. Theoretically, in every contacting pair a characteristic area in 3D, or length in 2D, (section 5.3) is assigned so that, in average, no overlaps are introduced (figure 94).
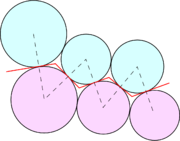
|
| Figure 94: Contact areas (lengths in 2D) associated to each contact |
In order to check how well is the area assigned to the contacts, the following strategy is done: several horizontal strips are determined defining groups of particles in contact. The total contact area between the particles of each group projected horizontally should match the transversal length (area in 3D) of the geometry. Several strips are set in order to average the values obtained. This is also done for two different 3D meshes of a cylinder of diameter and height.
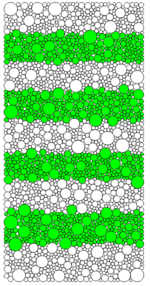
|
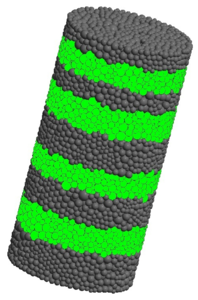
|
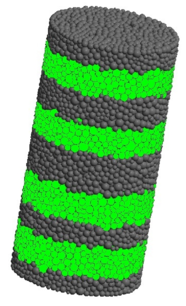
|
| (a) Strips defined in mesh 2D-1 | (b) Strips defined in mesh 3D-1 | (c) Strips defined in mesh 3D-2 |
| Figure 95: Examples of the strips defined in the meshes | ||
In the following table 20 the properties of each mesh are presented together with he numerical results of the total area evaluation on the interfaces.
| Mesh | 2D-1 | 2D-2 | 2D-3 | 2D-4 | 2D-5 | 3D-1 | 3D-2 |
| Num. of elements | |||||||
| Mean radius () | |||||||
| Rel. stand. Dev.(%) | |||||||
| Coord. number | |||||||
| Mesh porosity(%) | |||||||
| Num. area (,) | |||||||
| Relative error (%) |
Rel. stand. dev.: the ratio of standard deviation over the mean value. Coord. number: average number of neighbours per particle calculated as . Mesh porosity: the complementary of the volume fraction of particles in the mesh over the geometric volume.
The results are quite satisfactory since the main goal here was to obtain a method to weight the area assigned to the contacts in a way that the real geometry was respected. It can be stated that the Virtual Polyhedron Area Correction method is able to correctly determine the areas of contact for 2D and 3D cases involving homogeneous and heterogeneous meshes.
5.4.2 Linear elasticity assessment
As explained in section 5.1.5, the given expressions for and are not universal to irregular meshes even if the area correction (section 5.3) is applied. Instead, a calibration procedure is needed [101,139,136].
In order to study the capabilities of the presented simple linear model, a parametric study is performed with a linear combination of the stiffness parameters:
|
|
(249) |
with and varying in the range:
|
|
(250) |
A simple uniaxial compression is applied to each of the 2D meshes presented in figure 93. The linear elasticity relations read:
|
|
(251) |
Assuming uniform stress and strain in the complete model, the measure for a macroscopic Young's modulus output and Poisson's ratio can be obtained from the measured quantities as:
|
|
(252) |
The test is performed introducing as input: and . The output macroscopic values of and are measured for the different combination of and .
Young's modulus results
Poisson's ratio results
Results of Poisson's ratio of mesh 2D-5 have not been included since that mesh yields a value in any case.
From the results the following can be concluded:
- It seems that the correct value of the Young's modulus is asymptotically recovered when the tangential stiffness becomes larger for every mesh. This is a consequence of the correction of areas which ensures that the static forces are well calculated in the undeformed system formed by linear springs (weighted by the areas).
- There is a linear correlation between the local value and the global stiffness of the model as it was expected in small deformations.
- The values of have no influence on the output Poisson's ratio.
- Given a mesh and a value of such that the correct Poisson's ratio measure is obtained, there exists a value of in the range of which recovers the correct macroscopic behaviour in terms of Young's modulus.
- The output Poisson's ratio can result in non feasible values greater than .
- The meshes with higher heterogeneity of radius yield higher Poisson's ratio. Mesh 2D-2 yielded a for .
- The values of Poisson's ratio seem to converge to some value near zero (which can even be slightly negative) when the value of increases.
- The values obtained for yield a good aproximation of the Poisson's ratio for all the meshes except for mesh 2D-5 which obviously yields a null Poisson's ratio.
Even though the ratio has influence on the output , it is clear that the range of values is given by the geometrical assembly of the particles and thus, is totally mesh dependent. It seems a good strategy to choose a high value of , or in the limit, restrict the tangential displacement in the contacts, in order to recover the exact Young's modulus value with no need of calibration (). This yields to a null or negligible Poisson's ratio. Then, the desired Poisson's ratio could be recovered by enforcing the equations of linear elasticity in the bonds that are formed arround every particle.
5.4.3 Mesh dependency
The mesh dependency has been already shown (section 5.4.2) also for the simple case of linear elasticity where, given the same micro parameters ( and ), different macro parameters ( and ) were measured. Figure 98 shows an example of the previous parametric study.
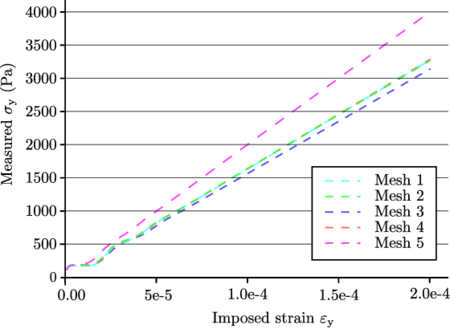
|
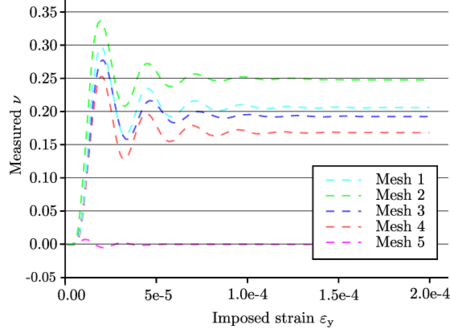
|
| (a) Stress-Strain plot for all 2D meshes | (b) Poisson's ratio plot for all 2D meshes |
| Figure 98: Output Young's modulus and Poisson's ratio for the 2D meshes using and | |
In this case the vertical strain was imposed. The measure of is done macroscopically, tracking the position of the particles with respect to its initial position. The measure of stress, is done by evaluating the forces that the top and bottom particles receive.
5.4.4 Convergence
In the article by Sfer et al. [143] experimental curves for a UCS test on concrete specimens are reported. Oñate et al. [36] have reproduced the results using the DEMpack model. This is the example chosen to analyse the convergence of the cohesive model presented. The parameters of the simulation are detailed in section 5.5.
The convergence analysis will be done from three perspectives: Number of elements, time step, and quasi-staticity.
Convergence in the number of elements
In the introduction, it has been discussed on whether the DEM is or not a discretization method. A property of a FE discretization is its convergence in the number of elements. A similar analysis is performed here with DEs to draw conclusions on that aspect. The following meshes are used:
| Mesh | |||||||
| Num. of elements | |||||||
| Mean Radius () | |||||||
| Coord. number |
In order to have a fair comparison, different time steps have to be used for each mesh since their stability limits depend on the size of the particles. The estimation of the critical time step is based on the highest frequency of the system. The dependency of the frequency on the size of the particle can be easily derived for the case of a bond between two identical particles:
|
|
(253) |
simplifying for :
|
|
(254) |
The ratio of time steps relates to the ratio in the number of particles in the following way:
|
|
(255) |
The time step is linearly proportional with the radius of the smaller spheres in the mesh and therefore inversely proportional to the cubic root of the number of particles in the mesh. Taking the mesh as the reference one, with a , the others were scaled accordingly.
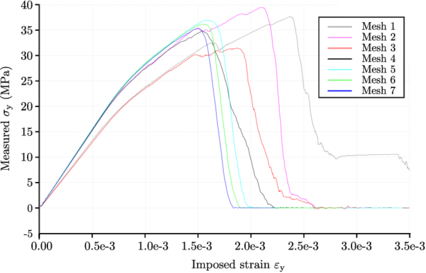
|
| Figure 99: Convergence analysis for the number of particles in the discretization |
Although the results seem to converge by increasing the number of elements, its monotony and order of convergence for the variables of interest such as the yield stress are difficult to determine. The visualization of the results and the cracks tracking is obviously better defined for finer meshes (see figure 107).
Convergence in time step
The value for the critical time step for the reference mesh is of: . The following values have been used in the analysis: .
The results (figure 100) corroborate that a time step slightly lower than the critical one () is not enough for the stability of the system. However, the calculation is stable for a time step of , which is approximately the value resulting after the application of the safety value (section 2.6.4).
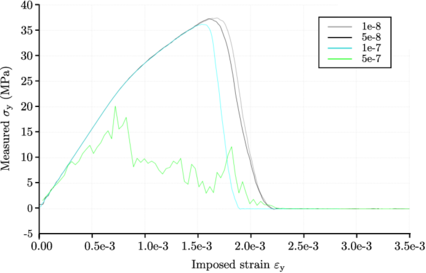
|
| Figure 100: Convergence analysis for the time step selection |
The solution does converge when the time step is smaller as shown in figure 100.
Convergence in quasi-staticity
The explicit formulation of the DEM is naturally conceived to solve dynamic problems. However the quasi-static conditions of the tests can also be simulated by imposing displacements and tracking the resulting forces. The quasi-static brittle fracture of a concrete specimen subject to a uniaxial compressive test reported in Sfer et al. [143] have been simulated. The mesh used for this analysis is the mesh previously used. A few special considerations have to be done:
- The experimental loading velocities are of . At this velocity the real experiment takes minutes to reach the desired failure deformation around . Using the selected stable time step , a number of time steps would be required at that velocity which is obviously not feasible and thus, the velocity of the simulation has to be drastically incremented.
- Extra damping is needed in quasi-static simulations in order to kill the dynamic effects. In this sense, the restitution coefficient is set close to zero, , killing all the local contact unbalanced forces.
- The non-viscous global damping (section 5.2.2) will be employed to reduce the total unbalanced forces resulting in every particle. A value of is used in the analysis.
- The mass of the particles can be also modifiable since the accelerations are not an interesting result in a quasi-static simulation. In a dynamic analysis however, the porosity of the mesh should be taken into account and increase the mass associated to the particles that compose the simulated body. In this particular analysis the mass value has not been modified.
The reference experimental data in [143] corresponds to a loading velocity of . The simulated loading velocities have been: . This particular case has been designed with no damage in the constitutive law in order to check if the model can reproduce the brittle behaviour.
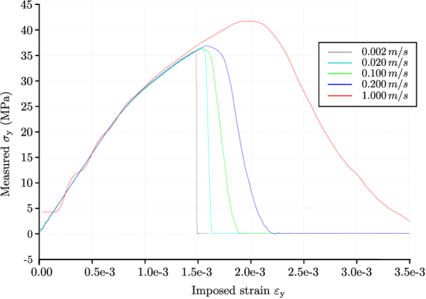
|
| Figure 101: Convergence analysis for the loading velocity |
The results clearly show that the loading velocity has influence on the results. The elastic part is well calculated even for the case, where the dynamic effects appear in shape of elastic waves produced by an excessively fast loading. The failure however, gives higher peak values and higher deformation ranges for the high velocity cases yielding to a ductile behaviour. On the other hand, the slowest case of yields a extremely brittle behaviour matching the laboratory results.
5.4.5 Stress evaluation and failure criteria
The phenomenological approach is widely used in the simulation of cohesive materials using the DEM. The failure parameters of a given model have to be calibrated by performing different typified tests and tuning the parameters that fit the experimental curves [139]. The methods considered in most of the cases however, which are based on unidimensional failure criteria on the contacts, do not suffice to represent the real behaviour of the failure mechanisms in the continua.
To show this idea, a simple test has been performed involving a cylindrical concrete specimen discretized by DEM particles subjected to a hydrostatic pressure simulating the hydrostatic load stage prior to a the deviatoric loading in a triaxial test. A variable denoted failure criterion state (FCS) has been used to indicate how close to failure is a bond under the criteria detailed in section 5.2.3. The value is calculated as:
|
|
(256) |

|
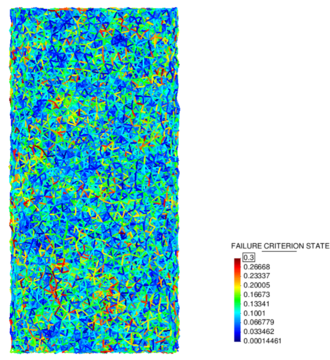
|
| (a) Hydrostatic loading in a speciment | (b) Failure criterion state plot on bonds |
| Figure 102: 3D cylindrical specimen meshed with spheres under the hydrostatic loading stage of a triaxial test | |
Figure 102b shows the values of FCS ranged plotted in linear elements connecting the centres of the particles which simulate the bonds. It can be seen that, in some contact elements, values near the of the failure criterion have been reached. The results correspond to the end of the hydrostatic loading of a triaxial test where a confinement of MPa has been reached. The fact that some contacts are already closer to the failure contradicts the real effect of the confinement which pushes the failure point further.
The problem is obviously that the contact only captures the confinement in one direction, the normal one. A possible way to improve this is the development of failure criteria based on the real three-dimensional stress and strain states in the continuum. This can be achieved by averaged measures of strain and stress tensor in the vicinity of the particles. The definition of these average stress and strain tensors is widely discussed in literature for granular materials and discrete media [147,148].
5.5 Practical application in a project=
One of the projects carried out within the scope of this monograph is presented here. Weatherford Ltd. company was interested in numerically reproducing the typical tests carried out in a material laboratory with concrete-like specimens in order to validate the cohesive DE model.
The DEMpack model was used to model the behaviour of these materials which can range from brittle to ductile depending on the confinement conditions. After some calibration work, the model is able to predict the failure and the strain-stress evolution in different cases.
A specific user interface specially devised for the numerical simulation of laboratory tests have been developed and used for the project: the Virtual Lab. It is introduced in section 6.1.4.
5.5.1 Triaxial and Uniaxial Compressive Tests on concrete specimens
The experimental tests were carried out at the laboratories of the Technical University of Catalonia (UPC). Details on testing are given in [143]. The concrete used in the experimental study was designed to have a characteristic compressive strength of MPa at 28 days. Standard cylindrical specimens (of diameter and height) were cast in metal molds and demolded after 24 h for storage in a fog room.
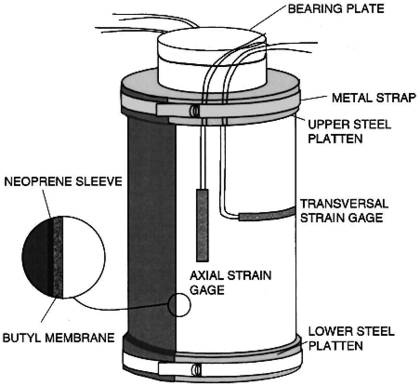
|
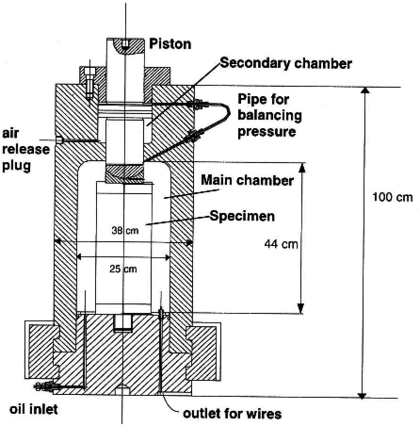
|
| (a) View of the testing device | (b) Seccion of the testing device |
| Figure 103: Display of the triaxial experiments in the laboratory. Taken from: Sfer et al. [143] | |
The triaxial tests were prepared as shown in Figure 103, with a 3-mm-thick butyl sleeve placed around the cylinder and an impermeable neoprene sleeve fitted over it. Before placing the sleeves, two pairs of strain gages were glued on the surface of the specimen at mid-height. Steel loading platens were placed at the flat ends of the specimen and the sleeves were tightened over them with metal scraps to avoid the ingress of oil. The tests were performed using a servo-hydraulic testing machine with a compressive load capacity of and a pressure capacity of MPa. The axial load from the testing machine is transmitted to the specimen by a piston that passes through the top of the cell.
Several levels of confining pressure were used in order to study the brittle-ductile transition of the response: , , , and MPa. First, the prescribed hydrostatic pressure was applied in the cell, and then the axial load was increased at a constant displacement rate of .
5.5.2 Description of the material model
The model employed is the DEMpack model, described in section 5.2. Table 22 shows the DEM parameters for the UCS and triaxial tests for confining pressures of , , , and MPa.
| () | (GPa) | (MPa) | (MPa) | ||||||
| LCS1 (MPA) | LCS2 (MPa) | LCS3 (MPA) | YRC1 | YRC2 | YRC3 | ||||
The value of the shear failure stress and the internal friction angle have been estimated as Mpa and using the procedure described in section 5.2.3. The Coulomb friction coefficient has been estimated from numerical tests as . The tensile strength is deduced from the flexural test as Mpa which translates into a value of MPa in the BTS test. This assumption has been validated numerically.
The parameters denoted LCS are limits in the compressive normal local stress where the elastic-plastic curve changes its slope and YRC are the values of the reduction of the normal stiffness as described in section 5.2.4. These together with the factors and , defining the damage model, have been determined by adjusting the curves to the experimental data in a phenomenological characterization procedure [139,36].
5.5.3 Simulation procedure
The simulation of a triaxial test within the DEM reproduces the experiment as follows:
- The confining pressure is applied up to the desired hydrostatic testing pressure.
- A prescribed axial motion is applied at the top of the specimen until this fails, or until the axial compressive strain reaches a desired amount of strain while the confining pressure is held constant.
The confining pressure in the numerical model is directly applied to the spheres that lay on the surface of the specimen. A normal force is applied to each surface particle in the radial direction and vertical direction respectively to the lateral particles and the ones on the top and bottom. The magnitude of the force is computed as where is the confining pressure. The factor adjusts the areas in order to ensure that the total application area of the pressure matches the total surface of the geometry.
For the Uniaxial Compressive Strength (UCS) and the Brazilian Tensile Strength (BTS), the process starts by step (b) with zero confining pressure. Further details can be found in [36].
5.5.4 Comparison of numerical and experimental results
Triaxial-500-1000-confining,Triaxial-500-2000-confining show the stress-strain curves obtained for the Triaxial tests for confining pressures of , , and MPa while figures 106 and 108 show the results for the Unixaial Compressive Strength (UCS) and the Brazilian Tensile Strength (BTS) tests using the DEMpack model.
The generation of the samples and the set up of the conditions was done using the so called Virtual Lab module (section 6.1.4) of the DEMpack software in a mesh of approximately spheres for all cases except the BTS which was performed using a slightly larger mesh of approximatelly spheric particles.
The results have been reported in the article by Oñate et al. [36] showing good agreement with the experimental values reported in [143].
Triaxial tests
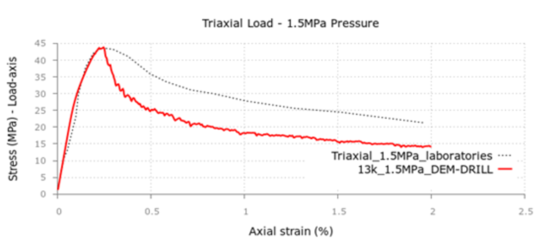
|
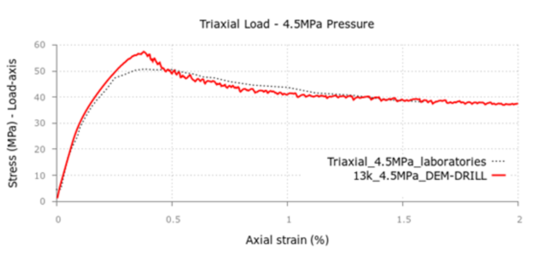
|
![Triaxial test on concrete samples with 1.5 MPa, 4.5 MPa and 9.0 MPa confining pressure. Experimental results in [143] versus DEM results for 13 \,k. Taken from: Oñate et al. [36](/wd/images/thumb/5/52/Draft_Samper_371275574-9.png/540px-Draft_Samper_371275574-9.png) ] ]
| |
| Figure 104: Triaxial test on concrete samples with 1.5 MPa, 4.5 MPa and 9.0 MPa confining pressure. Experimental results in [143] versus DEM results for . Taken from: Oñate et al. [36] | |
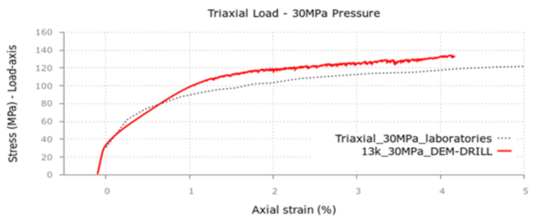
|
![Triaxial test on concrete samples with 30 MPa and 60 MPa confining pressure. Experimental [143] versus DEM results for 13 \,k. Taken from: Oñate et al. [36](/wd/images/thumb/0/0b/Draft_Samper_371275574-60.png/540px-Draft_Samper_371275574-60.png) ] ]
|
| Figure 105: Triaxial test on concrete samples with 30 MPa and 60 MPa confining pressure. Experimental [143] versus DEM results for . Taken from: Oñate et al. [36] | |
Uniaxial Compressive Strength test
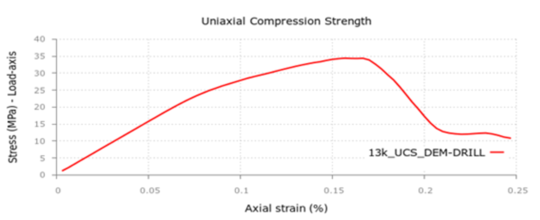 ] ]
|
| Figure 106: Uniaxial Compressive Strength (UCS) test on concrete sample. DEM results for the 13k mesh in KDEM. Taken from: Oñate et al. [36] |
Brazilian Tensile Strength test
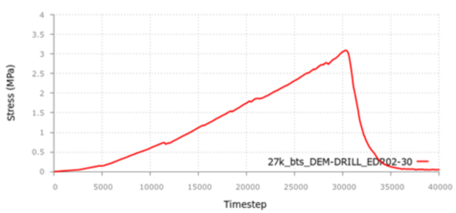 ] ]
|
| Figure 108: Brazilian Tensile Strenght test (BTS) on concrete sample. DEM results for the mesh in KDEM. Taken from: Oñate et al. [36] |
5.6 Cohesive DEM flowchart
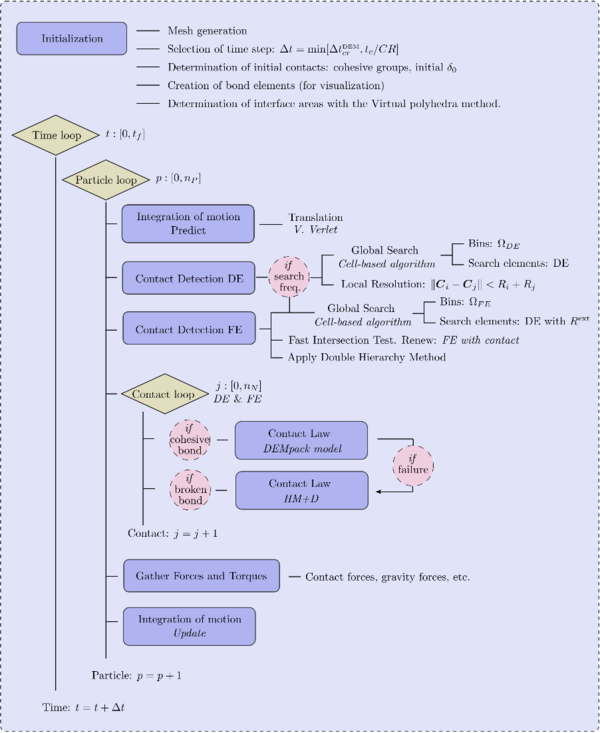
|
| Figure 110: Basic flowchart for the cohesive DEM |
6. Implementation and examples
6.1 DEMpack
DEMpack (www.cimne.com/dem) is a DEM-based software developed within the framework of the open source code Kratos Multiphysics (www.cimne.com/kratos). It consists of an open-source code under BSD license written in a hybrid Python/C++ language together with packed GUI's developed for specific problems.
The DEMpack project started at 2012 with the begging of this monograph and the number of the DEM code developers has been increasing ever since forming now a group of 5 core people plus contributions from other collaborators. As part of the monograph objectives, all developments presented in this document have been implemented in the DEMpack code and are available to any user or developer.
6.1.1 Code structure
The DEMpack code is integrated in the KratosMultiphysics framework (or Kratos) [149] which is a platform for the development of multi-disciplinary FE-based codes. Kratos provides a common data structure to all the different applications. In this sense, it facilitates the combination of applications. In this work the coupled DE-FE procedure benefited from several developments already implemented in the solid mechanics application of Kratos. Apart from that, the Kratos core provides built-in utilities common in FE-codes and high performance tools to be used in any application.
The main script of the DEMpack code is written in python language. It reads the input files, sets the simulation properties, launches the calculation and writes the output files. It has an interface connecting to the core functions of the code (which is written in C++) giving a high flexibility and permitting the performance of a lot of analysis and control operations. The files that constitute the core of the DEM application are structured in different modules in the following way:
0em
- Strategies: are the main scripts which define the workflow of the calculation. Every problem has its own specific strategy: discontinuum DEM, coupled DE/FE, cohesive DEM, coupling with fluid, etc.
- Elements: define the particle properties and the contact characteristics, specify the necessary variables to consider and determine how the forces and torques need to be calculated. Some of the existing elements in the code are the basic discrete spherical element, the cohesive spherical element, the DE/FE element and other special elements for the fluid coupling, thermal coupling etc.
- Utilities: are the different tools necessary in the DEM algorithm such as contact detection, energy calculations, creation and destruction of particles in inlet and outlet regions, geometrical operations, visualization and post-process utilities, etc.
- Integration schemes: Several explicit schemes are available to integrate the movement of the particles and clusters.
- Contact constitutive laws: the interaction of particles is trough specific contact laws which defined here such as the LS+D, HM+D, etc.
- Conditions: are entities used to apply contact or other kind of boundary conditions. In case of contact with FE, the contact conditions are the surface elements forming part of the FE mesh.
6.1.2 Levels of usability
The DEMpack code, as an open-source code can be accessed at different levels depending of the type of user as described in the following figure 111:
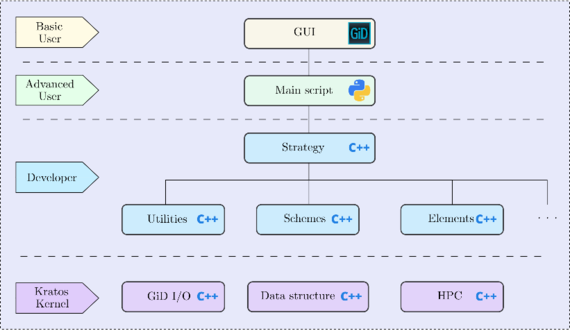
|
| Figure 111: Usability levels of the DEMpack code |
All the capabilities and developments are integrated in a user-friendly GUI which can be used by engineers to perform a DE or DE-FE combined analysis. An overview of the interface is found in next section 6.1.3. For special operations and higher control of the algorithm, the advanced user can interact with the python interface which has access to most of the functions of the code and requires a very basic coding knowledge. In a higher level of complexity, developers can access to the core of the application and modify or extend it as they please. More and more developers join the Kratos community bringing new developments and capabilities to the code. The documentation online (http://kratos-wiki.cimne.upc.edu) and the help from the Kratos community in the forums provide support to the development of the new users' applications.
6.1.3 Combined DEM-FEM user interface
As an output of the developments of the monograph a user interface integrated in the GiD pre and post-processor has been generated in collaboration with the rest of the developers forming part of the DEM Team. The so called Solid-DEM interface is an extension of the basic DEM interface of the DEMpack software which permits the assignment of all conditions and properties necessary for a basic coupled DE-FE analysis.
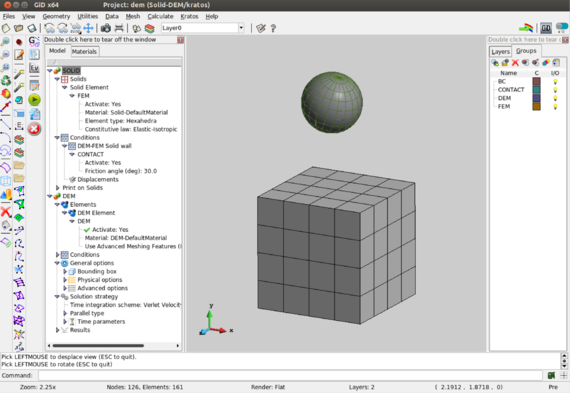
|
| Figure 112: Overview of the coupled DE-FE user interface of DEMpack |
The example in figure 112 shows the basic menu of the interface which is divided in the SOLID and DEM part. Regarding the solid part, the material properties and constitutive law can be defined as well as the type of elements needed for the calculation. The contact conditions are assigned to the surface where contact is expected to happen and classic boundary conditions can also be applied. To the DEM part, the properties of the material, the contact law to be used and other boundary conditions are applied to the particle meshes. The general options allow the inclusion of bounding boxes limiting the domain of the calculation, the introduction of gravity and use of other advanced features. Simulation parameters such as the time step, the integration scheme, the neighbour searching frequency etc. can also be defined here. Finally, the selection of results for the visualization are available for both DEs and FEs.
6.1.4 The Virtual Lab
The Virtual Lab is a wizard based on the GiD pre and post-processor which interacts with the DEMpack code through the basic DEM user interface of DEMpack. It was developed by the DEM team of CIMNE in collaboration with the Quantech company. This tool was developed in the context of a project with Weatherford Ltd. company which was interested in performing simulations with several cohesive materials using the DEMpack model. Detailed information of this aspect can be found on the author's master monograph [146].
The wizard automatically sets all the options and parameters needed for the simulation of material tests, it loads predefined meshes and automatically assigns the material properties and conditions to the mesh elements. It guides the user, step-by-step, through the preparation of the laboratory tests presented in section 5.5.1. The available tests in the wizard are the following:
0em
- Uniaxial Compressive Strength Test
- Triaxial Compressive Test
- Hydrostatic Loading Test
- Oedometric Test
- Brazilian Tensile Strength Test
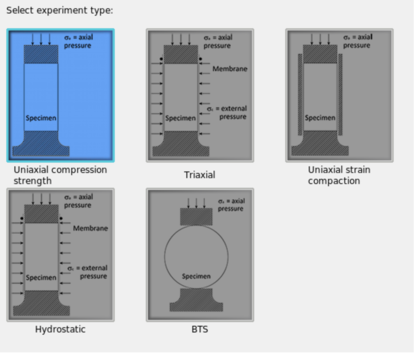
|
| Figure 113: Selection of the type of experiment in the wizard |
The definition of a new case starts with the selection of the test as shown in figure 113 to later selected a predefined mesh and geometry of the specimen (figure 114).
Next, the material properties and the parameters of the DEMpack model (section 5.2) are defined (figure 115).
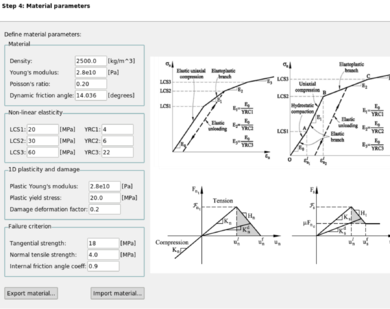
|
| Figure 115: Definition of the material parameters in the wizard |
The calculation settings such as duration of the simulation, loading velocity of the plates, applied pressure (for triaxial and hydrostatic cases) and the calculation time step are selected in a next step as depicted in figure 116. Finally, the user can select which variables are of interest for the post-process of simulation as shown in figure 117.
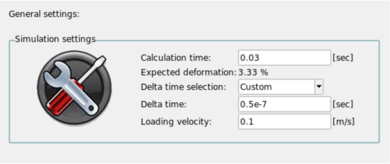
|
| Figure 116: Definition of the general settings in the wizard |
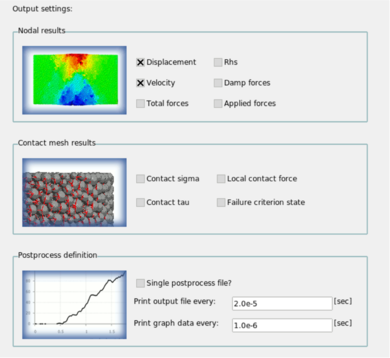
|
| Figure 117: Selection of the output results in the wizard |
The last step is to run the simulation selecting the parallelization type (figure 118).
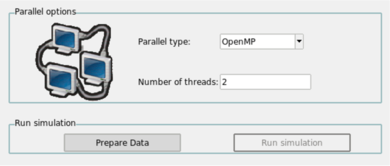
|
| Figure 118: Preparation of data and run |
The post-process is automatically generated as well as the stress-strain graphs such as the ones presented in section 5.5.4.
6.2 Performance
It is of capital importance for a DEM code to be efficient in terms of computational cost since it constitutes a expensive method that usually requires the use of large number of elements to obtain meaningful results. All the developments have been performed with concerns on efficiency and memory storage as well as possibility of parallelization of the different procedures.
6.2.1 Parallelization
A Discrete Element Method code without parallelization has a very limited use in practice. The explicit DEM performs independently for each particle: the neighbouring search, the force calculation and the integration of motion. The parallelization of these steps can be done in a relatively easy way.
There exist two types of remarkable architectures for multiprocessor computing (figure 119), the Shared Memory Machines (SMM) and the Distributed Memory Machines (DMM). In computer science, Distributed Memory refers to a multiple-processor computer system in which each processor has its own private memory. Computational tasks can only operate on local data, and if remote data is required, the computational task must communicate with one or more remote processors. In contrast, a Shared Memory multi-processor offers a single memory space shared by all processors.

|
| Figure 119: Cluster of Distributed Memory Machines. Taken from: Google Images |
OpenMP parallelization
The suitable technique for SMM is Open MP (Open Multiprocessing); it permits parallelizing the loops of the process by using compilation directives so that the loops are split into different sets that are calculated in the different CPU of the same computer. OpenMP runs on a shared memory system so most of the personal computers would permit parallelizing the calculation and saving time. The code runs in serial until a parallelizable loop is found, runs then the loop in parallel and afterwards, reverts back to serial. In this sense OpenMP works fine if every unit step of the loop (normally a loop over the particles) is independent from the others and the parts in serial represent a very small part of the computation. In section 6.2.2 a scalability test using OMP is performed.
MPI parallelization
For DMM architecture the suitable technology is the MPI (Message Passing Interface); this would permit running a case, usually with large number of particles in a computer cluster where hundreds, thousands or more CPUs intervene in the calculation. Within MPI the entire code is launched on each node which would store the data in its own memory. The transfer of information and the synchronization of the calculation can be controlled. It is also possible to combine MPI with OpenMP to get the best of every technology and adapt to the specific architecture of each cluster.
In the developments of the DEMpack code a first version of MPI parallelization for the basic discontinuous and for the cohesive DEM was acquired and the results were promising. There is however, a lot of work currently ongoing on this topic, also in the topic of parallelizing via MPI a combined DE-FE problem which gets much more involved in terms of communication as the case of only DEs.
The MPI implementation includes not only the communication between the computing nodes but also the rebalancing of particles associated at each node in order to avoid that a processor has a workload much larger than others in which case the performance decreases drastically.
Figure 120 shows an example where the rebalancing is done dynamically as the simulation evolves. The colour in each particle indicates in which processor it is being handled; it can be seen that the particles move from one processor to another one while the simulation evolves in order to minimize the communication between processors and keep the workloads balanced.
6.2.2 Helical mixer example
In order to evaluate the overall method behaviour, the simulation of a particle mixer has been carried out. The model represents a rotatory mixer where contact occurs between DEs and the three different FE entities (facets, edges and vertices) of the boundary mesh composed by triangular and quadrilateral elements. Additionally, the simulation has been used to evaluate the parallelization behaviour.
Description of the simulation

|
| Figure 121: Geometry of the helical mixer. Distances in meters |
| Material properties | Calculation parameters | ||
| Radius () | Rotation vel. () | ||
| Density () | Gravity () | ||
| Friction coeff. DE/DE | 0.50 | Time step () | |
| Friction coeff. DE/FE | 0.75 | Neighbour search freq. | |
| Young's modulus () | Simulation time (s) | ||
| Poisson's ratio | 0.2 | ||
| Rolling friction coeff. | 0.001 | ||
| Restitution coeff. | 0.4 |
Fig. 121 shows the geometry of the mixer, figs. inini and 122e show the initial and final arrangement (after 20 seconds) of the particles respectively and finally, fig. trimtrim shows the triangles used in the mesh and and quadquad the quadrilaterals. The simulation is performed with a mesh composed by 29559 DEs, 848 triangular FEs and 1600 quadrilateral FEs. The material properties and simulation parameters used are described in table 23. Additionally, in this test, some rolling resistance moment has been added to model the particle irregularities. The contact between the DE and the rigid FE is evaluated by the method. The contact law used was the HM+D.
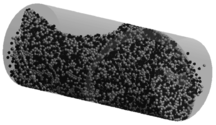
| |
| (d) Spheres arrangement after 20 s. | |
| Figure 122: Mesh used in the horizontal rotatory mixer and simulation results | |
Code performance in serial
The DEMPack code was tested in a machine with an Intel Xeon E5-2670. It took 29 hours, 20 minutes and 30 seconds in serial to run 20 seconds of simulation which comprehend 400000 time steps. Some results on the performance of the code are presented in Table 24. In this specific case, which involves approximately DE and FE, it can be seen that the calculation effort for DE/FE contact search represents about the of the total CPU time. The results showed that by splitting the Fast Intersection and the Method the code turned to be faster which is a significant improvement for this case, where most of the contacts are DE/DE rather than DE/FE. It can be also seen that the cost of the Method is very low (only ) when the split is applied.
| Split Fast + | Direct Method | |
| DE/DE Contact Search | ||
| DE/FE Contact Search | ||
| - Create Bins and others | ||
| - Fast Intersection | - | |
| - Method | ||
| Total time | s | s |
Code performance in parallel
Graphs in fig. 123 show the code performance using an OpenMP parallel computing strategy. Based on the results it can be concluded that, despite being the speedup far from the ideal linear case, the fact that the contact check algorithm is totally parallel helps to the performance.
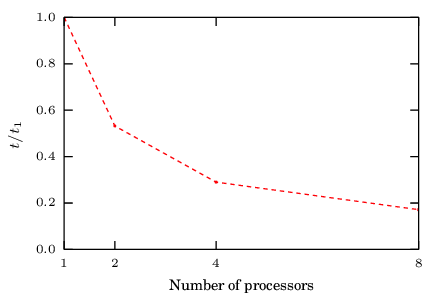
|
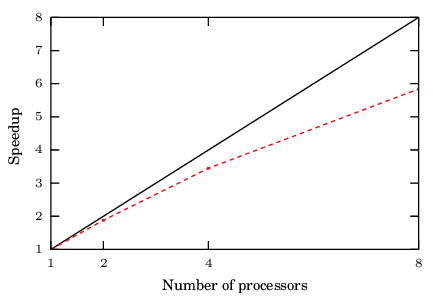
|
| (a) Simulation time reduction | (b) Scaling factor compared to the ideal curve |
| Figure 123: Scalability test results on the helical mixer | |
6.3 Application examples
The possible applications of the developments presented in this dissertation are shown through several academical examples.
Screw conveyor
An example of industrial application of the DE involving large amount of particles is presented here (figure 124). The rigid structure presents non-smooth regions (vertices and edges) contacting with the particles.
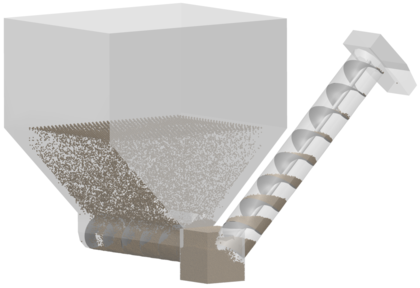
|
| Figure 124: View of the screw conveyor handling the particles |
The model has an inlet which inserts particles and a bounding box delimiting the domain after which the particles are eliminated, the particle while
Membrane elements
The implementation of the coupled between the DE and the FE solver is flexible in the sense that the coupling is effective through the communication of contact forces between the two domains, from the particles to the FE nodes. This can be applied to any solid or structural element present in the computational solid mechanics code used, which in this case is in the Kratos platform. An example of combination of a particle DEM with structural elements such as membranes is shown in figure 125.

|
| Figure 125: Sphere impacts a membrane |
Cluster particles with membrane elements
Previously in section 5.5, the triaxial laboratory tests on concrete specimens were simulated applying the pressure as an external normal force on the surface particles. A more realistic approach is needed in cases where the samples are formed by a non cohesive granular material such as the ballast particles presented in figure 126. In this case, the use of a membrane, simulating the real experiment conditions, is necessary to keep the sample compact and to properly apply the pressure on the particles which relocate along the simulation. This example has been run by Irazábal [72] with DEMpack reproducing the experimental results in [150].
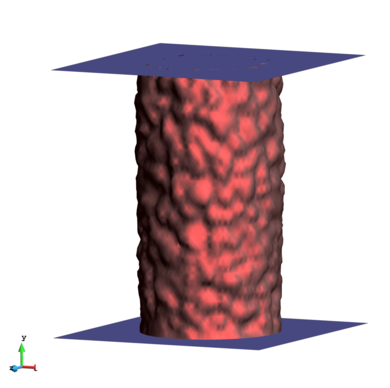
|
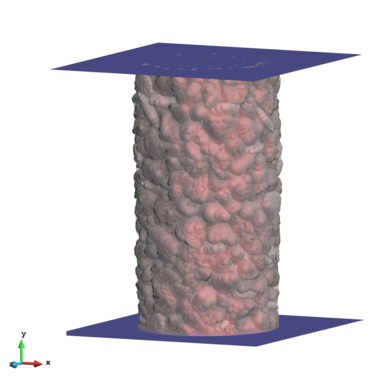
|
| (a) View of the membrane | (b) View of the clusters |
| Figure 126: Triaxial test on a ballast sample modelled with sphere clusters and membrane elements | |
Cluster particles with solid elements
A structure simulating the tread of a tire is presented in figure 127 which interacts with a stone modelled by a cluster of spheres. This type of analysis could be conducted to analyse the effect of stones catching of different tire designs as well as the damage induced to them.
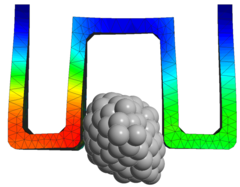
|
| Figure 127: Stone catching in a tire tread |
Impact with plasticity
One of the possible application fields is the simulation of shot peening which is a cold working process that aims to improve fatigue strength of metallic parts by bombarding its surface with small (generally) spherical shots. Details in terms of residual stresses and plastic strains are of interest and can be studied using a coupled DE/FE procedure [24,25]. Just serving as a demonstration of capabilities, figure 128 shows a metal sheet which is being shot by particles at different direction and velocity producing plastic deformation and local residual stresses in the metal.
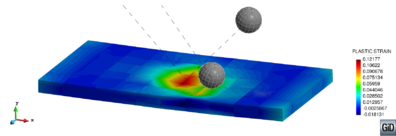
|
| Figure 128: Visualization of the plastic strain in a metal under a shot peening process |
7. Conclusions and outlook
Within this work, a multi-purpose parallel 3D Discrete Element Method code has been developed and implemented in the so called DEMpack software to be used by the CIMNE researchers in industrial applications. The theoretical developments of the monograph have covered the topics of granular material simulation, cohesive material models and the interaction of particles with rigid and deformable structures. The conclusions from every aspect tackled in the dissertation are summarized in the following lines.
Two main contact laws have been analysed to be used for the DE-DE and DE-FE interaction, the linear spring dashpot model (LS+D) of Cundall and Strack [2] and the Hertzian model (HM+D) from Thornton [54], adapted from the original by Tsuji [58]. These models have been selected after a thorough bibliographic revision due to its popularity and the balance between simplicity and accuracy that they present in both elastic and inelastic collisions. It has been appointed that the HM+D is the one that has to be used when the contact dynamics are to be well captured while any of the two models can be used as a mere penalty method in other situations where the contact details are not of capital importance and faster computations are required.
The use of explicit integration methods prior to implicit ones has been justified for the dynamic character of the method in the granular material problems that have been addressed. Several explicit one-step schemes have been tested in different situations in terms of accuracy, efficiency and stability being the Velocity Verlet scheme selected as the most advantageous one. It remains to be seen under which conditions can an implicit integration algorithm be advantageous in cases of quasi-staticity calculations as the ones presented in chapter 5.
The integration of rotations showed to require higher order integration schemes to achieve similar a level of accuracy. To do so, a RK-4 scheme proposed by Munjiza [92] has been adapted to quaternions in order to improve its efficiency. By doing so, the computational cost of the scheme is drastically reduced and the storage of the rotations is performed with less than half of the memory compared to the original algorithm which operates with rotation matrices.
It has been remarked, still in chapter 2, that the stability of the DE simulation can not be achieved simply by ensuring the explicit scheme stability. The use of the contact resolution concept has been suggested.
In chapter 3 a new contact detection algorithm, the Double Hierarchy Method, recently published by Santasusana and Irazábal [104] has been presented. The method has been designed to be accurate, robust and efficient, placing special attention to non-smooth contact situations, multi-contact and cases where the DEs and FEs sizes differ considerably or cases where the relative indentation between them can be significantly high. This method can be used with different types of contact FEs providing a high level of accuracy in terms of contact force continuity in inter-element FE transitions and allowing multi-contact scenarios with high mesh independence and low effort. It has been designed to make it easy to implement and adapt to an existing DEM code. In addition, the algorithm has been conceived to be fully parallelizable, something essential in order to allow the calculation of real cases with a great amount of discrete and finite elements.
The DE-FE contact detection is split into two stages: Global Neighbour Search and Local Contact Resolution. Furthermore, the Local Contact Resolution level is split into two phases. The first one, the Fast Intersection Test, aiming to determine which FE are in contact with each DE, discards in a efficient manner all the FEs not contacting the DE. Once the FE with contact are known, the second phase, the Double Hierarchy, takes place in order to accurately calculate the contact characteristics and to remove invalid contacts.
The accuracy and robustness of the proposed algorithm has been verified by different benchmark tests. An industrial example is also presented to show its computational efficiency and test its parallel behaviour. Having in mind that in a shared memory parallelization the performance is limited by the amount of serial parts of the code, the possibility to parallelize an important part of the code, such as the contact detection, allows the computation speed to scale up. The results proved that the split of the Local Resolution into a Fast Intersection and the Double Hierarchy Method greatly improves the overall performance.
The description of the method has been complemented with its limitations which are basically in the normal contact force in cases involving concave transitions and in the tangential force when a particle slides across different FEs. The errors are quantified and a solution is given to the case of the tangential force. Notwithstanding those limitations, it can be concluded that the method presents superiority in several aspects compared to the other DE-FE contact detection algorithms available in the bibliography.
The coupling between the DE method and a solid mechanics problem has been described in chapter 4. The presented algorithm consists in calculating separately the two domains which communicate through the contact forces. The detection of contacts is carried out by the method and the evaluation of the forces is done on the "FE side" by adapting the HM+D law to the case of DE-FE contact. The key point of discussion in the chapter is the way the forces are communicated from the DEs to the nodes of the FEs. A new method is developed which distributes the forces into all the elements involved in the contact weighted by the intersection areas of the particle and the respective FEs. The solution presented for the intersection area calculation is based on the assumption of a discretization of planar triangles with a uniform pressure distribution. After describing the procedure several examples proved its superiority against the popular direct interpolation of forces. The examples showed how the problems regarding the continuity of forces are solved with the employment of the proposed Area Distributed Method (ADM). Further assessment is needed to analyse the error introduced by the method due to the uniform approximation of the pressure and also the lack of accuracy introduced by the use of linear triangles to approximate quadratic elements. Also the performance of the method should be analysed to give a stronger support to the choice of the proposed simplifications.
The coupling has been devised with the problem of particle-structure interaction in mind in which the high frequency response given by the impacts is a matter of interest. This and the fact that multiple contacts occur along the simulation reinforce the use of a explicit integration scheme which adapted perfectly with the DEM explicit scheme. A global balance of energy of the coupled procedure is performed proving that the ADM predicts correctly the contact without the inclusion or loss of energy. The idea of using the balance of energy to check the global stability of the method has been then introduced but further developments have to be done in order to design a methodology that can be useful to that end by taking into account all energy terms in a simulation.
The modelling of cohesive materials such as rock, cement or concrete within the DEM has been put on the frame in chapter 5. Basic numerical analysis clearly highlighted the problems that the DEM presents trying to reproduce the macroscopical measures such as the Young's modulus and Poisson's ratio out of the micro parameters of the model even in the linear elastic regime. It has been clearly shown how the problem is completely mesh dependent. Apart from that, the convergence in the number of elements does not define a clear monotonous tendency. A consistent partition of the discretized domain using spheres or other simple particle shapes requires also some extra operations. An improvement to the determination of the contact areas has been proposed using virtual polyhedra which seems to consistently define the interfaces in the model in a simple and efficient manner for 2D and 3D cases involving homogeneous and heterogeneous meshes.
Even more complex is the modelling of the non-linear behaviour of materials and fracturing. The existing literature is still far from presenting a methodology that properly predicts the behaviour of material failure with meaningful results in the sense that the tracking of fractures is accurate to a level which can be useful and competitive in comparison to continuum-based methods. Some alternative exists attempting to solve the problems presented by the basic DEM which increase the complexity of the method up to a level which can make us reconsider if the employment of discontinuum-based method for a continuum mechanics problem is still advantageous against a two-scale model or a continuum-based method.
The DEMpack model has been employed in an industrial project in the prediction of the behaviour of concrete through several laboratory tests. The method, which is based on a phenomenological approach, is able to predict the failure and the strain-stress evolution after a calibration procedure. The necessary next step would be the simulation of the failure in real applications with structures in order to see whether the fitted model is capable to be extrapolated to real scenarios.
A great outcome of the present monograph is the contribution to the DEMpack software. It constitutes a versatile and complete code which has many capabilities and includes a set of user-friendly GUIs integrated in the GiD pre and post-processor ready to be applied to industrial problems in a wide range of fields. Some of the possible applications have been demonstrated with simple academical examples included in chapter 6.
The code has been developed with concerns on efficiency and has been fully parallelized using OMP. The parallelization in MPI for big clusters has been implemented only for the DE domain. Further developments in the code have to concentrate in this direction in order to earn a fully parallelized coupled DE-FE software that can be scaled up for large simulations.
Appendices
Appendix A. Hertz contact theory for spheres
Basic derivation
The case of the normal contact of two elastic bodies with spherical surface of radii and was solved by Hertz in 1882 [55]. The origin of coordinates is set at the initial contact point being the plane the common tangent plane of the two surfaces. The profile for any of the surfaces in a region at a small distance from the origin of coordinates can be described by:
|
|
(A.1) |
When a force F is applied to press the bodies together a circular contact region is produced where the pressure acts to deform the original spherical surfaces. The framework of this theory assumes that this region, characterized by the radius , is small compared to the radii of curvature . The distance between these two surfaces can be described as:
|
|
(A.2) |
where is the apparent indentation of the surfaces at the initial contact point and the displacement due to local deformation in direction in points close to . Hertz proposed a distribution of pressure under the area of contact that give rise to displacements which satisfy the equation A.2:
|
|
(A.3) |
The solution for the displacements using the proposed pressure distribution is:
|
|
(A.4) |
where is the maximum pressure located in the initial contact point . And the equivalent Young modulus is:
|
|
(A.5) |
The solution of the displacements substituted into equation A.2 yield:
|
|
(A.6) |
from which the radius of the contact circle can be derived:
|
|
(A.7) |
And the apparent indentation of the two spheres:
|
|
(A.8) |
The total contact force relates to the pressure by:
|
|
(A.9) |
Therefore, the maximum pressure is times the mean pressure in the contact region. Other useful relationships are:
|
|
(A.10) |
|
|
(A.11) |
|
|
(A.12) |
The derivation of expressions for more general cases can be found in the book by Johnson [52] and also in the book by Timoschenko [131].
Collision time in hertzian contact
Given a normal collision of two spheres and with no gravity, the time for which the spheres remain in contact can be derived from the energy balance. Before the collision the initial energy can be expressed in terms of the initial relative velocity and equivalent mass :
|
|
(A.13) |
During the contact event the kinematic energy can be expressed as:
|
|
(A.14) |
and the elastic energy produced by the elastic deformation of the spheres colliding can be obtained from the external work performed by the total contact force (equation A.12) along the relative indentation :
|
|
(A.15) |
Equating the energies:
|
|
(A.16) |
The maximum indentation is obtained when the relative velocity is zero ():
|
|
(A.17) |
An expression for the relative velocity during contact can be found from the previous equation A.16:
|
|
(A.18) |
Since the problem is symmetric, the time of the collision can be calculated as twice the time in which the indentation varies from to :
|
Further information on this topic can be found in [52] and [131].
Appendix B. Implementation of the Area Distributed Method
The different aspects of the algorithm which have to be included/modified in the basic DEM algorithm in order to implement the Area Distributed Method are detailed below.
Extended neighbour search
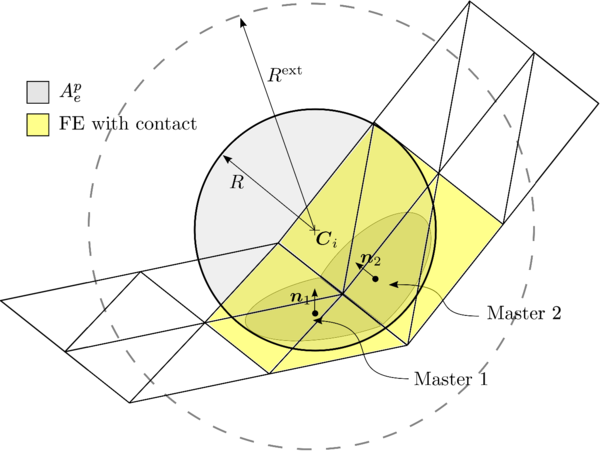
|
| Figure B.1: Concept of extended radius. FE with contact and masters are highlighted |
A cell-based global search algorithm (section 3.2.1) is applied to the DE/FE search using enlarged bounding boxes on the DEs. Figure B.1 shows an example of a particle and its extended radius . In this situation all the FEs present in the figure would be determined as FE potential neighbours. In yellow, the FE with contact that are determined by the Fast Intersection Test (section 3.3) are shown. Additionally, the two entities with valid contact are labelled as masters and their contact points depicted.
Extending the search we make sure that, during several time steps, the valid entities to consider will be included in the FE potential neighbours list and therefore, there is no need to perform the complete search every time step. Instead, the local resolution applies at every time step only for the stored FE potential neighbours. This way the continuity of tangential forces in non-smooth transitions can be ensured by employing the strategy described in section 3.5.2.
Determination of Masters and Slaves
First, the Fast Intersection is applied as usual to the FE potential neighbours to obtain the FE with contact. This has to be done every time step. Figure B.2 shows an example where the FE with contact have been highlighted with blue and pink colour.
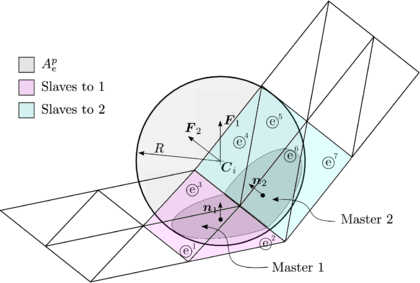
|
| Figure B.2: Contact with multiple elements from two hierarchy groups. |
Now the slaves and masters have to be determined. This is done by the elimination procedure: whenever the Distance Hierarchy (section 3.4.2) determines that a given element has hierarchy over an element , the second becomes a slave to the first. This has to be done for all pairs of neighbours determining, as usual, which are the entities with valid contact (hereafter called masters) and which are the slaves to every master. Each of the colours in Figure B.2 indicate a groups of masters and the corresponding slaves in the example. A table similar to the following one is obtained:
| Masters | Slaves |
| [] | |
| [] |
The areas of every element and their centroids are determined using simple geometry operations (described in Appendix C). The total area for every master is determined by the sum of the areas of every slave belonging to that master. . The total area of contact of the particle is the sum of all the contact areas, or equivalently, the sum of all the masters area: .
Force evaluation
First of all, the tangential force is recovered from the old one as described in equation 37. The way to determine which is the correspondent contact force in case of multi-contact ensuring continuity has been described in section 3.5.2. Next, the Hertz Mindlin contact model 2.5.2 is applied as usual, updating the normal and tangential forces in the contact together with the dissipation terms. Finally, the normal forces are scaled in every master by the total contact area:
|
|
(B.1) |
If the normal forces are not scaled, there is a sudden increase of the contact forces when new points of contact are generated due to the FE deformation (see section 4.3.2). Instead, if the total area in contact is the variable controlling the magnitude of the force, the transitions become smooth.
DE to FE force communication
Once the forces in DE are fully determined, they are communicated to the nodes of the solid in contact. Each master contact force is transmitted to its FE slaves.
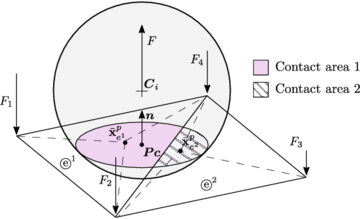
|
| Figure B.3: Contact force communicated from one DE to two FEs. |
In figure B.3 a particle is depicted which has contact with two finite elements. Since the two elements are coplanar and the contact point lies on , the method determines that is the only master; elements and itself are the slaves of this system. Therefore, the forces that are transmitted to each of the elements are determined as follows: and . The normal forces in do not need to be scaled since the area of the master coincides with the total area of contact of the particle (no other contacts are present). Now, the contribution of every element to the nodal forces are calculated by interpolation of the elemental forces evaluated at the centroids of every intersection area:
|
|
(B.2) |
Finally, those forces are nodally assembled yielding the total nodal forces . This is the case of nodes and in the example, which receive the contribution from the two elements.
Appendix C. Circle-triangle intersections
In general, the intersection of a sphere and a linear triangle in a 3D space yields to a 2D geometry composed by circular and straight lines. Figure C.1 shows one of the possible situations.
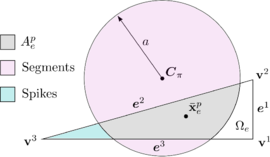
|
| Figure C.1: Possible intersection between sphere and triangle |
The basic geometrical expressions developed in section 3.3 will be useful here. is the centre of the sphere projected onto the plane (review figure 30) and is the radius of the intersection circle which is related to the indentation as follows: being the radius of sphere. are the coordinates of the nodes and are the vectors joining the vertices that define the edges.
The grey area, denoted corresponds to the particle with the element, i.e. the intersection of the triangle and the circle. The total area of the circle will be denoted and it is simply calculated as: . Note that, in a general case, the real intersection is smaller than the total circle area, . The areas coloured cyan and magenta help the definition of two types of auxiliary regions that will be useful for the determination of and :
- Segments: Outer or inner areas of the circle that are completely cut only by an edge.
- Spikes: Outer or inner areas of the triangle, cut by the circle, which contain only one vertex.
With the above definitions we can say that figure C.1 contains an outer spike on vertex and two outer segments, one on edge and another one on edge .
In general, the area and centroid of any geometry composed by basic parts with areas and centroids can be defined by:
|
Where the area will be introduced with sign to consider the case of subtraction.
Basic geometry definitions
Circle
|
Triangle
|
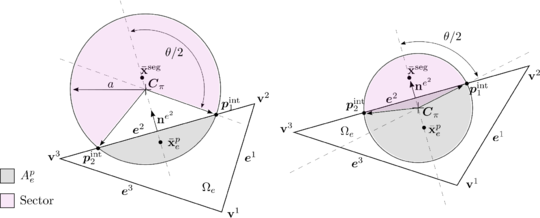
|
| Figure C.2: Possible cases of sector from the intersection of a circle and a triangle |
|
Segment
|
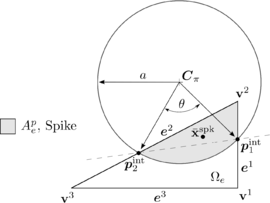
|
| Figure C.3: Spike defined from the intersection of a circle and a triangle |
|
Classification table
Aiming to have an efficient way to compute the intersections and their centroids, a classification is suggested here which divides the possible configurations in 8 different cases which are easy and fast to identify. The classification is based on two criteria: Number of vertices circumscribed in the circle and number of edges crossed by the circle.
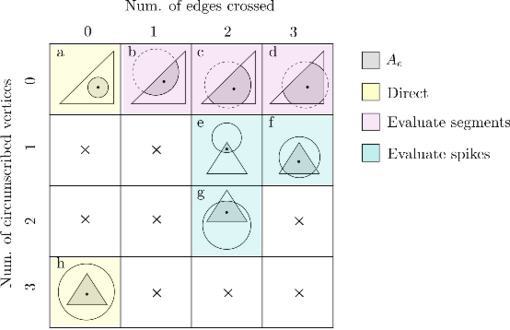
|
| Figure C.4: Possible intersection between sphere and triangle |
Each of the case is determined by composition of the different geometrical elements involved:
Once the case is determined by applying simple geometry, a specific procedure is applied:
- Evaluate the full circle.
- Subtract the only segment from the circle.
- Subtract the two segments from the circle.
- Subtract the three segments from the circle.
- Evaluate the only spike.
- Substract the two spikes from the triangle.
- Subtract the only spike from the triangle.
- Evaluate the full triangle.
BIBLIOGRAPHY
[1] Truesdell, C. and Noll, W. (1919) "The Non-Linear Field Theories of Mechanics". Springer
[2] Cundall, P. A. and Strack, O. D. L. (1979) "A Discrete Numerical Model for Granular Assemblies", Volume 29. Géotechnique 1 47–65
[3] Xiao, S. P. and Belytschko, T. (2004) "A bridging domain method for coupling continua with molecular dynamics", Volume 193. Computer Methods in Applied Mechanics and Engineering 17-20 1645 - 1669
[4] Wellmann, C. (2011) "A two-scale model of granular materials using a coupled DE-FE appoach". Institut für Kontinuumsmechanik, Leibniz Universität Hannover
[5] Rojek, J. and Oñate, E. (2007) "Multiscale analysis using a coupled discrete/finite element model", Volume 1. Interaction and Multiscale Mechanics 1 1-31
[6] Labra, C. and Ooi, J. Y. and Sun, J. (2013) "Spatial and temporal coarse-graining for DEM analysis", Volume 1542. AIP Conference Proceedings 1 1258-1261
[7] Belytschko, T. and Neal, M. O. (1991) "Contact-impact by the pinball algorithm with penalty and Lagrangian methods", Volume 31. John Wiley & Sons, Ltd. International Journal for Numerical Methods in Engineering 3 547–572
[8] Zárate, F. and Oñate, E. (2015) "A simple FEM-DEM technique for fracture prediction in materials and structures", Volume 2. Computational Particle Mechanics 301-314
[9] Gethin, D. T. and Ransing, R. S. and Lewis, R. W. and Dutko, M. and Crook, A. J. L. (2001) "Numerical comparison of a deformable discrete element model and an equivalent continuum analysis for the compaction of ductile prorus material", Volume 79. Computers and Structures 1287–1294
[10] Li, Sh. and Zhao M. H. and Wang Y. N. et al. (2004) "A new Numerical Method for DEM-Block and Particle Model", Volume 41. International Journal of Rock Mechanics and Mining Scieneces 3
[11] Cundall, P. A. (1971) "A Computer Model for Simulating Progressive Large Scale Movements in Blocky Rock Systems". Int. Symp. On Rock Fracture 2-8
[12] Ketterhagen, W. R. and Curtis, J. S. and Wassgren, C. R. (2005) "Stress results from two-dimensional granular shear flow simulations using various collision models", Volume 71. American Physical Society. Phys. Rev. E 061307
[13] Feng, Y. T. and Han, K. and Owen, D. R. J. and Loughran, J. (2009) "On upscaling of discrete element models: similarity principles", Volume 26. Engineering Computations 6 599-609
[14] Horner, D. A. and Peters and F. J. and Carrillo, A. (2001) "Large Scale Discrete Element Modeling of Vehicle-Soil Interaction", Volume 127. Journal of Engineering Mechanics 10 1027–1032
[15] Jiang, M. and Yu, H.-S. (2006) "Application of Discrete Element Method to Geomechanics". Modern Trends in Geomechanics. Springer Berlin Heidelberg 241–269
[16] Zhu, H. P. and Zhou, Z. Y. and Yang, R. Y. and Yu, A. B. (2008) "Discrete particle simulation of particulate systems: A review of major applications and findings", Volume 63. Chemical Engineering Science 23 5728 - 5770
[17] Owen, P. J. and Cleary, P. W. (2009) "Prediction of screw conveyor performance using the Discrete Element Method (DEM)", Volume 193. Powder Technology 3 274 - 288
[18] Pezo, L. and Jovanovi, A. and Pezo, M. and Colovi, R. and Loncar, B. (2015) "Modified screw conveyor-mixers - Discrete element modeling approach", Volume 26. Advanced Powder Technology 5 1391 - 1399
[19] Asmar, N. B. and Langston, A. P. and Matchett, J. A. (2002) "A generalised mixing index in distinct element method simulation of vibrated particulate beds", Volume 4. Granular Matter 3 129–138
[20] Chung, Y. C. and Liao, H. H. and Hsiau, S. S. (2013) "Convection behavior of non-spherical particles in a vibrating bed: Discrete element modeling and experimental validation ", Volume 237. Powder Technology 53 - 66
[21] Mishra, B. K. and Rajamani, R. K. (1992) "The discrete element method for the simulation of ball mills", Volume 16. Applied Mathematical Modelling 11 598 - 604
[22] Kalala, J. T. and Bwalya, M. M. and Moys, M. H. (2005) "Discrete element method (DEM) modelling of evolving mill liner profiles due to wear. Part I: DEM validation", Volume 18. Minerals Engineering 15 1386 - 1391
[23] Nakashima, H. and Oida, A. (2004) "Algorithm and implementation of soil–tire contact analysis code based on dynamic FE–DE method", Volume 41. Journal of Terramechanics 2–3 127–137
[24] Han, K. and Owen, D. R. J. and Peri, D. (2002) "Combined finite/discrete element and explicit/implicit simulations of peen forming process", Volume 19. Engineering Computations 1 92–118
[25] Murugaratnam, K. and Utili, S. and Petrinic, N. (2015) "A combined DEM-FEM numerical method for Shot Peening parameter optimisation", Volume 79. Advances in Engineering Software 13 - 26
[26] Leonardi, A. and Wittel, F. K. and Mendoza, M. and Vetter, R. and Herrmann, H. J. (2016) "Particle-Fluid-Structure Interaction for Debris Flow Impact on Flexible Barriers", Volume 31. Computer-Aided Civil and Infrastructure Engineering 5 323-333
[27] Dang, H. K. and Meguid, M. A. (2013) "An efficient finite-discrete element method for quasi-static nonlinear soil-structure interaction problems", Volume 37. International Journal for Numerical and Analytical Methods in Geomechanics 2 130–149
[28] Zhu, H. P. and Zhou, Z. Y. and Yang, R. Y. and Yu, A. B. (2007) "Discrete particle simulation of particulate systems: Theoretical developments", Volume 62. Chemical Engineering Science 13 3378 - 3396
[29] Tong, Sh. and Zhao, J. (2014) "A coupled CFD-DEM analysis of granular flow impacting on a water reservoir", Volume 225. Acta Mechanica 8 2449–2470
[30] Durán, O. and Andreotti, B. and Claudin, P. (2014) "Turbulent and viscous sediment transport - a numerical study", Volume 37. Advances in Geosciences 73–80
[31] Bravo, R. and Ortiz, P. and Pérez-Aparicio, J. L. (2014) "Incipient sediment transport for non-cohesive landforms by the discrete element method (DEM)", Volume 38. Applied Mathematical Modelling 4 1326 - 1337
[32] Maurin, R. and Chauchat, J. and Chareyre, B. and Frey, P. (2015) "A minimal coupled fluid-discrete element model for bedload transport", Volume 27. Physics of Fluids 11
[33] Donze, F. and Richefeu, F. and Magnier, S. (2009) "Advances in discrete element method applied to soil, rock and concrete mechanics", Volume 8. Electronic Journal of Geotechology Engineering 1–44
[34] Huang, H. (1999) "Discrete element modeling of tool-rock interaction". University of Minnesota
[35] Labra, C. and Rojek, J. and Oñate and E. and Zárate, F. (2009) "Advances in discrete element modelling of underground excavations", Volume 3. Acta Geotechnica 4 317–322
[36] Oñate, E. and Zárate, F. and Miquel, J. and Santasusana, M. and Celigueta, M. A. and Arrufat, F. and Gandikota, R. and Valiullin, K. and Ring, L. (2015) "A local constitutive model for the discrete element method. Application to geomaterials and concrete", Volume 2. Comp Part Mech 2 139–160
[37] Williams, J. R. and O'Connor, R. (1999) "Discrete element simulation and the contact problem", Volume 6. Arch Comput Method E 4 279–304
[38] Munjiza, A. (2004) "The Combined Finite-Discrete Element Method". Wiley, 1 edition Edition
[39] Munjiza, A. and Andrews, K. R. F. (1998) "NBS contact detection algorithm for bodies of similar size", Volume 43. John Wiley & Sons, Ltd. International Journal for Numerical Methods in Engineering 1 131–149
[40] Williams, J. R. and Perkins, E. and Cook, B. (2004) "A contact algorithm for partitioning N arbitrary sized objects", Volume 21. Engineering Computations 2/3/4 235–248
[41] Munjiza, A. and Rougier, E. and John, N. W. M. (2006) "MR linear contact detection algorithm", Volume 66. John Wiley & Sons, Ltd. International Journal for Numerical Methods in Engineering 1 46–71
[42] Bonet, J. and Peraire, J. (1991) "An alternating digital tree (ADT) algorithm for 3D geometric searching and intersection problems", Volume 31. John Wiley & Sons, Ltd. International Journal for Numerical Methods in Engineering 1 1–17
[43] Williams, J. R. and O'Connor, R. (1995) "A linear complexity intersection algorithm for discrete element simulation of arbitrary geometries", Volume 12. Emerald. Engineering Computations 2 185-201
[44] Feng, Y.T. and Owen, D.R.J. (2002) "An augmented spatial digital tree algorithm for contact detection in computational mechanics", Volume 55. John Wiley & Sons, Ltd. International Journal for Numerical Methods in Engineering 2 159–176
[45] Li, C. F. and Feng, Y. T. and Owen, D. R. J. (2006) "SMB: Collision detection based on temporal coherence", Volume 195. Computer Methods in Applied Mechanics and Engineering 19-22 2252 - 2269
[46] Han, K. and Feng, Y. T. and Owen, D. R. J. (2007) "Performance comparisons of tree-based and cell-based contact detection algorithms", Volume 24. Engineering Computations 2 165-181
[47] Boon, C. W. and Houlsby, G. T. and Utili, S. (2013) "A new contact detection algorithm for three-dimensional non-spherical particles", Volume 248. Powder Technol 94–102
[48] Nezami, E. G. and Hashash, Y. M. A. and Zhao, D. and Ghaboussi, J. (2004) "A fast contact detection algorithm for 3-D discrete element method", Volume 31. Comput Geotech 7 575–587
[49] Boon, C. W. and Houlsby, G. T. and Utili, S. (2012) "A new algorithm for contact detection between convex polygonal and polyhedral particles in the discrete element method", Volume 44. Comput Geotech 73–82
[50] Eliás, J. (2014) "Simulation of railway ballast using crushable polyhedral particles", Volume 264. Powder Technol 458–465
[51] Verlet, L. (1967) "Computer "Experiments" on Classical Fluids. I. Thermodynamical Properties of Lennard-Jones Molecules", Volume 159. American Physical Society. Phys. Rev. 98–103
[52] Johnson, K. L. (1987) "Contact Mechanics". Cambridge University Press
[53] Di Renzo, A. and Di Maio, F. P. (2004) "Comparison of contact-force models for the simulation of collisions in DEM-based granular flow codes", Volume 59. Chemical Engineering Science 3 525 - 541
[54] Thornton, C. and Cummins S. J. and Cleary, P. W. (2013) "An investigation of the comparative behaviour of alternative contact force models during inelastic collisions", Volume 233. Powder Technology 30 - 46
[55] Hertz, H. (1882) "ber die Berührung fester elastischer Körper", Volume 92. Journal für die Reine und Angewandte Mathematik 156–171
[56] Mindlin, R. D. and Deresiewicz, H. (1953) "Elastic spheres in contact under varying oblique force", Volume 20. Transactions of ASME, Series E. Journal of Applied Mechanics 327–344
[57] Vu-Quoc, L. and Zhang, X. (1999) "An accurate and efficient tangential force-displacement model for elastic frictional contact in particle-flow simulations", Volume 31. Mechanics of Materials 4 235 - 269
[58] Tsuji, Y. and Tanaka, T. and Ishida, T. (1992) "Lagrangian numerical simulation of plug flow of cohesionless particles in a horizontal pipe", Volume 71. Powder Technology 3 239 - 250
[59] Mindlin, R. D. (1949) "Compliance of elastic bodies in contact", Volume 16. J Appl Mech 259-268
[60] Walton, O. R. and Braun, R. L. (1986) "Viscosity, granular-temperature, and stress calculations for shearing assemblies of inelastic, frictional disks", Volume 30. Journal of Rheology 5 949-980
[61] Thornton, C. (1997) "Coefficient of Restitution for Collinear Collisions of Elastic-Perfectly Plastic Spheres", Volume 64. ASME. J. Appl. Mech. 2 383–386
[62] Navarro, H. A. and de Souza Braun, M. P. (2013) "Determination of the normal spring stiffness coefficient in the linear spring-dashpot contact model of discrete element method", Volume 246. Powder Technology 707 - 722
[63] Teufelsbauer, H. and Hübl, J. and Wu, W. (2009) "A Revision of the Linear-Dashpot Model Applied in PFC", Volume 2. Contemporary Engineering Sciences 4 165–178
[64] Schwager, T. and Pöschel, T. (2007) "Coefficient of restitution and linear–dashpot model revisited", Volume 9. Granular Matter 6 465–469
[65] Sun, J. and Battaglia, F. and Subramaniam, S. (2007) "Hybrid Two-Fluid DEM Simulation of Gas-Solid Fluidized Beds", Volume 139. Journal of Fluids Engineering 11 1394–1403
[66] Shäfer, J. and Dippel, S and Wolf, D. (1996) "Force Schemes in Simulation of Granular Materials", Volume 6. Journal de Physique I 1 5-22
[67] Thornton, C. and Cummins S. J. and Cleary, P. W. (2011) "An investigation of the comparative behaviour of alternative contact force models during elastic collisions", Volume 210. Powder Technology 3 189 - 197
[68] Leonard, B. D. and Sadeghi, F. and Shinde, S. and Mittelbach, M. (2013) "Rough surface and damage mechanics wear modeling using the combined finite-discrete element method", Volume 305. Wear 1-2 312 - 321
[69] Akhondizadeh, M. and Fooladi Mahani, M. and Mansouri, S. H. and Rezaeizadeh, M. (2013) "A computational wear model of the oblique impact of a ball on a flat plate". Journal of Solid Mechanics
[70] Rojek, J. (2014) "Discrete element thermomechanical modelling of rock cutting with valuation of tool wear", Volume 1. Computational Particle Mechanics 1 71–84
[71] Wensrich, C. M. and Katterfeld, A. (2012) "Rolling friction as a technique for modelling particle shape in DEM", Volume 217. Powder Technol 409–417
[72] Irazábal, J. (2015) "Numerical modeling of railway ballast using the discrete element method". Escola Tecnica Superior d'Enginers de Camins Canals i Ports, Universitat Politecnica de Catalunya
[73] O'Sullivan, C. and Bray, J. D. (2001) "A comparative evaluation of two approaches to discrete element modeling of particulate media". Proc. of the Fourth Int. Conf. on Discontinuous Deformation, University of Glasgow, Scotland UK. 97-110
[74] Samiei, K. and Peters, B. and Bolten, M. and Frommer, A. (2013) "Assessment of the potentials of implicit integration method in discrete element modelling of granular matter", Volume 49. Computers & Chemical Engineering 183 - 193
[75] Ke, T.-C. and Bray, J. D. (1995) "Modeling of particulate media using discontinuous deformation analysis", Volume 121. Eng. Mechanics 11 1234-1243
[76] Belytschko, T. and Liu, W. K. and Moran B. (2000) "Nonlinear Finite Elements for Continua and Structures". John Wiley & Sons, Ltd
[77] Swope, W. C. and Andersen, H. C. and Berens, P. H. and Wilson, K. R. (1982) "A computer simulation method for the calculation of equilibrium constants for the formation of physical clusters of molecules: Application to small water clusters", Volume 76. The Journal of Chemical Physics 1 637-649
[78] Newmark, N. M. (1959) "A method of computation for structural dynamics", Volume 85. Journal of Engineering Mechanics 67-94
[79] Oñate, E. and Rojek, J. (2004) "Combination of discrete element and finite element method for analysis of geomechanics problems", Volume 193. Comput Meth Appl M 3087–3128
[80] Kremmer, M. and Favier, J. F. (2001) "A method for representing boundaries in discrete element modellingpart II: Kinematics", Volume 51. International Journal for Numerical Methods in Engineering 12 1423–1436
[81] O'Sullivan, C. and Bray, J. D. (2004) "Selecting a suitable time step for discrete element simulations that use the central difference time integration scheme", Volume 21. Engineering Computations 2/3/4 278-303
[82] Samiei, K. (2012) "Assessment of Implicit and Explicit Algorithms in Numerical Simulation of Granular Matter". The Faculty of Sciences, Technology and Communication, University of Luxembourg
[83] Campbell, C. S. (2009) "Granular Flows in the Elastic Limit". Particulate Gravity Currents. Blackwell Publishing Ltd. 83–89
[84] Thompson, P. A. and Grest, G. S. (1991) "Granular flow: Friction and the dilatancy transition", Volume 67. American Physical Society. Phys. Rev. Lett. 1751–1754
[85] Dury, C. M. and Ristow, G. H. (1997) "Radial Segregation in a Two-Dimensional Rotating Drum", Volume 7. EDP Sciences. Journal de Physique I 5 737–745
[86] Lu, M. and McDowell, G. R. (2006) "The importance of modelling ballast particle shape in the discrete element method", Volume 9. Granular Matter 1 69–80
[87] Andrade, J. E. and Lim, K.-W. and Avila, C. F. and Vlahini, I. (2012) "Granular element method for computational particle mechanics", Volume 241-244. Compu Method Appl 262 - 274
[88] Garcia, X. and Xiang, J. and Latham, J.-P. and Harrison, J.-P. (2009) "A clustered overlapping sphere algorithm to represent real particles in discrete element modelling", Volume 59. Géotechnique 9 779-784
[89] Höhner, D. and Wirtz, S. and Kruggel-Emden, H. and Scherer, V. (2011) "Comparison of the multi-sphere and polyhedral approach to simulate non-spherical particles within the discrete element method: Influence on temporal force evolution for multiple contacts", Volume 208. Powder Technology 3 643 - 656
[90] Zhao, F. and van Wachem, B. G. M. (2013) "A novel Quaternion integration approach for describing the behaviour of non-spherical particles", Volume 224. Acta Mechanica 12 3091–3109
[91] Altmann, S. L. (1986) "Rotations, Quaternions, and Double Groups", Volume 3
[92] Munjiza, A. and Latham, J. P. and John, N. W. M. (2003) "3D dynamics of discrete element systems comprising irregular discrete elements-integration solution for finite rotations in 3D", Volume 56. John Wiley & Sons, Ltd. International Journal for Numerical Methods in Engineering 1 35–55
[93] Lillie, C. (2007) "Dreidimensionales Diskrete EElement Modell für Superellipsoide". Institut für Baumechanik und Numerische Mechanik, Leibniz Universität Hannover
[94] Häggström, O. and Meester, R. (1996) "Nearest neighbor and hard sphere models in continuum percolation", Volume 9. Wiley Subscription Services, Inc., A Wiley Company. Random Structures & Algorithms 3 295–315
[95] Lin, X. and Ng, T.-T. (1997) "A three-dimensional discrete element model using arrays of ellipsoids", Volume 47. Géotechnique 2 319-329
[96] Evans, J. W. (1993) "Random and cooperative sequential adsorption", Volume 65. American Physical Society. Rev. Mod. Phys. 1281–1329
[97] Feng, Y. T. and Han, K. and Owen, D. R. J. (2003) "Filling domains with disks: an advancing front approach", Volume 56. John Wiley & Sons, Ltd. International Journal for Numerical Methods in Engineering 5 699–713
[98] Bagi, K. (1993) "Special Issue on Mechanics of Granular Materials A quasi-static numerical model for micro-level analysis of granular assemblies", Volume 16. Mechanics of Materials 1 101 - 110
[99] Bagi, K. (2005) "An algorithm to generate random dense arrangements for discrete element simulations of granular assemblies", Volume 7. Granular Matter 1 31–43
[100] Löhner, R. and Oñate, E. (2004) "A general advancing front technique for filling space with arbitrary objects", Volume 61. John Wiley & Sons, Ltd. International Journal for Numerical Methods in Engineering 12 1977–1991
[101] Labra, C. (2012) "Advances in the development of the discrete element method for excavation processes". Escola Tecnica Superior d'Enginers de Camins Canals i Ports, Universitat Politecnica de Catalunya
[102] Lubachevsky, B. D. and Stillinger, F. H. (1990) "Geometric Properties of Random Disk Packings", Volume 60. Journal of Statistical Physics 561-583
[103] Bargie, M. (2008) "Geometrical Properties of Simulated Packings of Spherocylinders". Computational Science – ICCS 2008: 8th International Conference, Kraków, Poland, June 23-25, 2008, Proceedings, Part II. Springer Berlin Heidelberg 126–135
[104] Santasusana, M. and Irazábal, J. and Oñate, E. and Carbonell, J. M. (2016) "The Double Hierarchy Method. A parallel 3D contact method for the interaction of spherical particles with rigid FE boundaries using the DEM", Volume 3. Computational Particle Mechanics 3 407–428
[105] Kodam, M. and Bharadwaj, R. and Curtis, J. S. and Hancock, B. and Wassgren, C. (2009) "Force model considerations for glued-sphere discrete element method simulations", Volume 64. Chemical Engineering Science 15 3466–3475
[106] Zang, M. and Gao, W. and Lei, Zh. (2011) "A contact algorithm for 3D discrete and finite element contact problems based on penalty function method", Volume 48. Comput Mech 541–550
[107] Su, J. and Gu, Zh. and Zhang, M. and Xu, X. Y. (2011) "Discrete element simulation of particle flow in arbitrarily complex geometries", Volume 66. Chemical Engineering Science 23 6069–6088
[108] Su, J. and Gu, Zh. and Zhang, M. and Xu, X. Y. (2014) "An improved version of RIGIDfor discrete element simulation of particle flows with arbitrarily complex geometries", Volume 253. Powder Technology 393–405
[109] Hu, L. and Hu, G. M. and Fang, Z. Q. and Zhang, Y. (2013) "A new algorithm for contact detection between spherical particle and triangulated mesh boundary in discrete element method simulations", Volume 94. International Journal for Numerical Methods in Engineering 8 787–804
[110] Chen, H. and Zhang, Y. X. and Zang, M. and Hazell, P. J. (2015) "A new contact detection algorithm for particle-solid interaction in finite-discrete element analysis", Volume 103. International Journal for Numerical Methods in Engineering 598–624
[111] Karabassi, E.-A. and Papaioannou, G. and Theoharis, T. and Boehm, A. (1999) "Intersection Test for Collision Detection in Particle Systems", Volume 4. Journal of Graphics Tools 1 25-37
[112] Ericson, C. (2004) "Real-Time Collision Detection (The Morgan Kaufmann Series in Interactive 3D Technology)". Morgan Kaufmann Publishers Inc.
[113] Wang, Sh. P. and Nakamachi, E. (1997) "The inside–outside contact search algorithm for finite element analysis", Volume 40. John Wiley & Sons, Ltd. International Journal for Numerical Methods in Engineering 19 3665–3685
[114] Zhong, Z. H. (1993) "Finite Element procedures for contact-impact problems". Oxford University Press
[115] Meyer, M. and Barr, A. and Lee, H. and Desbrun, M. (2002) "Generalized Barycentric Coordinates on Irregular Polygons", Volume 7. Journal of Graphics Tools 1 13–22
[116] Sukumar, N. and Tabarraei, A. (2004) "Conforming polygonal finite elements", Volume 61. John Wiley & Sons, Ltd. International Journal for Numerical Methods in Engineering 12 2045–2066
[117] Wriggers, P. (2002) "Computational Contact Mechanics". John Wiley & Sons Ltd
[118] Casas, G. and Mukherjee, D. and Celigueta, M. A. and Zohdi, T. and Oñate, E. (2015) "A modular, partitioned, discrete element framework for industrial grain distribution systems with rotating machinery". Comp Part Mech 1–18
[119] Bathe, K.-J. (1996) "Finite Element Procedures". Prentice hall
[120] Crisfield, M. A. (2000) "Non-Linear Finite Element Analysis of Solids and Structures". John Wiley & Sons Ltd
[121] Zienkiewicz, O. C. and Taylor, R. L. and Fox, D. (2014) "The Finite Element Method for Solid and Structural Mechanics, Seventh Edition". Butterworth-Heinemann
[122] Wriggers, P. (2008) "Nonlinear FInite Element Methods". Springer
[123] Chaves, E. W. V. (2013) "Notes on Continuum Mechanics". Springer
[124] Bonet, J. and Wood, R. D. (1997) "Nonlinear Continuum Mechanics for Finite Element Analysis". Cambridge University Press
[125] Lubliner, J. (1990) "Plastic Theory". Dover Publications
[126] Simo, J. C. and Miehe, C. (1992) "Associative coupled thermoplasticity at finite strains: Formulation, numerical analysis and implementation", Volume 98. Computer Methods in Applied Mechanics and Engineering 1 41 - 104
[127] Michael, M. and Vogel, F. and Peters, B. (2015) "DEM–FEM coupling simulations of the interactions between a tire tread and granular terrain", Volume 289. Computer Methods in Applied Mechanics and Engineering 227–248
[128] Han, K. and Peri, D. and Crook, A. J. L. and Owen, D. R. J. (2000) "A combined finite/discrete element simulation of shot peening processes – Part I: studies on 2D interaction laws", Volume 17. Engineering Computations 5 593–620
[129] Han, K. and Peri, D. and Owen, D. R. J. and Yu, J. (2000) "A combined finite/discrete element simulation of shot peening processes – Part II: 3D interaction laws", Volume 17. Engineering Computations 6 680–702
[130] Puso, M. A. and Laursen, T. A. (2004) "A mortar segment-to-segment frictional contact method for large deformations", Volume 193. Computer Methods in Applied Mechanics and Engineering 45-47 4891 - 4913
[131] Timoshenko, S. and Goodier, J. N. (1951) "Theory of elasticity". McGraw-Hill
[132] Meijaard, J. (2007) "Lateral Impacts on Flexible Beams in Multibody Dynamics Simulations", Volume 1. IUTAM Symposium on Multiscale Problems in Multibody System Contacts. Springer Netherlands 173–182
[133] Rojek, J. and Labra, C. and Su, O. and Oñate, E. (2012) "Comparative study of different micromechanical parameters", Volume 49. International Journal of Solids and Structures 1497–1517
[134] Hsieh, Y.-M. and Li, H.-H. and Huang, T.-H. and Jeng, F.-S. (2008) "Interpretations on how the macroscopic mechanical behavior of sandstone affected by microscopic properties - Revealed by bonded - particle model", Volume 99. Engineering Geology 1-2 1 - 10
[135] Fakhimi, A. and Villegas, T. (2007) "Application of dimensional analysis in calibration of a discrete element model for rock deformation and fracture", Volume 40. Rock Mechanics and Rock Engineering 2 193–211
[136] Hentz, S. and Daudeville, L. and Donzé, F.-V. (2004) "Identification and validation of a discrete element model for concrete", Volume 130. Journal of Engineering Mechanics 6 709–719
[137] Potyondy, D. and Cundall, P. (2004) "A bonded-particle model for rock", Volume 41. International Journal of Rock Mechanics and Mining Sciences 8 1329–1364
[138] Tavarez, F. A. and Plesha, M. E. (2007) "Discrete element method for modelling solid and particulate materials", Volume 70. International Journal for Numerical Methods in Engineering 379-404
[139] Tran, V. T. and Donzé, F.-V. and Marin, P. (2011) "A discrete element model of concrete under high triaxial loading", Volume 33. Cement & Concrete Composites 936–48
[140] Moharnmadi, S. and Owen, D. R. J. and Peric, D. (1998) "A combined finite/discrete element algorithm for delamination analysis of composites", Volume 28. Finite Elements in Analysis and Design 4 321 - 336
[141] Ming, Ch. and Weifu, L. and Kaixin, L. (2009) "New discrete element models for elastoplastic problems", Volume 25. Acta Mechanica Sinica 5 629–637
[142] Yang, B. and Jiao, Y. and Lei, S. (2006) "A study on the effects of microparameters on macroproperties for specimens created by bonded particles", Volume 23. International Journal for Computer-Aided Engineering and Software 6 607-631
[143] Sfer, D. and Carol, I. and Gettu, R. and Etse, G. (2002) "Study of the behaviour of concrete under triaxial compression", Volume 128. Journal of Engineering Mechanics 2 156-163
[144] Wang, H.-C. and Zhao, W.-H. and Sun, D.-S. and Guo, B.-B. (2012) "Mohr-Coulomb yield criterion in rock plastic mechanics", Volume 55. Chinese Journal of Geophysics 6 733–71
[145] Lubliner, L. and Oller, S. and Oliver, J. and Oñate, E. (1989) "A plastic damage model for concrete", Volume 25. International Journal of Solids and Structures 3 299–326
[146] Santasusana, M. (2013) "Kratos DEM, a Parallel Code for Concrete Testing Simulations using the Discrete Element Method". Escola Tecnica Superior d'Enginers de Camins Canals i Ports, Universitat Politecnica de Catalunya
[147] Bagi, K. (1996) "Stress and strain in granular assemblies", Volume 22. Mechanics of Materials 165–177
[148] Kruyt, N. and Rothenburg. L. (2004) "Kinematic and static assumptions for homogenization in micromechanics of granular materials", Volume 36. Mechanics of Materials 12 1157–1173
[149] Dadvand, P. and Rossi, R. and Oñate, E. (2010) "An object-oriented environment for developing finite element codes for multi-disciplinary applications", Volume 17. Springer. Arch Comput Method E 3 253–297
[150] Qian, Y. and Lee, S. J. and Tutumluer, E. and Hashash, Y. M. A. and Mishra, D. and Ghaboussi, J. (2013) "Simulating ballast shear strenght grom large-scale triaxial tests: Discrete Element Method", Volume 2374. Journal of the transportation research board 126-135
Document information
Published on 16/02/18
Submitted on 16/02/18
Licence: CC BY-NC-SA license
Share this document
Keywords
claim authorship
Are you one of the authors of this document?
